


Columns 11 - 15 of Table 3 contain the K magnitude, K colors, and CO and H2O indices corrected for reddening and redshift. Columns 5 and 6 of Table 4 contain U - V and V - K colors also corrected for reddening and redshift.
In Figures 3 - 9 the measurements from Tables 3 and 4 are plotted against log A / D0. 6 The galaxies have been separated into seven groups: S0, S0+, and I0; S0/a, Sa, Sab; Sb; Sbc; Sc; Scd, Sd, and Im; and "2.2 µm excess." Preliminary plots of the J - H color against H - K for all multiaperture data revealed a small number of galaxies with very red colors distinctly segregated from the region of general scatter of the remaining galaxy points. The term "2.2 µm excess" has been adopted in referring to these 12 objects, and these galaxies have been grouped separately because in the discussion to follow we are primarily interested in galaxian infrared colors as they relate to the stellar population, and not to the various non-stellar effects which produce, the anomalously red colors (Section V).
 |
Figure 3. The colors for S0, S0+, and I0 galaxies from Tables 3 and 4, corrected for reddening and redshift, are shown as a function of log A / D0, the ratio of aperture size to corrected face-on diameter from de Vaucouleurs, de Vaucouleurs, and Corwin (1976). The lines shown in a) and b) connect multiaperture observations of a particular galaxy. Data points for the multiaperture observations are plotted only to distinguish among morphological types. The error bars shown in this and all succeeding figures are the adopted nominal errors from Tables 3 and 4. When two lines intersect, one is shown as dashed. |
 |
Figure 4. Same as Figure 3, for galaxy types S0/a, Sa, and Sab. |
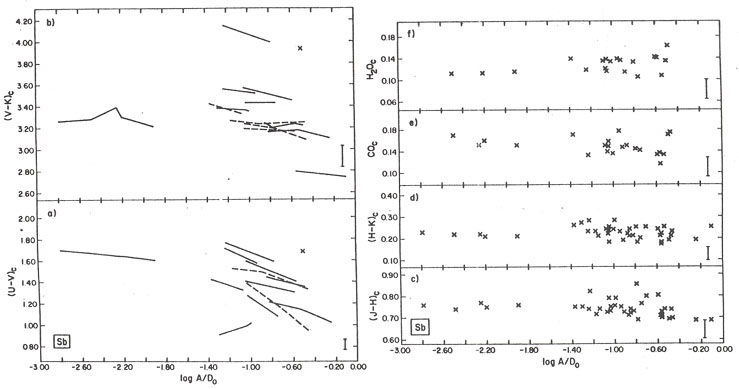 |
Figure 5. Same as Figure 3, for galaxy type Sb. |
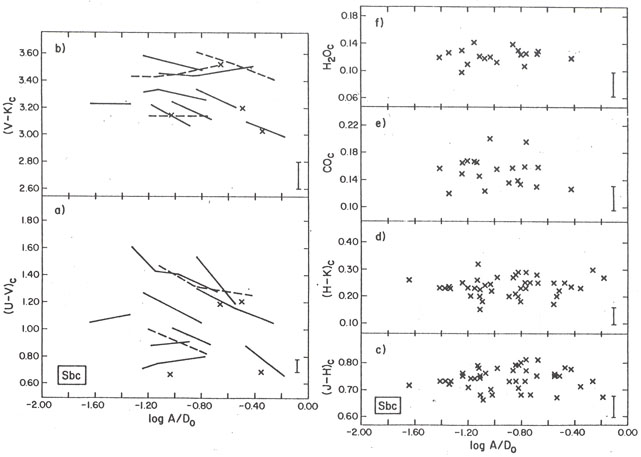 |
Figure 6. Same as Figure 3, for galaxy type Sbc. |
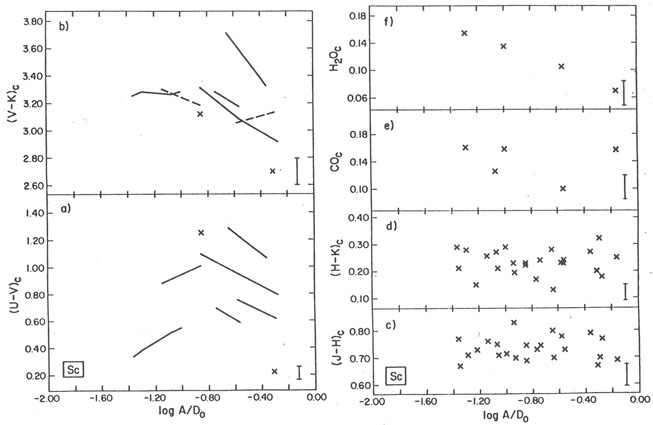 |
Figure 7. Same as Figure 3, for galaxy type Sc. |
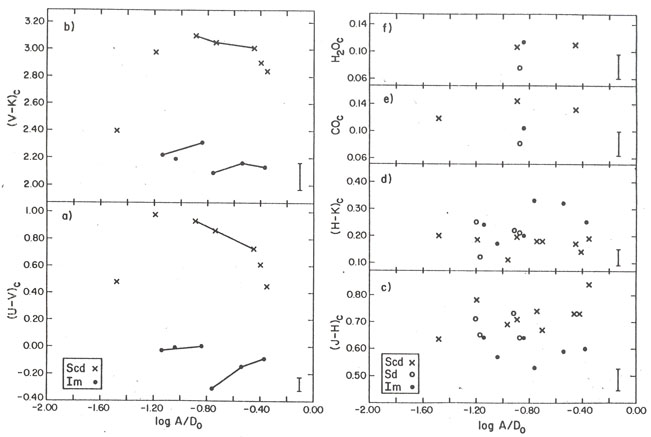 |
Figure 8. Same as Figure 3, for galaxy types Scd, Sd, and Im. |
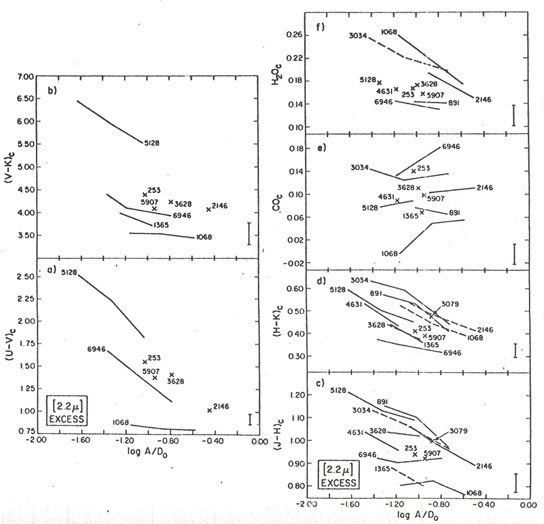 |
Figure 9. Same as Figure 3, for galaxies with a significant 2.2 µm excess. Lines connect all multiaperture observations in a) - f). The NGC numbers of the galaxies are also shown. |
Ideally, to determine mean color-aperture relations, a "color growth curve" should be constructed in a manner analogous to that in which a normal magnitude growth curve is made. Such a construction was in fact attempted, but because the data is scattered over a large range of log A / D0 mostly from -0.2 to -1.6, while the data for almost all galaxies individually extends over less than half this range, unambiguous results could not be achieved. We have instead followed the same procedure as in Paper I: Multi-aperture data for each galaxy was fit with a least squares line, and the slopes so determined were averaged together. While UBV color-aperture curves apparently flatten out at very large and very small apertures (RC2), such curves are in fact approximately linear over the predominant range of aperture sizes in this paper, and so we have some confidence that our own forced linear fits will not be too misleading.
The resulting mean color-aperture slopes are summarized in Table 7, and confirm the qualitative impressions of Figures 3 - 9: First, excluding the 2.2 µm excess galaxies, no statistically significant radial color gradients are found in spirals for either the J - H and H - K colors, or the CO and H2O indices. Second, significant U - V and V - K color gradients do exist for galaxies of all types, and are correlated in the sense that smaller: apertures generally imply redder colors. Considering the small sample size, the U - V gradients listed in Table 7 are consistent with the linear U - V fits found by de Vaucouleurs and de Vaucouleurs (1972). Third, galaxies with a 2.2 µm excess exhibit large radial gradients in all colors and indices, in the sense of redder broad-band colors, larger H2O absorption, and smaller CO absorption, at smaller aperture sizes. The behavior of the narrow-band indices is as expected from reddening effects (Section IIf).
| CO | H2O | U-V | V-K | J-H | H-K | ||||||||||||||||
| N | Slope | ±
 m m |
N | Slope | ±
m |
N | Slope | ±
m |
N | Slope | ±
m |
N | Slope | ±
m |
N | Slope | ±
m |
||||
| All E and S0 Papers I and II | 33 | 0.00 | 0.02 | 16 | -0.04 | 0.02 | 32 | -0.13 | 0.03 | 32 | -0.11 | 0.05 | 37 | -0.08 | 0.04 | 37 | -0.04 | 0.03 | |||
| S0/a, Sa, Sab | 8 | 0.015 | 0.02 | 6 | 0.015 | 0.02 | 8 | -0.16 | 0.06 | 8 | -0.16 | 0.05 | 12 | 0.02 | 0.02 | 12 | -0.02 | 0.03 | |||
| Sb | 6 | -0.01 | 0.02 | 6 | 0.03 | 0.01 | 12 | -0.32 | 0.09 | 13 | -0.13 | 0.03 | 14 | -0.01 | 0.01 | 14 | -0.02 | 0.02 | |||
| Sbc | 6 | -0.02 | 0.02 | 6 | 0.00 | 0.02 | 11 | -0.36 | 0.13 | 11 | -0.22 | 0.07 | 14 | 0.00 | 0.03 | 14 | -0.01 | 0.02 | |||
| Sc, Scd, Sd | 3 | 0.02 | 0.06 | 3 | -0.05 | 0.03 | 7 | -0.26 | 0.20 | 7 | -0.42 | 0.20 | 12 | -0.03 | 0.04 | 12 | 0.01 | 0.04 | |||
| Im | - | - | - | - | - | - | 2 | 0.43 | 0.33 | 2 | 0.24 | 0.06 | 2 | 0.12 | 0.12 | 2 | -0.18 | 0.04 | |||
| I0 | 1 | -0.05 | - | 1 | -0.03 | - | 2 | -0.47 | 0.06 | 2 | -0.20 | 0.04 | 2 | 0.08 | 0.08 | 2 | -0.04 | 0.03 | |||
| All but 2 µm excess | 24 | 0.00 | 0.01 | 22 | 0.00 | 0.01 | - | - | - | - | - | - | - | - | - | - | - | - | |||
| 2.2 µm excess | 6 | 0.04 | 0.02 | 5 | -0.08 | 0.03 | 3 | -0.75 | 0.33 | 4 | -0.87 | 0.30 | 9 | -0.19 | 0.04 | 9 | -0.24 | 0.02 | |||
| Blue† | - | - | - | - | - | - | 7 | 0.38 | 0.08 | 7 | -0.09 | 0.07 | 7 | 0.03 | 0.05 | 7 | -0.06 | 0.04 | |||
*
The least-squares slope
|
|||||||||||||||||||||
†
This bin includes all galaxies for which
|
|||||||||||||||||||||
The U - V and V - K color gradients for early type spirals are similar to those of E and S0 galaxies found in Paper I, as is the lack of significant radial gradients in either the CO or H2O indices. On the other hand, no significant radial gradients are bound in spirals for either the J - H or H - K color, a result that is perhaps in contra-distinction with the case for the early-type Paper I galaxies. However, since the typical range in log A / D0 for a particular galaxy is only about 0.4, a systematic error of just 0.03 mag need exist between the J magnitudes, for instance, of Paper I and in this paper, to produce a 0.07 mag discrepancy per unit log A / D0 in color. Given the instrumental problems associated with measuring J (e.g., Section IId this paper, Section IIc in Paper I), such a systematic error cannot be ruled out.
We note that the results in Table 7 are not field lens dependent. In particular, for types S0/a to Sd the J - H color gradient determined using just multiaperture data obtained with the f/9.6 and f/13 field lenses yields a slope of 0.00 ± 0.02 (for N = 29), while the same quantity for the f/7.5 field lens is 0.01 ± 0.02 (for N = 23).
Cursory examination of Figures 3 - 9 reveals considerable dispersion in the visual correlation in aperture changes between U - V and V - K; in many cases the colors anti-correlate. In the last line of Table 7 we have grouped together all galaxies with a "blue" U - V color gradient (i.e., bluer U - V colors at smaller aperture sizes) greater than 0.10 mag per unit log A / D0. The mean V - K color gradient of this group, although small, is still in the opposite sense. Interpretation of this point, and of the general relation between U - V and V - K, is postponed to Section IV.
6 The observations for NGC 520, 2976, and 3556 have been excluded from this discussion (cf. Section IIc). Back.
To study general galaxian properties, we assign to
every galaxy a representative value of each color. For the
CO and H2O indices, a weighted average of all aperture
measurements was formed, since in all but the 2.2 µm excess
objects the measuring error is at least as large as the
allowable radial variation. For the broad-band colors, the
data has been referenced to a fiducial value of
log A / D0
equal to -0.6 because 1) this value involves minimal extrapolation of
the measurements, and 2) the galaxies in Paper I
which were assigned integrated colors at
log A / D(0) = - 0.3
can be compared directly to those in the present study, since
for early type galaxies
D0  D(Q) + 0.3 (RC2).
For galaxies with multiaperture measurements straddling log A / D) = - 0.6, we have interpolated the data to -0.5. For the remaining galaxies, we have adopted the colors at the projected aperture size closest to -0.6. The final integrated colors are presented in Table 8, binned by morphological type. Note that the value of log A / D0 listed in column 2 refers to the U - V and V - K colors only. In a few cases a value for U - V is listed in Table 8 where no values were given in Table 5. For these instances the scatter in published U - V was deemed too great for reliable determination of a color gradient, but did allow assignment of an integrated value.
| Name | Log A/D0* | (U-V)c | (V-K)c | (J-H)c | (H-K)c | COc | H2Oc | Yerkes Class |
| S0, S0+ : | ||||||||
| NGC 936 | -0.5 | 1.58 | 3.27 | 0.73 | 0.20 | - | - | k |
| NGC 2217 | -0.8 | 1.60 | 3.24 | 0.74 | 0.19 | - | - | - |
| NGC 3245 | -0.7 | 1.51 | 3.18 | 0.73 | 0.22 | 0.15 | 0.12 | gk |
| NGC 4425 | -0.7 | 1.35 | 2.95 | 0.75 | 0.17 | - | - | - |
| NGC 4429 | -0.7 | 1.50 | 3.39 | 0.77 | 0.24 | - | - | k |
| NGC 4477 | -0.6 | 1.58 | 3.23 | 0.74 | 0.16 | - | - | k |
| NGC 4526 | -0.8 | 1.51 | 3.38 | 0.77 | 0.24 | - | - | k |
| NGC 7332 | -0.7 | 1.28 | 3.04 | 0.71 | 0.08 | 0.17 | - | k? |
| NGC 7465 | -0.4 | 0.77 | 3.14 | 0.13 | 0.26 | - | - | - |
| S0/a, Sa, Sab: | ||||||||
| NGC 1398 | -0.8 | 1.65 | 3.35 | 0.72 | 0.18 | 0.16 | 0.105 | k |
| NGC 1617 | -0.6 | 1.49 | 3.19 | 0.72 | 0.19 | - | - | - |
| NGC 2681 | -0.7 | 1.18 | 2.92 | 0.73 | 0 20 | 0.165 | 0.135 | fg |
| NGC 2775 | -0.4 | 1.32 | 3.30 | 0.72 | 0.21 | 0.14 | 0.13 | k |
| NGC 3031 | -1.1 | 1.64 | 3.34 | 0.74 | 0.22 | 0.15 | 0.12 | gk |
| NGC 3368 | -0.6 | 1.47 | 3.33 | 0.75 | 0.23 | 0.145 | 0.125 | gk |
| NGC 3623 | -1.1 | 1.65 | 3.28 | 0.72 | 0.19 | 0.15 | 0.10 | gk |
| NGC 4569 | -0.9 | 1.07 | 3.24 | 0.76 | 0.28 | - | - | f |
| NGC 4594 | -0.6 | 1.65 | 3.54 | 0.78 | 0.20 | 0.175 | 0.11 | k |
| NGC 4643 | -0.7 | 1.61 | 3.20 | 0.70 | 0.20 | 0.17 | 0.105 | k |
| NGC 4725 | - | - | - | 0.69 | 0.21 | 0.155 | 0.085 | gk |
| NGC 4736 | -0.8 | 1.01 | 3.19 | 0.72 | 0.21 | 0.175 | 0.11 | g |
| NGC 4826 | - | - | - | 0.82 | 0.29 | 0.145 | 0.14 | fg |
| Sb: | ||||||||
| NGC 224 | -2.0 | 1.62 | 3.25 | 0.76 | 0.22 | 0.16 | 0.11 | gk |
| NGC 278 | -0.6 | 0.33 | 2.78 | 0.71 | 0.21 | 0.115 | f | |
| NGC 772 | -0.7 | 1.08 | 3.40 | 0.74 | 0.21 | - | - | g |
| NGC 1964 | -0.6 | 1.06 | 3.10 | 0.73 | 0.23. | 0.14 | 0.095 | g |
| NGC 2683 | -0.6 | 1.35 | 3.51 | 0.80 | 0.23 | 0.135 | 0.125 | g |
| NGC 2841 | -0.6 | 1.42 | 3.16 | 0.72 | 0.20 | 0.145 | 0.12 | k |
| NGC 3351 | -1.0 | 1.02 | 3.34 | 0.75 | 0.24 | 0.14 | 0.13 | g |
| NGC 3627 | -1.1 | 1.32 | 3.31 | 0.73 | 0.24 | 0.16 | 0.13 | g |
| NGC 4501 | -0.9 | 1.57 | 3.51 | 0.74 | 0.23 | 0.175 | 0.13 | g |
| NGC 4565 | -0.8 | 1.59 | 3.97 | 0.85 | 0.26 | 0.14 | 0.12 | gk |
| NGC 4579 | -0.6 | 1.40 | 3.19 | 0.73 | 0.22 | 0.155 | 0.125 | k |
| NGC 4699 | -0.6 | 1.39 | 3.19 | 0.70 | 0.20 | 0.17 | 0.125 | k |
| NGC 5746 | -0.5 | 1.68 | 3.93 | 0.80 | 0.26 | - | - | gk |
| NGC 7177 | -0.6 | 1.16 | 3.15 | 0.73 | 0.22 | 0.13 | 0.10 | g |
| Sbc: | ||||||||
| NGC 151 | -0.6 | 1.30 | 3.21 | 0.74 | 0.19 | - | - | fg |
| NGC 157 | -0.4 | 0.69 | 2.99 | 0.71 | 0.23 | - | - | a |
| NGC 1300 | - | - | - | 0.69 | 0.20 | - | - | g |
| NGC 1566 | -0.9 | 0.91 | 3.04 | 0.74 | 0.20 | 0.135 | - | - |
| NGC 2339 | -0.3 | 0.77 | 3.02 | 0.79 | 0.27 | - | - | af? |
| NGC 2903 | -0.9 | 0.78 | 3.29 | 0.75 | 0.25 | 0.165 | 0.12 | f |
| NGC 3521 | -0.7 | 1.19 | 3.51 | 0.82 | 0.24 | 0.145 | 0.125 | f |
| NGC 4258 | -1.3 | 1.11 | 3.23 | 0.72 | 0.24 | 0.12 | 0.125 | g |
| NGC 4303 | -0.7 | 0.89 | 3.08 | 0.68 | 0.24 | - | - | f |
| NGC 4321 | -1.0 | 0.67 | 3.11 | 0.70 | 0.24 | 0.20 | 0.12 | fg |
| NGC 5005 | -0.6 | 1.28 | 3.46 | 0.78 | 0.27 | 0.14 | 0.13 | gk |
| NGC 5055 | -0.8 | 1.05 | 3.47 | 0.80 | 0.23 | 0.14 | 0.11 | g |
| NGC 5194 | -0.8 | 0.82 | 3.14 | 0.77 | 0.23 | 0.18 | 0.12 | fg |
| NGC 6384 | -0.5 | 1.21 | 3.16 | 0.72 | 0:20 | - | - | gk |
| NGC 6744 | - | - | - | 0.68 | 0.15 | - | - | - |
| NGC 6814 | -0.6 | 1.16 | 3.48 | 0.75 | 0.27 | - | - | fg |
| NGC 7331 | -0.7 | 1.28 | 3.50 | 0.75 | 0.27 | 0.15 | 0.125 | gk |
| Sc, Scd, Sd: | ||||||||
| NGC 598 | -1.5 | 0. | 2.40 | 0.64 | 0.20 | 0.12 | - | f |
| NGC 628 | - | - | - | 0.72 | 0.19 | - | - | fg |
| NGC 1084 | -0.6 | 0.64 | 3.20 | 0.73 | 0.24 | 0.115 | 0.095 | a? |
| NGC 1232 | -0.8 | 1.25 | 3.08 | 0.70 | 0.15 | - | - | f |
| NGC 1637 | -0.6 | 0.94 | 3.09 | 0.74 | 0.22 | - | - | f |
| NGC 1961 | -0.5 | 1.17 | 3.50 | 0.80 | 0.26 | - | - | f |
| NGC 2403 | - | - | - | 0.69 | 0.11 | - | - | f |
| NGC 2976 | - | - | - | 0.71 | 0.14 | - | - | a |
| NGC 2997 | -0.8 | 1.00 | 3.16 | 0.73 | 0.23 | - | - | f |
| NGC 3621 | - | - | - | 0.73 | 0.23 | - | - | a |
| NGC 4490 | - | - | - | 0.64 | 0.21 | 0.08 | 0.075 | a |
| NGC 5236 | -1.0 | 0.54 | 3.27 | 0.74 | 0.28 | 0.15 | 0.145 | fg |
| NGC 5457 | -1.2 | 0.98 | 2.98 | 0.78 | 0.18 | - | - | f |
| NGC 6015 | -0.4 | 0.61 | 2.89 | 0.70 | 0.17 | - | - | af |
| NGC 6503 | -0.6 | 0.80 | 3.03 | 0.74 | 0.18 | 0.14 | 0.11 | g? |
| NGC 6643 | -0.6 | 0.75 | 3.01 | 0.78 | 0.23 | - | - | af |
| NGC 7316 | -0.3 | 0.22 | 2.70 | 0.67 | 0.20 | - | - | - |
| NGC 7620 | -0.4 | 0.45 | 2.82 | 0.84 | 0.19 | - | - | - |
| Im: | ||||||||
| NGC 4214 | -1.0 | -0.01 | 2.19 | 0.57 | 0.17 | - | - | a |
| NGC 4449 | -0.8 | 0.00 | 2.31 | 0.64 | 0.21 | 0.105 | 0.115 | a |
| NGC 5253 | -0.6 | -0.15 | 2.16 | 0.58 | 0.32 | - | - | - |
| I0: | ||||||||
| NGC 3077 | -0.8 | 0.44 | 2.75 | 0.67 | 0.22 | - | - | - |
| NGC 4753 | -0.6 | 1.60 | 3.48 | 0.77 | 0.24 | 0.145 | 0.165 | g |
| NGC 5195 | -0.6 | 1.55 | 3.63 | 0.79 | 0.25 | 0.135 | 0.115 | f? |
| 2.2 - µm Excess: | ||||||||
| NGC 253 | -1.0 | 1.55 | 4.43 | 0.94 | 0.41 | 0.14 | 0.165 | af |
| NGC 891 | - | - | - | 0.97 | 0.41 | 0.07 | 0.14 | g? |
| NGC 1068 | -0.6 | 0.83 | 3.48 | 0.77 | 0.41 | 0.03 | 0.215 | g |
| NGC 1365 | -1.0 | 0.83 | 3.67 | 0.80 | 0.36 | 0.07 | - | fg |
| NGC 2146 | -0.5 | 1.02 | 4.06 | 0.92 | 0.43 | 0.105 | 0.17 | k? |
| NGC 3034 | - | - | - | 0.95 | 0.44 | 0.135 | 0.225 | - |
| NGC 3079 | - | - | - | 1.00 | 0.47 | - | - | fg |
| NGC 3628 | -0.8 | 1.41 | 4.22 | 1.02 | 0.37 | 0.11 | 0.17 | g? |
| NGC 4631 | - | - | - | 0.96 | 0.43 | 0.09 | 0.165 | af |
| NGC 5128 | -1.3 | 1.82 | 5.50 | 1.09 | 0.45 | 0.085 | 0.175 | - |
| NGC 5907 | -0.9 | 1.38 | 4.08 | 0.92 | 0.39 | 0.10 | 0.155 | g? |
| NGC 6946 | -0.8 | 1.11 | 3.93 | 0.92 | 0.32 | 0.155 | 0.135 | af |
| * Refers to U-V and V-K colors only. | ||||||||
In Figures 10 - 13, the colors from Table 8 of this study, from Table of Paper I, and from Table 3 of Paper II 7 are shown as a function of morphological type. To assist interpretation of these figures the mean colors as a function of type are presented in Table 9.
 |
Figure 10. The U - V colors from Table 4 of Paper I and from Table 8 of this paper are shown as a function of morphological type. Note that the points for the two 2.2 µm excess Sb galaxies, NGC 1068 and 1365, overlap at U - V = 0.83. |
 |
Figure 11. The V - K colors from Table 4 of Paper I and Table 8 of this paper are shown as a function of morphological type. The point for NGC 5128 lies off the plot, and for this reason the point was also excluded from Figure 10. |
 |
Figure 12. The J - H and H - K colors from Table 4 of Paper I and from Table 8 of this paper are shown as a function of morphological type. |
 |
Figure 13. The H2O indices from Table 3 of Paper II and Table 8 of this paper are shown as a function of morphological type. b) The CO indices from Table 4 of Paper I and from Table 8 of this paper are shown as a function of morphological type. |
In computing the mean E and S0 colors, the color-luminosity effects found in Paper I were explicitly ignored, except that data for the very blue dwarf galaxies NGC 205 and 404 were excluded. For the five spiral bins we have considered two samples of the U - V and V - K color data. First there is the "full" sample, which includes the observations for all galaxies. However, this sample is biased by both color-aperture and inclination effects (Table 7 and Section IIIc). We have thus formed a "restricted" sample, which includes only those galaxies with integrated values at log A / D0 > - 0.9, and values of csc(i) < 5, where i is the inclination angle (Section IIIc). The latter constraint excludes only two galaxies, NGC 4565 and 5746, both from the Sb bin. The mean U - V and V - K colors for the restricted (full) sample are given in the upper (lower) entries in Table 9.
| N | (U-V)c |
m |
N | (V-K)c |
m |
N | (J-H)c |
m |
N | (H-K)c |
m |
N | COc |
m |
N | H2Oc |
m |
|
| E, Papers I and II | 34 | 1.51 | 0.02 | 34 | 3.29 | 0.02 | 37 | 0.74 | 0.01 | 37 | 0.18 | 0.01 | 37 | 0.155 | 0.01 | 27 | 0.115 | 0.01 |
| S0, Papers I and II | 11 | 1.49 | 0.02 | 11 | 3.28 | 0.05 | 12 | 0.74 | 0.01 | 12 | 0.19 | 0.01 | 12 | 0.155 | 0.01 | 10 | 0.12 | 0.01 |
| S0, this paper | 9 | 1.41 | 0.09 | 9 | 3.20 | 0.05 | 8 | 0.75 | 0.01 | 8 | 0.21 | 0.01 | 2 | 0.16 | 0.01 | 1 | 0.12 | - |
| S0/a, Sa, Sab* | 9 | 1.38 | 0.08 | 9 | 3.25 | 0.06 | 13 | 0.74 | 0.01 | 13 | 0.22 | 0.01 | 11 | 0.155 | 0.01 | 11 | 0.115 | 0.01 |
| 11 | 1.43 | 0.08 | 11 | 3.26 | 0.05 | |||||||||||||
| Sb* | 9 | 1.20 | 0.12 | 9 | 3.22 | 0.08 | 14 | 0.75 | 0.01 | 14 | 0.22 | 0.01 | 12 | 0.145 | 0.01 | 11 | 0.12 | 0.01 |
| 14 | 1.29 | 0.09 | 14 | 3.34 | 0.08 | |||||||||||||
| Sbc* | 13 | 1.03 | 0.06 | 13 | 3.26 | 0.06 | 17 | 0.74 | 0.01 | 17 | 0.23 | 0.01 | 9 | 0.155 | 0.01 | 8 | 0.12 | 0.01 |
| 15 | 1.01 | 0.06 | 15 | 3.25 | 0.05 | |||||||||||||
| Sc* | 7 | 0.85 | 0.13 | 7 | 3.11 | 0.09 | 10 | 0.73 | 0.01 | 10 | 0.21 | 0.01 | 2 | 0.13 | 0.02 | 2 | 0.12 | 0.02 |
| 8 | 0.81 | 0.12 | 8 | 3.13 | 0.08 | |||||||||||||
| Scd, Sd* | 3 | 0.62 | 0.10 | 3 | 2.91 | 0.06 | 8 | 0.72 | 0.03 | 8 | 0.18 | 0.01 | 3 | 0.11 | 0.02 | 2 | 0.09 | 0.02 |
| 5 | 0.66 | 0.10 | 5 | 2.82 | 0.11 | |||||||||||||
| Im | 3 | -0.05 | 0.05 | 3 | 2.22 | 0.05 | 3 | 0.60 | 0.02 | 3 | 0.23 | 0.05 | 1 | 0.105 | - | 1 | 0.115 | - |
| I0 | 3 | 1.20 | 0.38 | 3 | 3.29 | 0.27 | 3 | 0.74 | 0.03 | 3 | 0.24 | 0.01 | 2 | 0.14 | 0.01 | 2 | 0.14 | 0.02 |
| 2.2 µm excess | 8 | 1.24 | 0.13 | 8 | 4.17 | 0.22 | 12 | 0.94 | 0.03 | 12 | 0.41 | 0.01 | 11 | 0.10 | 0.01 | 10 | 0.17 | 0.01 |
* Upper U-V and V-K entries are for the restricted sample, and lower entries are for the full sample. See text for details. |
||||||||||||||||||
Several results are apparent from Figures 10 - 13 and Table 9. First, the well-known U - V color-morphological type relation (de Vaucouleurs 1961; de Vaucouleurs and de Vaucouleurs 1972) is readily visible in Figure 10 and from column 2 of Table 9. Note, however, that considerable dispersion exists in the U - V color at a given morphological type. Second, excluding the 2.2 µm excess objects, the mean V - K color of spiral galaxies is the same as for ellipticals through types Sbc, where it then becomes increasingly bluer for types Sc to Im. The mean V - K color of the I0, galaxies is consistent with the interpretation from optical data alone that this class is more similar to disturbed, dusty, early-type galaxies than to type Im. While previous authors (e.g., Grasdalen 1975; Pacholczyk and Tarenghi 1975) have commented on the large scatter in V - K color for spiral galaxies, we note that for the restricted sample the scatter in V - K color at a given type is comparable with the nominal error. In particular, even for the full sample, at a given morphological type the dispersion in V - K color is comparable with the dispersion in U - V color.
Turning to Figures 12 and 13, we see that the mean J - H color as a function of morphological type is essentially constant, becoming significantly blue only for types Im. The mean H - K color is also mostly independent of morphological type, although middle spirals tend to have redder H - K colors than other types. The mean CO index remains constant with morphology through type Sbc, where it then appears to decrease, the mean CO index being only 0.118 ± 0.010 for six galaxies of type Sc or later, compared to a mean of 0.153 ± 0.008 for nine galaxies of type Sbc. On the other hand, the mean H2O index appears to be less dependent on morphology than the CO index - the mean H2O index for five galaxies of type Sc and later is 0.108 ± 0.012, compared to 0.122 ± 0.002 for eight Sbc galaxies. While the scatter at a given type in Figures 12 and 13 is generally comparable to the nominal errors, there are clearly some instances of real dispersion. Note particularly the broad band colors of the Magellanic irregular NGC 5253, which are extremely blue in all cases except H - K, whose value of 0.32 is quite red.
The agreement in mean UVK colors between the S0 sample in Paper I and in this paper (cf. Table 9) is reasonable given the peculiar way in which the latter sample is biased: Most of these galaxies were originally excluded from Paper I because they had been classified by Sandage (1976, private communication) as spirals. However, in the RC2 these same galaxies are classified as S0, and for consistency we have adopted them as such.
The mean infrared colors for the galaxies with a 2.2 µm excess are substantially reddened in all cases. (The dichotomy visible in Figure 12 between this sample and the other galaxies is even more striking when just nuclear colors alone are plotted.) On the other hand, the U - V colors of galaxies in this sample cannot be well characterized, and in relation to their types, four are very red (NGC 253, 5128, 5909, and 6946), three are blue (NGC 1068, 1365, and 2146), and one (NGC 3628) has atypical color (cf. Figure 10).
The mean colors from Table 8 are presented as a function of Yerkes class in Table 10. The Yerkes form classification system (Morgan and Mayall 1957; Morgan 1958, 1959, 1962), which is based primarily on the degree of central concentration of the galaxian light, has been shown by Morgan to correlate closely with the mean spectroscopic stellar population. As Table 8 shows, the correlation Between the Yerkes and Hubble systems is not perfect. However, a comparison between Tables 9 and 10 indicates that the correlation between the infrared colors and either system is comparable.
| Class | N | (U-V)c |
m |
N | (V-K)c |
m |
N | (J-H)c |
m |
N | (H-K)c |
m |
N | COc |
m |
N | H2Oc |
m |
| k | 12 | 1.49 | 0.04 | 12 | 3.27 | 0.04 | 11 | 0.73 | 0.01 | 11 | 0.20 | 0.01 | 8 | 0.16 | 0.01 | 7 | 0.115 | 0.01 |
| gk | 5 | 1.35 | 0.06 | 5 | 3.33 | 0.07 | 11 | 0.75 | 0.01 | 11 | 0.23 | 0.01 | 9 | 0.15 | 0.01 | 9 | 0.115 | 0.01 |
| 10 | 1.49 | 0.06 | 10 | 3.44 | 0.09 | |||||||||||||
| g | 9 | 1.19 | 0.09 | 9 | 3.32 | 0.07 | 13 | 0.74 | 0.01 | 13 | 0.22 | 0.01 | 11 | 0.145 | 0.01 | 11 | 0.12. | 0.01 |
| 12 | 1.18 | 0.07 | 12 | 3.31 | 0.05 | |||||||||||||
| fg | 4 | 1.11 | 0.10 | 4 | 3.19 | 0.11 | 8 | 0.75 | 0.01 | 8 | 0.24 | 0.01 | 5 | 0.165 | 0.01 | 5 | 0.13 | 0.01 |
| 6 | 0.95 | 0.13 | 6 | 3.19 | 0.08 | |||||||||||||
| f | 10 | 1.02 | 0.10 | 10 | 3.24 | 0.08 | 13 | 0.74 | 0.02 | 13 | 0.22 | 0.01 | 5 | 0.135 | 0.01 | 3 | 0.12 | 0.00 |
| 12 | 0.93 | 0.12 | 12 | 3.14 | 0.10 | |||||||||||||
| af | 3 | 0.71 | 0.05 | 3 | 2.97 | 0.04 | 3 | 0.76 | 0.03 | 3 | 0.22 | 0.03 | - | - | - | - | - | - |
| a | 4 | 0.33 | 0.19 | 4 | 2.67 | 0.25 | 7 | 0.68 | 0.02 | 7 | 0.20 | 0.01 | 3 | 0.100 | 0.01 | 3 | 0.095 | 0.01 |
* The mean colors given are based on the data in Table 8, excluding the 2.2 µm excess sample. For bins gk - f, upper (lower) U-V and V-K entries are for the restricted (full) sample. |
||||||||||||||||||
Morgan and Osterbrock (1969) have spectroscopically characterized galaxian stellar populations by three general categories: the amorphous population (spectral type near K ), present in ellipticals and the central bulges of early-type spirals; the intermediate population (spectral type near F). present in middle spirals and showing the largest degree of compositeness; and the Orion population (spectral type near B), present in irregulars rich in H II regions and blue giants. Furthermore, as with the Yerkes form system, the population does not correlate perfectly with Hubble morphology. For example, the mean spectral type for the two Sa galaxies NGC 2681 and 4594 are F5 and K0, respectively. The large scatter in U - V color at a.given morphological type commented on above would seem to partially reflect such population differences. However, Figures 12 and 13 and Tables 9 and 10 clearly indicate that all galaxies whose central regions are dominated optically by a population ranging from amorphous to intermediate have similar stellar compositions in the infrared.
7 A weighted mean of the H2O indices for each galaxy in Table 3 of Paper II was adopted. Back.
c) Color-Inclination Relations
Knowledge of internal absorption in galaxies is important for proper interpretation of color-aperture effects (Section IIIa), color-luminosity relations (Section IIId), stellar synthesis models (Section VI), and in determinations of the Hubble constant H0 which use spiral galaxies as calibrators (Sandage and Tammann 1974; Tully and Fisher 1977). Previous investigators (Holmberg 1958, 1969; Heidmann, Heidmann, and de Vaucouleurs 1971a, b) have attempted to calibrate intrinsic reddening with inclination angle, but the usefulness of these results has been questioned recently (Sandage and Tammann 1974; Tully 1972).
The ratio E(V - K) / E(B - V) = 2.8 given by the Van de Hulst reddening curve (Johnson 1968) implies that infrared photometry should be a very useful technique for investigating the behavior of color with inclination. We caution that although the data in the present sample are both limited and severely biased by aperture effects, a preliminary investigation of this question seems worthwhile.
Following Holmberg (1958), least square solutions were fit to color residuals as a function of two quantities, csc(i) - 1 and 1 - b / a, where i is the inclination angle and a / b is the major to minor axis ratio. csc(i) = a / b was adopted, as for an infinitely thin disk, and the values of a / b given in the RC1 were used, which are partially corrected for projection effects (cf. Sandage and Tammann 1974). Note that in our-notation, i = 90° for a face-on galaxy, and i = 0° for an edge-on galaxy. Color excess residuals were formed for six morphological bins - E; S0; S0/a, Sa, Sb; Sb; Sbc; and Sc - using the data from Table 4 of Paper I and Table 8 of this paper. For each galaxy, U - V, V - K, and V - H color residuals were calculated by subtracting the mean colors for the particular morphological type, as given in Table 9 for the restricted sample, from the observed colors. Six galaxies (NGC 253, 1068, 1365, 2146, 3628, and 5907) with 2.2 µm excesses, and having V - K colors, were now included in the spiral bins. V - H was also solved for in addition to V - K because as is shown in Section V, the 2.2 µm light from some galaxies is probably affected by non-stellar emission. Finally, in the solutions for early-type galaxies data for the dwarfs NGC 205 and 404, and the Markarian galaxy NGC 7465, were excluded, as the very blue colors of these objects are clearly unrelated to inclination effects.
The results are presented in Figures 14 and
15, and
in Table 11. In computing the quoted errors of
the least-squares slopes, the error in the inclination parameter was
adjusted to give a reduced chi-squared value of 1. The
solutions for 1 - b / a can be compared directly with the
calculations of
Holmberg (1958).
The "predicted Holmberg
solutions" were found by first taking a weighted mean from
Holmberg's Table 4, where values of the color-inclination
slope are given for the color index C. I. on the international
system. Adopting C. I.
B - V,
the Van de Hulst reddening curve
(Johnson 1968)
was then used to obtain the values given in
Table 11.
 |
Figure 14. The U - V and V - K color residuals for the elliptical and lenticular galaxies from Table 4 of Paper I and from Table 8 of this paper are plotted against two inclination angle parameters: csc(i) - 1 and 1 - b / a. Also shown are the least squares fits to the data. The residuals for NGC 205, 404, and 7645, although plotted in the figure, has been excluded from the least square solutions. See text for further details. |
 |
Figure 15. Same as Figure 22, for the spiral galaxy sample in Table 8. |
The results in Table 11 show that a significant correlation exists between all colors and inclination angle in spiral galaxies, while only a marginal result is present for the E and S0 galaxies. The negative solutions for the E and S0's (i.e., bluer colors with smaller i) are apparently due to a slight dependence of inclination on absolute magnitude in the sample.
 U - V U - V |
V - K |
V - H |
|||||||
| N | Slope | R | Slope | R | Slope | R | (Slope)V-K / (Slope)U-V | (Slope)V-K / (Slope)V-H | |
| Solutions with csc(i) - 1 | |||||||||
| E-S0 | 53 | -0.03 ± 0.02 | 0.18 | -0.05 ± 0.03 | 0.25 | -0.04 ± 0.03 | 0.23 | 1.7 | 1.2 |
| Sa-Sc | 54 | 0.10 ± 0.03 | 0.52 | 0.16 ± 0.02 | 0.69 | 0.14 ± 0.02 | 0.71 | 1.6 | 1.1 |
| Sa-Sc, i > 17.°5 only | 47 | 0.20 ± 0.07 | 0.39 | 0.125 ± 0.06 | 0.30 | 0.12 ± 0.05 | 0.34 | 0.6 | 1.0 |
| Solutions with 1 - b/a | |||||||||
| E-S0 | 53 | -0.12 ± 0.07 | 0.22 | -0.19 ± 0.09 | 0.29 | -0.18 ± 0.08 | 0.29 | 1.6 | 1.1 |
| Sa-Sc | 54 | 0.75 ± 0.16 | 0.56 | 0.95 ± 0.17 | 0.62 | 0.87 ± 0.14 | 0.65 | 1.3 | 1.1 |
| Sa-Sc, Predicted Holmberg | 155 | 0.24 | - | 0.39 | - | 0.36 | - | - | - |
| Sa-Sc, i > 17.°5 only | 47 | 0.62 ± 0.21 | 0.39 | 0.45 ± 0.17 | 0.36 | 0.44 ± 0.15 | 0.41 | 0.7 | 1.0 |
*
The least-squares slope
|
|||||||||
The ratios in the last two columns of Table 11 are
consistent, within the statistics, with the values expected
from the Van de Hulst curve, which are 1.6 for
U - V / V - K,
and 1.1 for V - K / V - H. However, our
results are 2 to 3 times larger than the predicted Holmberg solutions. We
interpret this difference as due at least partly to an
aperture effect: The Holmberg data are corrected to a value
of log A / D0
0.2, while our own data
are mostly at log A / D0
- 0.6. Because highly
reddened galaxies tend to have
strong color gradients (Section IIIa),
the size of the color-inclination
effect is expected to be inversely correlated
to the diameter of the projected aperture.
Holmberg (1958) found that the size of the color-inclination effect decreased in going from early to late type spirals. To check this, we have calculated least square solutions for the individual galaxy bins separately. Unfortunately, owing to the small and differing number of highly inclined objects in each bin, the answers were somewhat ambiguous, and Holmberg's result could not be reproduced.
Figures 14 and 15 also illustrate a point discussed in Section IIIb, namely, that galaxies with a significant 2.2 µm excess - as measured by their JHK colors - are not necessarily distinguished by their UVK colors. On the other hand, the two highly inclined spirals NGC 4565 and 5746, which have fairly normal JHK colors and only slightly reddened U - V colors, have V - K,excesses comparable to the galaxies with 2.2 µm excesses. We shall come back to this point in Section V.
If the spirals are excluded for which 1 - b / a > 0.7, or i < 17.5° , the significance of the color-inclination effect decreases in all cases. The data are in fact consistent with an interpretation in which the effect is important only for highly inclined galaxies, a conclusion consistent with the results of Holmberg (1958, 1969). We thus consider it inappropriate to attempt any correction of the colors for inclination.
d) Color-Absolute Magnitude Relations
In Figure 16 we have plotted various colors of spiral galaxies against absolute magnitude MV. The latter was determined as in Paper I: Values of V at A / D(0) = 1 were obtained from the RC1, redshifts corrected for motion relative to the Local Group of galaxies were taken from the RC2, and a value of H0 = 50 km/sec/Mpc was assumed. For galaxies in small groups (de Vaucouleurs 1975), the mean redshift of the group was used, but all galaxies in the Virgo cluster were assigned the same redshift, and the distance moduli for local group galaxies (NGC 224, 598) were obtained from van den Bergh (1975).
 |
Figure 16. Various colors for the sample of spiral galaxies in Table 8 are shown as a function of absolute magnitude. |
In Table 12 we have compared least square solutions of the various colors with absolute magnitude for both ellipticals and spirals. The E - S0 group includes the data from Papers I and II and the S0's from this paper. For the S0/a - Sd group, the full sample is used for the CO and H2O solutions, while the restricted sample is used for the broad-band color solutions. Since the upper limit of MV for types Im is about -20 (van den Bergh 1977), to avoid introducing a false correlation these types were excluded from the solutions.
| All E and S0 | S0/a-Sd ** | |
(- 23.5
 MV
-13.5)
† MV
-13.5)
† |
(- 23.5
MV
- 18.5) |
|
| N | 56 | 41 |
| bU-V | -0.06(± 0.02) | -0.03(± 0.05) |
| R | 0.62 | 0.08 |
| N | 56 | 41 |
| bV-K | -0.07(± 0.02) | -0.02(± 0.03) |
| R | 0.62 | 0.12 |
| N | 50 | 37 |
| bCO | -0.0.06(± 0.015) | -0.009(± 0.035) |
| R | 0.59 | 0.40 |
| N | 36 | 34 |
| bH2O | -0.0.06(± 0.029) | 0.002(± 0.041) |
| R | 0.46 | 0.11 |
* Least-squares solutions bcolor are given for the relation (color) = bcolor × MV + constant. R is the correlation coefficient. |
||
| † For H2O only,
-23.5
MV
18. |
||
| ** Full sample for CO and H2O, restricted sample for U-V and V-K. | ||
In Paper I a correlation for early-type galaxies between V - K and MV was found comparable to the well-known correlation between U - V and MV (de Vaucouleurs 1961; de Vaucouleurs and de Vaucouleurs 1972; Sandage 1972). For spirals, we find no significant correlation with MV in either color (Table 12). Solutions were also found for three subsets of the spiral sample - S0/a, Sa, Sab, Sb, Sbc; and Sc, Scd, Sd - but again no significant correlations were discovered. These results are consistent with the lack of correlation between optical colors and luminosity found by de Vaucouleurs and de Vaucouleurs (1972) for a much larger sample of spirals. Finally, no significant correlation between the CO and H2O indices and luminosity is found for either spirals or ellipticals, a result perhaps expected in view of the severe restriction of the samples at the faint end.
i) CO and H2O Indices
The CO and H2O indices for the spiral galaxy sample in Table 8 are plotted against U - V color in Figure 17, against V - K color in Figure 18, and against J - H and H - K colors in Figure 19. In Figure 20 we show the H2O index plotted against the CO index. The mean stellar color relations in these figures are adopted from Paper I, and transformed to the HCO system (Section IIg and Appendix A).
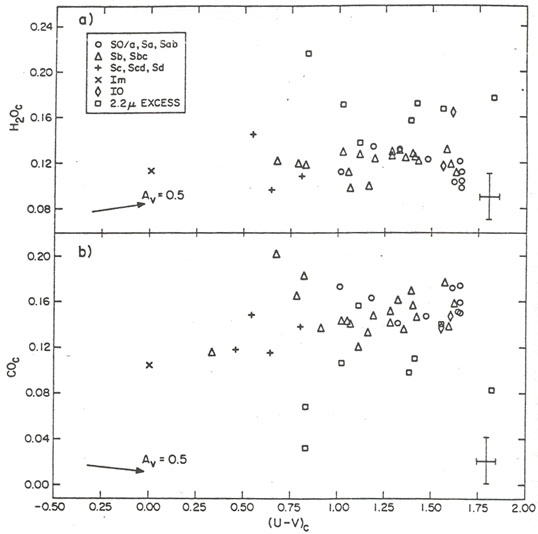 |
Figure 17. The H2O and CO indices are plotted against U - V for the spiral galaxy data in Table 8. |
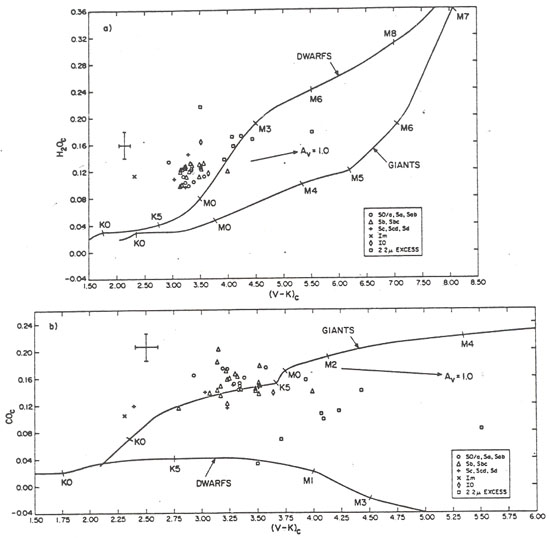 |
Figure 18. The H2O and CO indices are plotted against V - K for the spiral galaxy data in Table 8. Also shown are the mean color relations for dwarf and giant stars. |
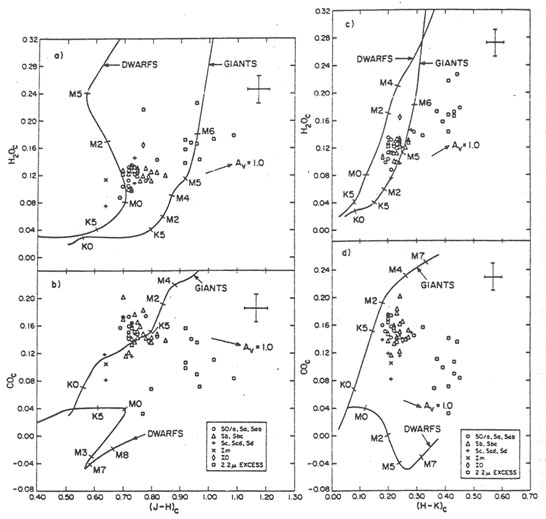 |
Figure 19. The H2O and CO indices are plotted against the J - H and H - K colors for the spiral galaxy data in Table 8. Also shown are the mean color relations for dwarf and giant stars. |
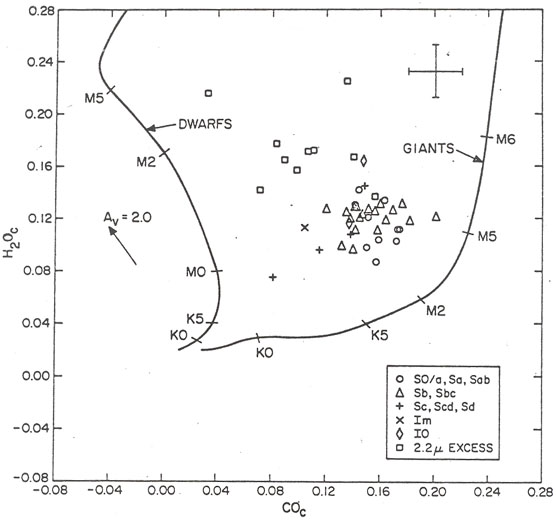 |
Figure 20. The H2O index is plotted against the CO index for the spiral galaxies in Table 8. Also shown are the mean color relations for dwarf and giant stars. |
As expected from the similarity of mean colors between spirals and ellipticals, the appearance of these plots is generally the same as in similar plots for early type galaxies presented in Papers I and II: First, the CO indices of the sample indicate that the 2 µm light is dominated by giant stars. Second, the H2O indices show that at 2 µm a significant number of these giants are late M in spectral type. Third, Figures 17 - 20 illustrate the composite nature of the galaxian flux, in that the mean giant colors of V - K, J - H, CO, H - K, and H2O correspond to spectral types K4, K4, K6, M3, and M5. Thus, as the observational baseline shifts redward, so does the dominating stellar component. This effect, discussed also by Stebbins and Whitford (1948), explains the general displacement of the points in the figures from the mean giant star relations. For two colors dominated by a similar mean stellar component, this displacement will be small (e.g., Figures 18b, 19b, c); for two colors dominated by different mean stellar components, the displacement will be large (e.g., Figures 18a, 19a, 20). Similarly, the CO and H2O indices in Figure 17, which are determined by the reddest stars, depend very weakly on the U - V color, which is determined by the bluest stars.
As expected from Table 9, there is little segregation with morphological type in these figures, and the scatter of points is generally comparable with the measuring errors, except for 1) the 2.2 µm excess objects, which are well separated from the other galaxies in roughly the direction of the reddening line, and 2) the small number of late-type galaxies with bluer colors and smaller narrow-band indices.
ii) The JHK Plane
In Figure 21 we have plotted the J - H color against H - K. The JHK colors alone provide little information on the giant-to-dwarf ratio. However, since the strength of the CO absorption requires a giant dominated spectrum, the displacement of points from the mean giant line can again be understood as being due to the composite nature of the giant branch. We again see as before the separation of the 2.2 µm excess objects in the figure. There is also a large scatter in the remaining points, due partly to residual reddening, and partly to the blue colors of late-type galaxies.
 |
Figure 21. The J - H color is plotted against H - K for the spiral galaxies in Table 8. Also shown are the mean color relations for dwarf and giant stars. |
iii) The UVK Plane
In Figure 22 the U - V color is plotted against V - K for all galaxies in Table 4 of Paper I and in Table 8 of this paper, and for the globular clusters in Table 2 of Paper I. There are two significant results apparent from this figure. First, as we advance in morphological type, the galaxies fall along a generally well-defined and continuous sequence. Second, this morphological sequence is well separated from the sequence defined by the dwarf ellipticals and globular clusters. The second result cannot be due to just an internal reddening effect, since as Figure 22 shows, the reddening line is essentially parallel to the elliptical galaxy sequence.
 |
Figure 22. The U - V color is plotted against V - K for all galaxies in Table 4 of Paper I and Table 8 of this paper, and for the globular clusters in Table 3 of Paper I. The point for NGC 5128 lies off the plot. |