Copyright © 2010 by Annual Reviews. All rights reserved
| Annu. Rev. Astron. Astrophys. 2010. 48:
673-710 Copyright © 2010 by Annual Reviews. All rights reserved |


In making measurements of extragalactic distances, objects are being observed at a time when the scale factor of the Universe, a, was smaller, and the age of the Universe, t, was younger than at present. Measuring the cosmic expansion generally involves use of one of two types of cosmological distances: the luminosity distance,
 |
(4) |
which relates the observed flux (integrated over all frequencies), F , of an object to its intrinsic luminosity, L, emitted in its rest frame; and the angular diameter distance,
 |
(5) |
which relates the apparent angular size of an object in radians,
 , to its proper size,
D. The luminosity and angular diameter distances are related by:
, to its proper size,
D. The luminosity and angular diameter distances are related by:
 |
(6) |
The distance modulus, µ, is related to the luminosity distance as follows:
 |
(7) |
where m and M are the apparent and absolute magnitudes of the objects, respectively, and dL is in units of parsecs.
The requirements for measuring an accurate value of Ho are simple to list in principle, but are extremely difficult to meet in practice. The measurement of radial velocities from the displacement of spectral lines is straightforward; the challenge is to measure accurate distances. Distance measurements must be obtained far enough away to probe the smooth Hubble expansion (i.e., where the random velocities induced by gravitational interactions with neighboring galaxies are small relative to the Hubble velocity), and nearby enough to calibrate the absolute, not simply the relative distance scale. The objects under study also need to be sufficiently abundant that their statistical uncertainties do not dominate the error budget. Ideally the method has a solid physical underpinning, and is established to have high internal accuracy, amenable to empirical tests for systematic errors.
We discuss in detail here three high-precision methods for measuring distances to nearby galaxies: Cepheids, the tip of the red giant branch (TRGB) method, and maser galaxies. For more distant galaxies, we will additionally discuss three methods in detail: the Tully-Fisher (TF) relation for spiral galaxies, the surface brightness fluctuation (SBF) method and the maximum luminosities of Type Ia supernovae (SNe Ia). Although maser distances have so far only been published for two galaxies (NGC 4258 and UGC 3789), this method has considerable potential, perhaps even at distances that probe the Hubble flow directly.
Over the preceding decades a large number of other "distance indicators" have been explored and applied with varying degrees of success, often over relatively restricted ranges of distance. Main sequence fitting, red giant "clump" stars, RR Lyrae stars, the level of the horizontal branch, Mira variables, novae and planetary nebula luminosity functions (PNLF), globular cluster luminosity functions (GCLF), as well as red and blue supergiant stars all fall into this class. Some, like the RR Lyrae stars, have provided crucial tests for consistency of zero points but cannot themselves reach very far beyond the Local Group because of their relatively faint intrinsic luminosities. The reader is referred to recent papers on the SN II distance scale (Dessart & Hiller 2005); PNLF (Ciardullo et al. 2002); and Fundamental Plane (FP; Blakeslee et al. 2002) and references therein.
Our goal here is not to provide an exhaustive review of all distance determination methods, but rather to focus on a few methods with demonstrably low dispersion, some currently understood physical basis, and with sufficient overlap with other methods to test quantitatively the accuracy of the calibration, and level of systematic errors for the determination of Ho. Before turning to a discussion of methods for measuring distances, we discuss the general issue of interstellar extinction.
3.0.1. INTERSTELLAR EXTINCTION Interstellar extinction will systematically decrease a star or galaxy's apparent luminosity. Thus, if extinction is not corrected for it will result in a derivation of distance that is systematically too large. Dust may be present along the line of sight either within our Milky Way galaxy and/or along the same extended line of sight within the galaxy under study.
Two main observational paths to correct for interstellar extinction have been pursued: (1) make observations in at least two wavelength bands and, using the fact that extinction is a known function of wavelength to solve explicitly for the distance and color-excess/extinction effects, or (2) observe at the longest wavelengths practical so as to minimize implicitly the extinction effects. The former assumes prior knowledge of the interstellar extinction law and carries the implicit assumption that the extinction law is universal. The latter path is conceptually more robust, given that it simply makes use of the (empirically-established) fact that extinction decreases with increasing wavelength. However, working at longer and longer wavelengths has been technically more challenging so this path has taken longer in coming to fruition.
From studies of Galactic O & B stars it is well-established that interstellar extinction is wavelength dependent, and from the optical to mid-infrared wavelengths it is a generally decreasing function of increasing wavelength (see Cardelli, Clayton & Mathis 1996; Draine 2003 and references therein for empirical and theoretical considerations). Limited studies of stars in external galaxies (primarily the LMC and SMC) support this view, with major departures being confined to the ultraviolet region of the spectrum (particularly near 2200 Å). Both for practical reasons (that is, detector sensitivity) and because of the nature of interstellar extinction, the majority of distance-scale applications have avoided the ultraviolet, so the most blatant changes in the interstellar extinction curve have been of little practical concern. At another extreme, the universality of the longer-wavelength (optical through infrared) portion of the extinction curve appears to break down in regions of intense star formation and extremely high optical depths within the Milky Way. However, the general (diffuse) interstellar extinction curve, as parameterized by ratios of total-to-selective absorption, such as RV = AV / E(B - V), appears to be much more stable from region to region. Fortunately Cepheids, TRGB stars, and supernovae are generally not found deeply embedded in very high optical-depth dust, but are sufficiently displaced from their original sites of star formation that they are dimmed mostly by the general, diffuse interstellar extinction.
Since the discovery of the Leavitt Law (Leavitt, 1908; Leavitt & Pickering 1912) and its use by Hubble to measure the distances to the Local Group galaxies, NGC 6822 (Hubble 1925), M33 (Hubble 1926) and M31 (Hubble 1929b), Cepheid variables have remained a widely applicable and powerful method for measuring distances to nearby galaxies. In 2009, the American Astronomical Society Council passed a resolution recognizing the 100th anniversary of Henrietta Leavitt's first presentation of the Cepheid Period-Luminosity relation (Leavitt 1908). The Council noted that it was pleased to learn of a resolution adopted by the organizers of the Leavitt symposium, held in November, 2008 at the Harvard-Smithsonian Center for Astrophysics, Cambridge, MA. There, it was suggested that the Cepheid Period-Luminosity relation be referred to as the Leavitt Law in recognition of Leavitt's fundamental discovery, and we do so here.
Cepheids are observed to pulsate with periods ranging from 2 to over 100 days, and their intrinsic brightnesses correlate with those periods, ranging from -2 < MV < -6 mag. The ease of discovery and identification of these bright, variable supergiants make them powerful distance indicators. Detailed reviews of the Cepheid distance scale and its calibration can be found in Madore & Freedman (1991), Sandage & Tammann (2006), Fouque et al. (2007) and Barnes (2009). A review of the history of the subject is given by Fernie (1969).
There are many steps that must be taken in applying Cepheids to the extragalactic distance scale. The Cepheids must be identified against the background of fainter, resolved and unresolved stars that contribute to the surrounding light of the host galaxy. Overcoming crowding and confusion is the key to the successful discovery, measurement and use of Cepheids in galaxies beyond the Local Group. From the ground, atmospheric turbulence degrades the image resolution, decreasing the contrast of point sources against the background. In space the resolution limit is set by the aperture of the telescope and the operating wavelengths of the detectors. HST gives a factor of ten increased resolution over most groundbased telescopes of comparable and larger aperture.
As higher precision data have been accumulated for Cepheids in greater numbers and in different physical environments, it has become possible to search for and investigate a variety of lower level, but increasingly important, systematics affecting the Leavitt Law. Below we briefly discuss these complicating effects (reddening and metallicity, in specific) and their uncertainties, and quantify their impact on the extragalactic distance scale. We then elaborate on methods for correcting for and/or mitigating their impact on distance determinations. But first we give an overview of the physical basis for the Cepheid period-luminosity relation in general terms.
3.1.1. UNDERLYING PHYSICS The basic physics connecting the luminosity and color of a Cepheid to its period is well understood. Using the Stephan-Boltzmann law
 |
(8) |
the bolometric luminosities, L, of all stars, including Cepheids, can be derived. Expressed in magnitudes, the Stefan-Boltzmann Law becomes
 |
(9) |
Hydrostatic equilibrium can be achieved for long periods of time along the core-helium-burning main sequence. As a result stars are constrained to reside there most of the time, thereby bounding the permitted values of the independent radius and temperature variables for stars in the MBOL - log Te plane.
If log Te is mapped into an observable intrinsic
color (i.e.,
(B - V)o or (V - I)o)
and radius is mapped into an observable period
(through a period-mean-density relation), the period-luminosity-color
(PLC) relation for Cepheids can be determined (e.g.,
Sandage 1958;
Sandage & Gratton
1963;
and
Sandage & Tammann
1968).
In its linearized form for pulsating variables, the Stefan-Boltzmann law
takes on the following form of the PLC: MV =
 log P +
 (B
- V)o +
(B
- V)o +
 .
.
Cepheid pulsation occurs because of the changing atmospheric opacity with temperature in the doubly-ionized helium zone. This zone acts like a heat engine and valve mechanism. During the portion of the cycle when the ionization layer is opaque to radiation that layer traps energy resulting in an increase in its internal pressure. This added pressure acts to elevate the layers of gas above it resulting in the observed radial expansion. As the star expands it does work against gravity and the gas cools. As it does so its temperature falls back to a point where the doubly-ionized helium layer recombines and becomes transparent again, thereby allowing more radiation to pass. Without that added source of heating the local pressure drops, the expansion stops, the star recollapses, and the cycle repeats. The alternate trapping and releasing of energy in the helium ionization layer ultimately gives rise to the periodic change in radius, temperature and luminosity seen at the surface. Not all stars are unstable to this mechanism. The cool (red) edge of the Cepheid instability strip is thought to be controlled by the onset of convection, which then prevents the helium ionization zone from driving the pulsation. For hotter temperatures, the helium ionization zone is located too far out in the atmosphere for significant pulsations to occur. Further details can be found in the classic stellar pulsation text book by Cox (1980).
Cepheids have been intensively modeled numerically, with increasingly sophisticated hydrodynamical codes (for a recent review see Buchler 2010). While continuing progress is being made, the challenges remain formidable in following a dynamical atmosphere, and in modeling convection with a time-dependent mixing length approximation. In general, observational and theoretical period-luminosity-color relations are in reasonable agreement (e.g., Caputo 2008). However, as discussed in Section 3.1.3, subtle effects (for example the effect of metallicity on Cepheid luminosities and colors) remain difficult to predict from first principles.
3.1.2. CEPHEIDS AND INTERSTELLAR EXTINCTION If one adopts a mean extinction law and applies it universally to all Cepheids, regardless of their parent galaxy's metallicity, then one can use the observed colors and magnitudes of the Cepheids to correct for the total line-of-sight extinction. If, for example, observations are made at V and I wavelengths (as is commonly done with HST), and the ratio of total-to-selective absorption RVI = AV / E(V - I) is adopted a priori (e.g., Cardelli, Clayton & Mathis 1989), then one can form from the observed colors and magnitudes an extinction-free, Wesenheit magnitude, W, (Madore 1982), defined by
 |
(10) |
as well as an intrinsic Wesenheit magnitude Wo
 |
(11) |
By construction
 |
(12) (13) |
where V = Vo + AV and (V - I) = (V - I)o + E(V - I), and AV = RVI × E(V - I), thereby reducing the last two terms to zero, leaving W = Vo - RVI × (V - I)o which is equivalent to the definition of Wo.
The numerical value of W as constructed from observed data points is numerically identical to the intrinsic (unreddened) value of the Wesenheit function, Wo. Thus, W, for any given star, is dimmed only by distance and (by its definition) it is unaffected by extinction, again only to the degree that R is known and is universal. W can be formed for any combination of optical/near-infrared bandpasses.
3.1.3. METALLICITY The atmospheres of stars like Cepheids, having effective temperatures typical of G and K supergiants, are affected by changes in the atmospheric metal abundance. There are additionally changes in the overall stellar structure (the mass-radius relation) due to changes in chemical composition. Thus, it is expected that the colors and magnitudes of Cepheids, and their corresponding PL relations, should be a function of metallicity. However, predicting the magnitude (and even simply the sign of the effect) at either optical or even longer wavelengths, has proven to be challenging: different theoretical studies have led to a range of conclusions. We review below the empirical evidence. For a comparison with recent theoretical studies we refer the interested readers to papers by Sandage, Bell & Tripicco (1999), Bono et al. (2008), Caputo (2008) and Romaniello et al. (2008, 2009).
Two tests of the metallicity sensitivity of the Cepheid PL relation have been proposed. The first test uses measured radial metallicity gradients within individual galaxies to provide a differential test in which observed changes in the Cepheid zero point with radius are ascribed to changes in metallicity. This test assumes that the Cepheids and the HII regions (which calibrate the measured [O/H] abundances) share the same metallicity at a given radius, and that other factors are not contributing to a zero-point shift, such as radially dependent crowding or changes of the extinction law with radius, etc. The second test uses the difference between Cepheid and TRGB distances for galaxies with both measurements and seeks a correlation of these differences as a function of the Cepheid (i.e., HII region) metallicity.
The first test, leveraging metallicity gradients in individual galaxies, has been undertaken for M31 (Freedman & Madore 1990), M101 (Kennicutt et al. 1998), NGC 4258 (Macri et al. 2006) and M33 (Scowcroft et al. 2009). The second test, comparing TRGB and Cepheid distances, was first made by Lee, Freedman & Madore (1993). Udalski et al. (2001) used a newly observed sample of Cepheids in IC 1613 in comparison to a TRGB distance to that same galaxy, and concluded that, in comparison with the SMC, LMC and NGC 6822 there was no metallicity effect over a factor of two in metallicity at low mean metallicity. An extensive cross comparison of Cepheid and TRGB distances including high-metallicity systems is well summarized by Sakai et al. (2004). Individual datasets and metallicity calibrations are still being debated, but the general concensus is that for the reddening-free W(VI) calibration of the Cepheid distance scale there is a metallicity dependence that, once corrected for, increases the distance moduli of higher metallicity Cepheids if their distances are first determined using a lower metallicity (e.g., LMC) PL calibration. However, in a different approach, Romaniello et al (2008) have obtained direct spectroscopic [Fe/H] abundances for a sample of Galactic, LMC and SMC Cepheids. They compare the Leavitt Law for samples of stars with different mean metallicities and find a dependence of the V-band residuals with [Fe/H] abundance that is in the opposite sense to these previous determinations. Clearly the effect of metallicity on the observed properties of Cepheids is still an active and on-going area of research.
A remaining uncertainty at the end of the Ho Key Project (described further in Section 4 was due to the fact that the majority of Key Project galaxies have metallicities more comparable to the Milky Way than to the LMC, which was used for the calibration. Below, in Section 3.1.4 we ameliorate this systematic error by adopting a Galactic calibration provided by new trigonometric parallaxes of Milky Way Cepheids, not available at the time of the Key Project. By renormalizing to a high-metallicity (Galactic) calibration for the Cepheids, metallicity effects are no longer a major systematic, but rather a random error, whose size will decrease with time as the sample size increases. Based on the Cepheid metallicity calibration of Sakai et al (2004) (with adopted LMC and Solar values for 12 + log (O/H) of 8.50 and 8.70, respectively; and a metallicity slope of 0.25 mag/dex), we estimate the metallicity correction in transforming from an LMC to a Galactic-based Cepheid zero point to be 0.25 × 0.2 = 0.05 mag, with a residual scatter of about ± 0.07 mag.
3.1.4. GALACTIC CEPHEIDS WITH TRIGONOMETIC PARALLAXES An accurate trigonometric parallax calibration for Galactic Cepheids has been long sought, but very difficult to achieve in practice. All known classical (Galactic) Cepheids are more than 250 pc away: therefore for direct distance estimates good to 10%, parallax accuracies of ± 0.2 milliarcsec are required, necessitating space observations. The Hipparchos satellite reported parallaxes for 200 of the nearest Cepheids, but (with the exception of Polaris) even the best of these were of very low signal-to-noise (Feast & Catchpole 1997).
Recent progress has come with the use of the Fine Guidance Sensor on HST (Benedict et al. 2007), whereby parallaxes, in many cases accurate to better than ± 10% for individual stars were obtained for 10 Cepheids, spanning the period range 3.7 to 35.6 days. We list the distance moduli, errors, and distances for these Cepheids in Table 1. These nearby Cepheids span a range of distances from about 300 to 560 pc.
| Cepheid | P(days) | logP | µ (mag.) | σ (%) | Distance (pc) |
| RT Aur | 3.728 | 0.572 | 8.15 | 7.9 | 427 |
| T Vul | 4.435 | 0.647 | 8.73 | 12.1 | 557 |
| FF Aql | 4.471 | 0.650 | 7.79 | 6.4 | 361 |
 Cep
Cep |
5.366 | 0.730 | 7.19 | 4.0 | 274 |
| Y Sgr | 5.773 | 0.761 | 8.51 | 13.6 | 504 |
| X Sgr | 7.013 | 0.846 | 7.64 | 6.0 | 337 |
| W Sgr | 7.595 | 0.881 | 8.31 | 8.8 | 459 |
| Dor |
9.842 | 0.993 | 7.50 | 5.1 | 316 |
 Gem
Gem |
10.151 | 1.007 | 7.81 | 6.5 | 365 |
| l Car | 35.551 | 1.551 | 8.56 | 9.9 | 515 |
The calibration of the Leavitt relation based on these ten stars leads to an error on their mean of ± 3% (or ± 0.06 mag), which we adopt here as the systematic error on the distance to the LMC discussed below, and the Cepheid zero point, in general. In what follows, we adopt the zero-point based on the Galactic calibration, but retain the slope based on the LMC, since the sample size is still much larger and statistically better defined. Improvement of this calibration (both slope and zero point) awaits a larger sample of (long-period) Cepheids from GAIA. We have adopted a zero-point calibration based both on these HST data, as well as a calibration based on the maser galaxy, NGC 4258 (Section 3.3) and present a revised value of Ho in Section 4.
A significant systematic at this time is the calibration zero point. Its value depends on only ten stars, each of which have uncertainties in their distances that are individually at the 10% level. Given the small sample size of the Galactic calibrators, the error on their mean can be no better than 3% (or ± 0.06 mag), which we adopt here as the newly revised systematic error on the distance to the LMC, and on the Cepheid zero point in general. In what follows, we adopt the zero point based on the Galactic calibration, but retain the slope based on the LMC, because the sample size is still much larger and therefor statistically better defined. There has recently been discussion in the literature about possible variations in the slope of the Leavitt Law occurring around 10 days (see Ngeow, Kanbur & Nanthakumar (2008) and references therein); however, Riess et al. (2009a) and Madore & Freedman (2009) both find that when using W, the differences are not statistically significant. Improvement of this calibration (both in the slope and zero point) awaits a larger sample of (long-period) Cepheids from the Global Astrometric Interforometer for Astrophysics satellite (GAIA).
3.1.5. THE DISTANCE TO THE LARGE MAGELLANIC CLOUD Because of the abundance of known Cepheids in the Large Magellanic Cloud this galaxy has historically played a central role in the calibration of the Cepheid extragalactic distance scale. Several thousand Cepheids have been identified and cataloged in the LMC (Leavitt 1908; Alcock et al. 2000; Soszynski et al. 2008), all at essentially the same distance. Specifically, the slope of the Leavitt Law is both statistically and systematically better determined in the LMC than it is for Cepheids in our own Galaxy. This is especially true for the long-period end of the calibration where the extragalactic samples in general are far better populated than the more restricted Milky Way subset available in close proximity to the Sun. In Figure 2 we show the range of values of LMC distance moduli based on non-Cepheid moduli, published up to 2008. The median value of the non-Cepheid distance moduli is 18.44 ± 0.16 mag.
 |
Figure 2. The cumulative probability density distribution of 180 distance modulus estimates to the LMC culled from the recent literature, provided by NED. Individual estimates are shown by unit-area gaussians with a dispersion set to their quoted statistical errors. The thin solid line represents the renormalized sum of those gaussians. The thick broken line represents the value of 18.39 mag and a systematic error of ± 0.03 mag for the true (Wesenheit) distance modulus to the LMC, based on the Galactic parallax calibration for Cepheids and corrected for metallicity by -0.05 mag. For comparison the median value of the published, non-Cepheid distance moduli is 18.44 ± 0.16 mag (shown as the circled point and error bar); the mode of the non-Cepheid moduli is 18.47 mag. The Cepheid value is statistically indistinguishable from this highly heterogeneous, but fairly complete, set of independently published determinations. |
Based on the new results for direct geometric parallaxes to Galactic
Cepheids
(Benedict et al. 2007)
discussed in Section 3.1.4, we calibrate the sample
of LMC Cepheids used
as fiducial for the HST Key Project. The new Galactic parallaxes now
allow a zero point to be obtained for the Leavitt Law. In
Figure 3, we
show BVIJHK Leavitt Laws for the Galaxy and LMC calibrated with the
new parallaxes. As can be seen, the slope of the Leavitt Law
increases with increasing wavelength, with a corresponding decrease in
dispersion. In the past, because of the uncertainty in the Galactic
Cepheid calibration, a distance modulus to the LMC and the mean
Cepheid extinction were obtained using a combination of several
independent methods. Multi-wavelength Leavitt Laws were then used to
obtain differential extragalactic distances and reddenings for
galaxies beyond the LMC. We can show here for the first time the
multiwavelength solution for the distance to the LMC itself based on
the apparent BVIJHK Cepheid distance moduli, fit to a
Cardelli et al. (1989)
extinction curve, and adopting a Galactic calibration for
the zero point, and the slope from the LMC data. The LMC
apparent moduli, scaled to the Galactic calibration are shown as a
function of inverse wavelength in Figure 4. The
data are well fit by a Galactic extinction law having a scale factor
corresponding to E(B-V) = 0.10 mag, and an intercept at 1 /
 = 0.00, corresponding
to a true modulus of µ(LMC)o = 18.40 ±
0.01 mag.
= 0.00, corresponding
to a true modulus of µ(LMC)o = 18.40 ±
0.01 mag.
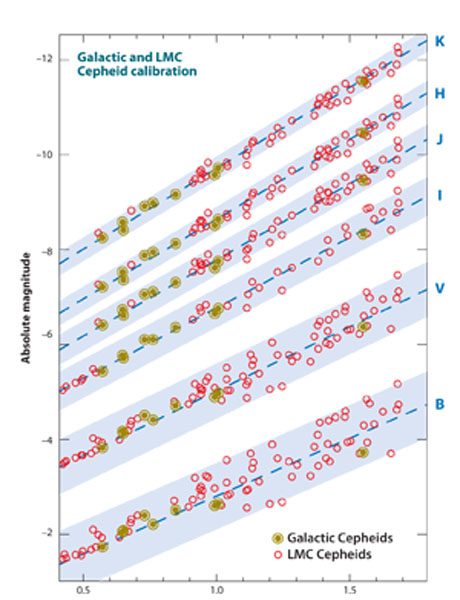 |
Figure 3. Composite multiwavelength Period-Luminosity relations (Leavitt Laws) for Galactic (circled filled dots) and LMC (open circles) Cepheids from the optical (BVI) through the near-infrared (JHK). There is a monotonic increase in the slope, coupled with a dramatic decrease in total dispersion of the PL relations as one goes to longer and longer wavelengths. |
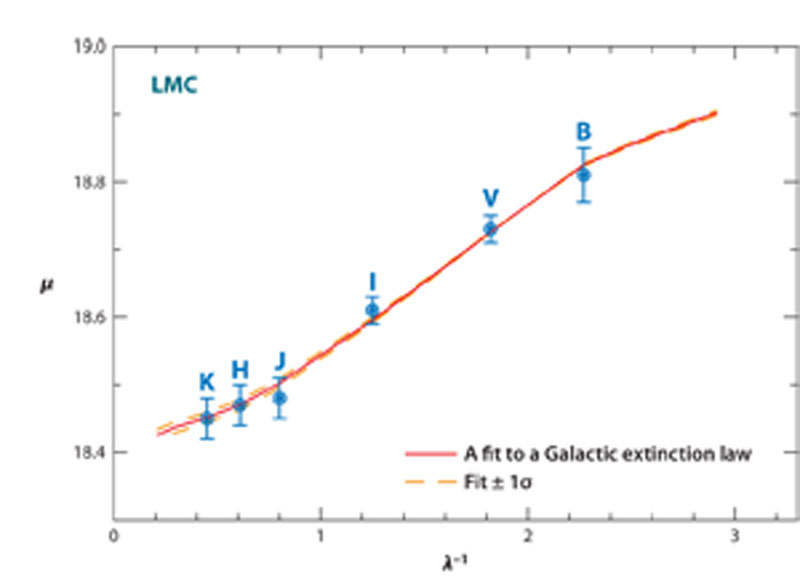 |
Figure 4. Standard extinction-curve fit to
six multiwavength (BVIJHK) apparent distance moduli to the LMC scaled to the HST Galactic parallax sample
(Benedict et al. 2007).
The minimized- |
The composite (Galactic + LMC) VI Wesenheit function is shown in Figure 5. The correspondence between the two independent Cepheid samples is good, and the dispersion in W remains very small. The Wesenheit function uses fewer wavelengths, but it employs the two bandpasses directly associated with the HST Key Project and most extragalactic Cepheid distances, and so we adopt it here.
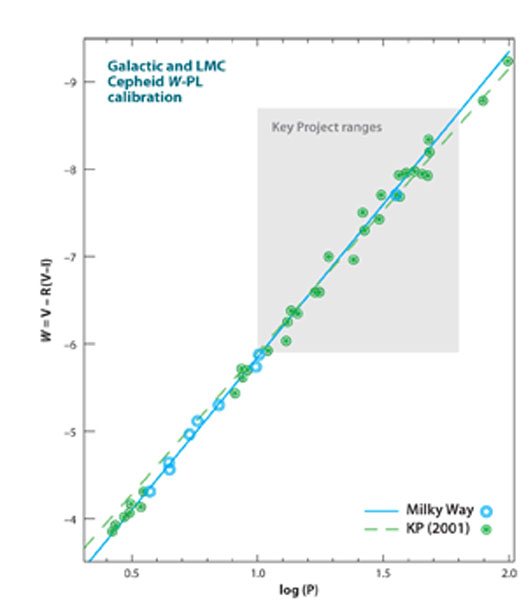 |
Figure 5. The reddening-free VI Wesenheit PL relation showing the combined data for Galactic Cepheids having individually-determined trigonometric parallaxes (circled dots) and Large Magellanic Cloud Cepheids (open circles) brought into coincidence with the Galactic calibration after an offset of 18.44 mag between their apparent magnitudes. The solid line is a fit to the combined data. The dashed line is the calibration used by Freedman et al. (2001) at the conclusion of the Key Project. The inner bounding box shows the period and luminosity range used by the Key Project to determine extragalactic distances. The correspondence between the two calibrations is very close, but it should be noted that the Galactic calibration is for Galactic metallicity. |
The W(V,VI) Wesenheit function gives a minimized fit between the Galactic and the LMC Cepheids corresponding to a true distance modulus of µ(LMC)o = 18.44 ± 0.03 mag. Correcting for metallicity (see Section 3.1.3) would decrease this to 18.39 mag. Because of the large numbers of Cepheids involved over numerous wavelengths, the statistical errors on this value are small; and once again systematic errors dominate the error budget. As discussed in Section 3.1.4, we adopt a newly revised systematic error on the distance to the LMC, of 3% (or ± 0.06 mag).
As noted above, the main drawback to using the LMC as the fundamental calibrator of the Leavitt Law is the fact that the LMC Cepheids are of lower metallicity than many of the more distant spiral galaxies useful for measuring the Hubble constant. This systematic is largely eliminated by adopting the higher-metallicity Galactic calibration as discussed in Section 3.1.3, or the NGC 4258 calibration discussed in Section 3.3.
3.2. Tip of the Red Giant Branch (TRGB) Method
As discussed briefly in Section 3.1.3 a completely independent method for determining distances to nearby galaxies that has comparable precision to Cepheids is the tip of the red giant branch (TRGB). The TRGB method uses the theoretically well-understood and observationally well-defined discontinuity in the luminosity function of stars evolving up the red giant branch in old, metal-poor stellar populations. This feature has been calibrated using Galactic globular clusters, and because of its simplicity and straightforward application it has been widely used to determine distances to nearby galaxies. A recent and excellent review of the topic is given by Rizzi et al. (2007) and Bellazzini (2008).
Using the brightest stars in globular clusters to estimate distances has a long history (ultimately dating back to Shapley 1930 and later discussed again by Baade 1944). The method gained widespread application in a modern context in two papers, one by Da Costa & Armandroff (1990) (for Galactic globular clusters), and the other by Lee, Freedman & Madore (1993) (where the use of a quantitative digital filter to measure the tip location was first introduced in a extragalactic context).
Approximately 250 galaxies have had their distances measured by the TRGB method, compared to a total of 57 galaxies with Cepheid distances. (A comprehensive compilation of direct distance determinations is available at the following web site: /level5/NED1D/ned1d.html). In practice, the TRGB method is observationally a much more efficient technique, since, unlike for Cepheid variables, there is no need to follow them through a variable light cycle: a single-epoch observation, made at two wavelengths (to provide color information) is sufficient. A recent example of applying the TRGB technique to the maser galaxy, NGC 4258, is shown in Figure 6.
 |
Figure 6. An example of the detection and measurement of the discontinuity in the observed luminosity function for red giant branch stars in the halo of the maser galaxy NGC 4258 (Mager, Madore & Freedman 2008). The color-magnitude diagram on the left has been adjusted for metallicity such that the TRGB is found at the same apparent magnitude independent of color/metallicity of the stars at the tip. The right panel shows the output of an edge-detection (modified Sobel) filter whose peak response indicates the TRGB magnitude and whose width is used as a measure of the random error on the detection. |
3.2.1. THEORY The evolution of a post-main-sequence low-mass star up the red giant branch is one of the best-understood phases of stellar evolution (e.g., Iben & Renzini 1983). For the stars of interest in the context of the TRGB, a helium core forms at the center, supported by electron degeneracy pressure. Surrounding the core, and providing the entire luminosity of the star is a hydrogen-burning shell. The "helium ash" from the shell increases the mass of the core systematically with time. In analogy with the white dwarf equation of state and the consequent scaling relations that interrelate core mass, Mc, and core radius, Rc, for degenerate electron support, the core (= shell) temperature, Tc, and the resulting shell luminosity are simple functions of Mc and Rc alone: Tc ~ Mc / Rc and Lc ~ Mc7 / Rc5. As a result, the core mass increases, the radius simultaneously shrinks and the luminosity increases due to both effects. The star ascends the red giant branch with increasing luminosity and higher core temperatures. When Tc exceeds a physically well-defined temperature, helium ignites throughout the core. The helium core ignition does not make the star brighter, but rather it eliminates the shell source by explosively heating and thereby lifting the electron degeneracy within the core. This dramatic change in the equation of state is such that the core flash (which generates the equivalent instantaneous luminosity of an entire galaxy) is internally quenched in a matter of seconds, inflating the core and settling down to a lower-luminosity, helium core-burning main sequence. The transition from the red giant to the horizontal branch occurs rapidly (within a few million years) so that observationally the TRGB can be treated as a physical discontinuity. A stellar evolutionary "phase change" marks the TRGB. The underlying power of the TRGB is that it is a physically-based and theoretically well-understood method for determining distance. Nuclear physics fundamentally controls the stellar luminosity at which the RGB is truncated, essentially independent of the chemical composition and/or residual mass of the envelope sitting above the core.
The radiation from stars at the TRGB is redistributed with wavelength as a function of the metallicity and mass of the envelope. Empirically it is found that the bolometric corrections are smallest in the I-band, and most recent measurements have been made at this wavelength. The small residual metallicity effect on the TRGB luminosity is well documented, and can be empirically calibrated out (see Madore, Mager & Freedman 2009).
3.2.2. RECENT TRGB RESULTS AND CALIBRATION OF Ho In the context of measuring the Hubble constant, RGB stars are not as bright as Cepheids, and therefore cannot be seen as far, but they can still be seen to significant distances ( ~ 20 Mpc and including Virgo, e.g., Durrell et al. 2007; Caldwell 2006) and, as we have seen, they can serve an extremely important function as an independent test of the Cepheid distance scale and check on systematic effects.
Mould & Sakai (2008) have used the TRGB as an alternate calibration to the Cepheid distance scale for the determination of Ho. They use 14 galaxies for which TRGB distances can be measured to calibrate the Tully-Fisher relation, and determine a value of Ho = 73 ± 5 (statistical only) km s-1 Mpc-1, a value about 10% higher than found earlier by Sakai et al. (2000) based on a Cepheid calibration of 23 spiral galaxies with Tully-Fisher measurements. In subsequent papers they calibrate the SBF method (Mould & Sakai 2009a) and then go on to check the calibration of the FP for early-type galaxies and the luminosity scale of Type Ia supernovae (Mould & Sakai 2009b). They conclude that the TRGB and Cepheid distances scales are all consistent using SBF, FP, SNe Ia and the TF relation.
H2O mega-masers have recently been demonstrated to be a powerful new geometric tool for accurately measuring extragalactic distances. An extensive review of both the physical nature and the application of mega-masers to the extragalactic distance scale can be found in Lo (2005). The technique utilizes the mapping of 22.2 GHz water maser sources in the accretion disks of massive black holes located in spiral galaxies with active galactic nuclei, through modeling of a rotating disk ideally in pure Keplerian motion. In the simplest version of the technique, a rotation curve is measured along the major axis of the disk; proper motions are measured on the near side of the disk minor axis, and a comparison of the angular velocities in the latter measurement with the absolute velocities in km s-1 in the former measurements yields the distance.
The method requires a sample of accretion disks that are relatively edge on (so that a rotation curve can be obtained from radial-velocity measurements) and a heating source such as x-rays or shocks to produce maser emission. The basic assumption is that the maser emission arises from trace amounts of water vapor (< 10-5 in number density) in very small density enhancements in the accretion disk and that they act as perfect dynamical test particles. The maser sources appear as discrete peaks in the spectrum or as unresolved spots in the images constructed from Very Long Baseline Interferometry (VLBI). Measurements of the acceleration (a = V2 / r) are obtained directly by monitoring the change of maser radial velocities over time from single-dish observations. Proper motions are obtained from observed changes in angular position in interferometer images. The approximately Keplerian rotation curve for the disk is modeled, allowing for warps and radial structure. The best studied galaxy, NGC 4258, at a distance of about 7 Mpc, is too close to provide an independent measurement of the Hubble constant (i.e., free from local velocity-field perturbations) but it serves as an invaluable independent check of the Cepheid zero-point calibration.
3.3.1. A MASER DISTANCE TO NGC 4258
VLBI observations of H2O maser sources
surrounding the active galactic nucleus of NGC 4258 reveal them to be in a very thin,
differentially rotating, slightly warped disk. The Keplerian velocity
curve has deviations of less than one percent. The disk has a
rotational velocity in excess of 1,000 km/s at distances on the order
of 0.1 pc from the inferred super-massive (107
M ) nuclear
black hole. Detailed analyses of the structure of the accretion disk
as traced by the masers have been published (e.g.,
Herrnstein et al. 1999;
Humphreys et al. 2008
and references therein). Over time it
has been possible to measure both proper motions and accelerations of
these sources and thereby allow for the derivation of two independent
distance estimates to this galaxy. The excellent agreement of these
two estimates supports the a priori adoption of the Keplerian
disk model and gives distances of 7.2 ± 0.2 and 7.1 ±
0.2 Mpc, respectively.
) nuclear
black hole. Detailed analyses of the structure of the accretion disk
as traced by the masers have been published (e.g.,
Herrnstein et al. 1999;
Humphreys et al. 2008
and references therein). Over time it
has been possible to measure both proper motions and accelerations of
these sources and thereby allow for the derivation of two independent
distance estimates to this galaxy. The excellent agreement of these
two estimates supports the a priori adoption of the Keplerian
disk model and gives distances of 7.2 ± 0.2 and 7.1 ±
0.2 Mpc, respectively.
Because of the simplicity of the structure of the maser system in NGC 4258 and its relative strength, NGC 4258 will remain a primary test bed for studying systematic effects that may influence distance estimates. Several problems may limit the ultimate accuracy of this technique, however. For example, because the masers are only distributed over a small angular part of the accretion disk, it is difficult to assess the importance of non-circular orbits. Of possible concern, eccentric disks of stars have been observed in a number galactic nuclei where the potential is dominated by the black hole, as is the case for NGC 4258. In addition, even if the disk is circular, it is not a given that the masers along the minor axis are at the same radii as the masers along the major axis. The self gravity of the disk also may need to be investigated and modeled since the maser distribution suggests the existence of spiral arms (Humphreys et al., 2008). Finally, radiative transfer effects may cause non-physical motions in the maser images. Although the current agreement of distances using several techniques is comforting, having only one sole calibrating galaxy for this technique remains a concern, and further galaxies will be required to ascertain the limiting uncertainty in this method.
3.3.2. OTHER DISTANCE DETERMINATIONS TO NGC 4258 The first Cepheid distance to NGC 4258 was published by Maoz et al. (1999) who found a distance of 8.1 ± 0.4 Mpc, based on an LMC-calibrated distance modulus of 18.50 mag. Newman et al. (2001) found a distance modulus of 29.47 ± 0.09 (random) ± 0.15 (systematic) giving a distance of 7.83 ± 0.3 ± 0.5 Mpc. Macri et al. (2006) reobserved NGC 4258 in two radially (and chemically) distinct fields discovering 281 Cepheids at BV and I wavelengths. Their analysis gives a distance modulus of 29.38 ± 0.04 ± 0.05 mag (7.52 ± 0.16 Mpc), if one adopts µ(LMC) = 18.50 mag. Several more recent determinations of resolved-star (Cepheid and TRGB) distance moduli to NGC 4258 are in remarkably coincident agreement with the maser distance modulus. di Benedetto (2008) measures a Cepheid distance modulus of 29.28 ± 0.03 ± 0.03 for NGC 4258, corresponding to a distance of 7.18 Mpc; Benedict et al. (2007) also find a distance modulus of 29.28 ± 08 mag ; and Mager, Madore & Freedman (2008) also find a value of 29.28 ± 0.04 ± 0.12 mag both from Cepheids and from the TRGB method. These latter studies are in exact agreement with the current maser distance. Higher accuracy has come from larger samples with higher signal-to-noise data, and improved treatment of metallicity.
An alternative approach to utilizing the maser galaxy in the distance scale is to adopt the geometric distance to NGC 4258 as foundational, use it to calibrate the Leavitt Law, and from there determine the distance to the LMC. Macri et al. (2006) adopted this approach and conclude that the true distance modulus to the LMC is 18.41 ± 0.10 mag. This value agrees well with the new Galactic Cepheid calibration of the LMC Leavitt law, as discussed in Section 3.1.5.
3.3.3. NGC 4258 AND THE CALIBRATION OF Ho The distance to NGC 4258 can be used to leapfrog over the LMC altogether to calibrate the Cepheid PL relation and then secondary methods. Macri et al. (2006) and Riess et al. (2009a, b) have adopted the distance to NGC 4258 as a calibration of the supernova distance scale, as discussed further in Section 3.6.2.
Attempts to measure distances to other megamasers has proved to be difficult. About 2000 galaxies have been surveyed for masers and more than 100 masers discovered to date. The detection rate of about 5% is likely due to detection sensitivity and the geometric constraint that the maser disk be viewed nearly edge on because the maser emission is expected to be highly beamed in the plane of the disk. About 30 of these masers have spectral profiles indicative of emission from thin disks: i.e., masers at the galactic systemic velocity and groups of masers symmetrically spaced in velocity. About a dozen maser galaxies are sufficiently strong that they can be imaged with phase-referenced VLBI techniques. Only about five have been found to have sufficiently simple structure so that they can be fit to dynamical models and have their distances determined. The most promising examples of these galaxies is UGC 3789, which has a recessional velocity of greater than 3000 km/s, and is being pursued by the Megamaser Cosmology Project (Reid et al. 2009).
If a significant number of maser galaxies can be found and precisely observed well into the Hubble flow, this method, can, in principle, compete with methods such as SNe Ia for measuring Ho. The challenge will be to obtain large enough sample sizes of hundreds of objects, in order to average over large-scale flows. Unfortunately, this likely will not be accomplished in the upcoming decade. It is also hoped that nearby objects will be found where this technique can be applied, in addition to NGC 4258, and strengthen the zero-point calibration of the extragalactic distance scale. The future for this technique (beyond 2020) looks promising, given a high- frequency capability for the Square Kilometer Array.
3.4. Surface Brightness Fluctuation (SBF) Method
For distances to elliptical galaxies and early-type spirals with large bulge populations the Surface Brightness Fluctuation (SBF) method, first introduced by Tonry and Schneider (1988), overlaps with and substantially exceeds the current reach of the TRGB method. Both methods use properties of the red giant branch luminosity function to estimate distances. The SBF method quantifies the effect of distance on an over-all measure of resolution of the Population II red giant stars, naturally weighted both by their intrinsic luminosities and relative numbers. What is measured is the pixel-to-pixel variance in the photon statistics (scaled by the surface brightness) as derived from an image of a pure population of red giant branch stars. For fixed surface brightness, the variance in a pixel (of fixed angular size) is a function of distance, simply because the total number of discrete sources contributing to any given pixel increases with the square of the distance. While the TRGB method relies entirely on the very brightest red giant stars, the SBF method uses a luminosity-weighted integral over the entire RGB population in order to define a typical "fluctuation star" whose mean magnitude, MI is assumed to be universal and can therefore be used to derive distances. For recent discussions of the SBF method, the reader is referred to Biscardi et al. (2008) and Blakeslee et al. (2009).
Aside from the removal of obvious sources of contamination such as foreground stars, dust patches and globular clusters, the SBF method does require some additional corrections. It is well known that the slope of the red giant branch in the color-magnitude diagram is a function of metallicity, and so the magnitude of the fluctuation star is both expected and empirically found to be a function metallicity. A (fairly steep) correction for metallicity has been derived and can be applied using the mean color of the underlying stellar population MI = -1.74 +4.5(V - I)o -1.15 (Tonry et al. 2002).
A recent and comprehensive review of the application of the SBF method to determining cosmic distances, and its comparison to the Fundamental-Plane (FP) method is given in Blakeslee et al (2002). Over 170 galaxies enter into the comparison; this analysis leads to the conclusion that Ho = 72 ± 4 (random) ± 11 (systematic) km/s/Mpc.
The total luminosity of a spiral galaxy (corrected to face-on inclination to account for extinction) is strongly correlated with the galaxy's maximum (corrected to edge-on inclination) rotation velocity. This relation, calibrated via the Leavitt Law or TRGB, becomes a powerful means of determining extragalactic distances (Tully & Fisher 1977; Aaronson et al. 1986; Pierce & Tully 1988; Giovanelli et al. 1997). The Tully-Fisher relation at present is one of the most widely applied methods for distance measurements, providing distances to thousands of galaxies both in the general field and in groups and clusters. The scatter in this relation is wavelength-dependent and approximately ± 0.3-0.4 mag or 15-20% in distance (Giovanelli et al. 1997; Sakai et al. 2000; Tully & Pierce 2000).
In a general sense, the Tully-Fisher relation can be understood in terms of the virial relation applied to rotationally supported disk galaxies, under the assumption of a constant mass-to-light ratio (Aaronson, Mould & Huchra 1979). However, a detailed self-consistent physical picture that reproduces the Tully-Fisher relation (e.g., Steinmetz & Navarro 1999), and the role of dark matter in producing almost universal spiral galaxy rotation curves (McGaugh et al. 2000) still remain a challenge.
Spitzer archival data have recently yielded an unexpected and exciting discovery. Of the 23 nearby galaxies with HST Cepheid distances that can be used to independently calibrate the Tully-Fisher relation, there are eight that currently also have 3.6µm published total magnitudes (Dale et al. 2007). In Figure 7 (left three panels) we show the B, I and H-band TF relations for the entire sample of currently available calibrating galaxies from Sakai et al. (2000). Their magnitudes have been corrected for inclination-induced extinction effects and their line widths have been corrected to edge-on. The scatter is ± 0.43, 0.36 and 0.36 mag for the B, I and H-band relations, respectively; the outer lines follow the mean regression at ± 2-sigma. If it holds up with further data, this intrinsic scatter means that to measure a distance good to 5%, say, using even the best of these TF relations one would need to find a grouping of 16 galaxies in order to beat down the intrinsic rms scatter. In the right panel of Figure 7 we show the mid-IR TF relation for the eight galaxies with Cepheid distances and published IRAC observations, measured here at 3.6µm. The gains are impressive. With the magnitudes not even corrected for any inclination effects, the scatter within this sample is found to be only ± 0.12 mag. Each of these galaxies entered the calibration with its own independently determined Cepheid-calibrated distance. If this correlation stands the test of time as additional calibrators enter the regression, using the mid-IR TF relation a single galaxy could potentially yield a distance good to ± 5%. All TF galaxies, when observed in the mid-IR, would then individually become precision probes of large-scale structure, large-scale flows and the Hubble expansion.
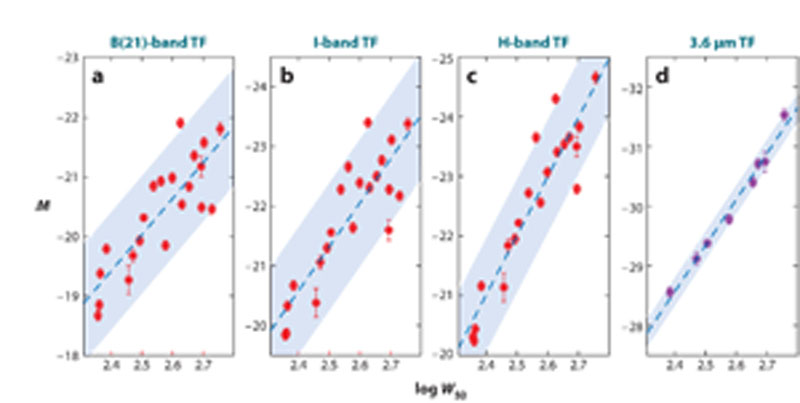 |
Figure 7. Multi-wavelength Tully-Fisher relations. The three left panels show the B,I and H-band TF relations for all of the galaxies calibrated with independently-measured Cepheid moduli from the HST Key Project. The right-hand panel shows the TF relation for the subset of galaxies drawn from the Key Project calibrators that also have published 3.6 µm total magnitudes. The significantly reduced dispersion in the mid-infrared dataset is impressive; however, a larger sample of calibrators is needed to confirm the scatter and slope of the relation at this wavelength. |
One of the most accurate means of measuring cosmological distances out into the Hubble flow utilizes the peak brightness of Type Ia supernovae (SNe Ia). The potential of supernovae for measuring distances was clear to early researchers (e.g., Baade, Minkowski, Zwicky) but it was the Hubble diagram of Kowal (1968) that set the modern course for this field, followed by decades of work by Sandage, Tammann and collaborators (e.g., Sandage & Tammann 1982; Sandage & Tammann 1990); see also the review by Branch (1998). Analysis by Pskovskii (1984), followed by Phillips (1993), established a correlation between the magnitude of a SN Ia at peak brightness and the rate at which it declines, thus allowing supernova luminosities to be "standardized". This method currently probes farthest into the unperturbed Hubble flow, and it possesses very low intrinsic scatter: in recent studies, the decline-rate corrected SN Ia Hubble diagram is found to have a dispersion of ± 7-10% in distance (e.g., Folatelli et al. 2009, Hicken et al. 2009). A simple lack of Cepheid calibrators prevented the accurate calibration of Type Ia supernovae for determination of Ho prior to HST. Substantial improvements to the supernova distance scale have resulted from recent dedicated, ground-based supernova search and follow-up programs yielding CCD light curves for nearby supernovae (e.g., Hamuy et al. 1996; Jha et al. 2006; Contreras et al. 2010). Sandage and collaborators undertook a major program with HST to find Cepheids in nearby galaxies that have been host to Type Ia supernovae (Sandage et al. 1996, Saha et al. 1999), and thereby provided the first Cepheid zero-point calibration, which has recently been followed up by Macri et al. (2006) and Riess et al. (2009a, b).
For Hubble constant determinations, the challenge in using SNe Ia remains that few galaxies in which SN Ia events have been observed are also close enough for Cepheid distances to be measured. Hence, the calibration of the SN Ia distance scale is still subject to small-number statistical uncertainties. At present, the numbers of galaxies for which there are high-quality Cepheid and SN Ia measurements (in most cases made with the same telescopes and instruments as the Hubble flow set) is limited to six objects (Riess et al. 2009a).
3.6.1. UNDERLYING THEORY SNe Ia result from the thermonuclear runaway explosions of stars. From observations alone, the presence of SNe Ia in elliptical galaxies suggests that they do not come from massive stars. Many details of the explosion are not yet well understood, but the generally accepted view is that of an carbon-oxygen, electron-degenerate, nearly-Chandrasekhar-mass white dwarf orbiting in a binary system with a close companion (Whelan & Iben 1973). As material from the Roche lobe of the companion is deposited onto the white dwarf, the pressure and temperature of the core of the white dwarf increases until explosive burning of carbon and oxygen is triggered. An alternative model is that of a "double degenerate" system (merger with another white dwarf). Although on observational grounds, there appear to be too few white dwarf pairs, this issue has not been conclusively resolved. A review of the physical nature of SNe Ia can be found in Hillebrandt & Niemeyer (2000).
A defining characteristic of observed SNe Ia is the lack of hydrogen and helium in their spectra. It is presumed that the orbiting companion is transferring hydrogen- and helium-rich material onto the white dwarf; however, despite extensive searches this hydrogen or helium has never been detected, and it remains a mystery as to how such mass transfer could take place with no visible signature. It is not yet established whether this is a problem of observational detection, or whether these elements are lost from the system before the explosion occurs.
Various models for SN Ia explosions have been investigated. The most favored model is one in which a subsonic deflagration flame is ignited, which subsequently results in a supersonic detonation wave (a delayed detonation). The actual mechanism that triggers a SN Ia explosion is not well understood: successfully initiating a detonation in a CO white dwarf remains extremely challenging. In recent years, modeling in 3D has begun, given indications from spectropolarimetry that the explosions are not spherically symmetric. The radiative transport calculations for exploding white dwarf stars are complex. However, there is general consensus that the observed (exponential shape of the) light curves of SNe Ia are powered by the radioactive decay of 56Co to 56Fe. The range of observed supernova peak brightnesses appears to be due to a range in 56Ni produced. However, the origin of the peak magnitude - decline rate is still not well understood.
Despite the lack of a solid theoretical understanding of SNe Ia, empirically they remain one of the best-tested, lowest-dispersion, and highest-precision means of measuring relative distances out into the smooth Hubble flow.
3.6.2. RECENT RESULTS FOR SNe Ia AND Ho The most recent calibration of SNe Ia has come from Riess et al. 2009a, b from a new calibration of six Cepheid distances to nearby well-observed supernovae using the Advanced Camera for Surveys (ACS) and the Near-Infrared Camera and Multi-Object Spectrometer (NICMOS) on HST. Riess et al. have just completed a program to discover Cepheids in nearby galaxies known to have been hosts to relatively recent Type Ia supernovae and then re-observed them in the near infrared. In so doing, the number of high-quality calibrators for the supernova distance scale more than doubled, putting the calibration for SNe Ia on a far more secure foundation. The six Cepheid-calibrated supernovae include SN 1981B in NGC 4536, SN 1990N in NGC 4639, SN 1998aq in NGC 3982, SN 1994ae in NGC 3370, SN 1995al in NGC 3021 and finally SN 2002fk in NGC 1309. A comparison of Cepheid and SNe Ia distances from Riess et al. (2009a) is shown in Figure 8. The supernovae were chosen to meet rather stringent criteria, requiring, for example that they all were observed with modern detectors, that they were observed before maximum light, their spectra were not atypical and that their estimated reddenings were low. Each galaxy had between 13 and 26 Cepheids observed at random phases in the H-band (F160W filter) (and were transformed to mean light using optical data) using NICMOS onboard HST. Extinction in the H-band is down by a factor of five relative to the optical. The program avoids issues of cross-instrumental calibration by observing with a single telescope for the calibration galaxy, NGC 4258, out to the SNe Ia galaxies. By extending to the near-infrared, these observations of the newly discovered Cepheids directly address the systematic effects of metallicity and reddening.
 |
Figure 8. A comparison of Cepheid and SNe Ia distances (red points), as described in Riess et al. (2009a). The calibrating galaxy, NGC 4258, is added in blue. |
We show in Figure 9, the Hubble diagram for 240 supernovae at z < 0.1 from Hicken et al. (2009), which have been calibrated by Riess et al. (2009a) based on the distance to the maser galaxy, NGC 4258. Riess et al. quote a value of Ho = 74.2 ± 3.6 km s-1 Mpc-1 combining systematic and statistical errors into one number, a value in excellent agreement with that from the Key Project (see next section), which is calibrated using the Galactic Cepheid parallax sample. At the current time, there is not much need for larger, low-redshift samples, since the dominant remaining uncertainties are systematic, rather than statistical. Recent studies (e.g., Wood-Vasey et al. 2008; Folatelli et al. 2009) confirm that supernovae are better standard candles at near-infrared (JHK) wavelengths and minimize the uncertainties due to reddening.
 |
Figure 9. Supernova Hubble diagram based on 240 supernovae with z < 0.1. The sample is from Hicken et al. (2009), and have been used by Riess et al. (2009a) for their determination of Ho. |
Tammann, Sandage &
Reindl (2008)
have undertaken a recent
re-calibration of supernovae, as well as a comparison of the Cepheid,
RR Lyrae and TRGB distance scales. In contrast, they find a value of
Ho = 62.3 ± 4.0 km/s/Mpc, where the quoted
(systematic)
error includes their estimated uncertainties in both the Cepheid and
TRGB calibration zero points. Their quoted error is dominated by the
systematic uncertainties in the Cepheid zero point and the small
number of supernova calibrators, both of which are estimated by them
to be at the 3-4% level; however, the Ho values differ by more
than 2- . A discussion of
the reason for the differences in these analyses can be found in
Riess et al. (2009a,
b):
these include
the use of more heavily reddened Galactic Cepheids, the use of less
accurate photographic data and a calibration involving multiple
telescope/instruments for supernovae by Tammann, Sandage & Reindl.
. A discussion of
the reason for the differences in these analyses can be found in
Riess et al. (2009a,
b):
these include
the use of more heavily reddened Galactic Cepheids, the use of less
accurate photographic data and a calibration involving multiple
telescope/instruments for supernovae by Tammann, Sandage & Reindl.
 2
scaled fit gives a true distance modulus (intercept) of 18.40 ±
0.01 mag, uncorrected for metallicity, and a total line-of-sight color
excess (slope) of E(B - V) = 0.10 mag.
2
scaled fit gives a true distance modulus (intercept) of 18.40 ±
0.01 mag, uncorrected for metallicity, and a total line-of-sight color
excess (slope) of E(B - V) = 0.10 mag.