


In 1943, aided by the blackout in Pasadena caused by the second world war, Baade for the first time was able to resolve M31 and its companions into individual stars (Baade 1944). Realizing that the stellar populations in NGC 205 and M32 are similar to the stars in globular clusters in our Galaxy, Baade recognized that stellar populations fall into 2 groups: Population I stars, which look like the stars in the solar neighborhood, and Population II stars, which are similar to those in globular clusters. Characteristic for Population I are high luminosity O and B stars, as well as open clusters. Characteristic for Population II are short-period Cepheids. Early-type galaxies, according to him, only contained Population II, while in late and intermediate-type galaxies a mix of both populations was found. Only much later on (in the 1970 and 1980's by Whitford (1978), Whitford & Rich (1983), Rich (1988), Terndrup (1988), etc. ) it was found that these stars were very different, with bulge stars being metal rich, while halo stars are very metal poor. Both populations, on the other hand, have in common that they do not contain any blue giant stars.
At present, we think that our Galaxy contains several components: the rotating (thin) disk with population I stars, the thick disk (Gilmore & Reid 1983), the stellar halo and the Galactic bulge. In the halo several globular clusters are found. Some others have properties more like the thin disk and are therefore called disk globular clusters (Zinn & West 1984).
We are in the lucky situation that now with the Hubble Space Telescope we can imitate Baade's observations for galaxies up to about 10 Mpc, i.e. a factor 50 further away. The Hubble Legacy Archive (http://hla.stsci.edu/) offers fantastic images enabling everybody to observe galaxies at a resolution which is a factor 10 better than one can get from the ground. As was the case for me, when I was an undergraduate student in Leiden in the 1980's when I studied the Palomar Sky plates: it is extremely instructive to look at images of the Universe. For example, by simply studying maps of galaxy clusters such as Virgo or Coma one gets a very good idea of the morphology-density relation. I will show here the galaxy M51 at 8 Mpc. Taking the composite F814W/F555W/F435W image one clearly sees the spiral arms, the dust lanes, the position of star forming regions close to the dust lanes, etc. (Fig. 1.2). Zooming in into the area marked with a red cross one sees a large star forming complex in the spiral arm (Fig. 1.2 (right)), together with many small and large dust lanes. Zooming in one step further into the star forming complex (Fig. 1.3 (left)) one sees the red and blue (super)giants individually resolved. The stellar populations here are similar to a young open cluster, containing both young and old stars. Outside the spiral arm (Fig. 1.3 (right)) fewer stars are being seen. The brightest stars have disappeared, both the blue and the red ones, and the stellar population appears to be much more uniform that in the spiral arm. Here one barely resolves the brightest red giants of a stellar population, which looks similar to Population II.
 |
Figure 1.2. Left: Composite HST F814W/F555W/F435W image of M51 (from the Hubble Legacy Archive). Right: Zoom at the position of the cursor, showing the stellar populations around a spiral arm. |
A factor of 2 in distance further from us, we can still resolve individual stars with the Hubble Space Telescope. In the Coma cluster, however, another factor of 6 further away, this is not possible any more. Here information about individual stars can still be obtained using surface brightness fluctuations (see subsection 1.4.8), analyzing the statistics of the light in individual pixels. When going even further away the only way to derive information about stellar populations in galaxies is by analyzing the integrated light. In most of this paper we will discuss ways to do this, and the results that are obtained.
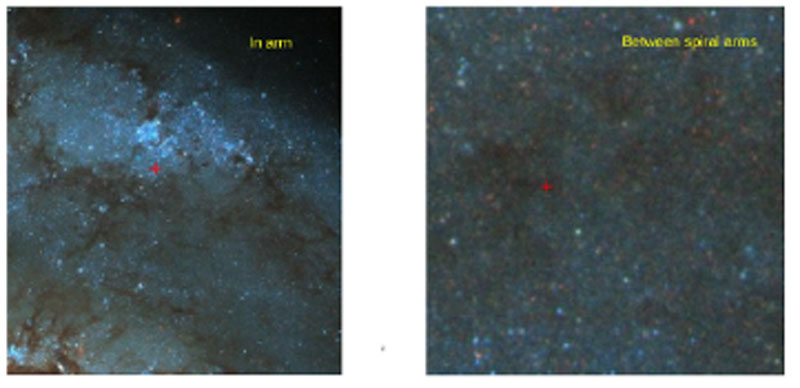 |
Figure 1.3. Magnifications of Fig. 1.2 in (left) and out of the spiral arm (right). Note the enormous difference in resolved stellar populations. |