


This section reviews the processes of secular evolution in disk galaxies and the structures that they produce. I begin with bar-driven evolution but also discuss why evolution happens in more than just barred galaxies. Much emphasis will be on the high-density central parts of galaxies that in the past were confused with merger-built bulges. As explained in Section 1.3, I call such components "pseudobulges" if – to the best of our knowledge – they were not made by mergers but rather were grown out of the disk.
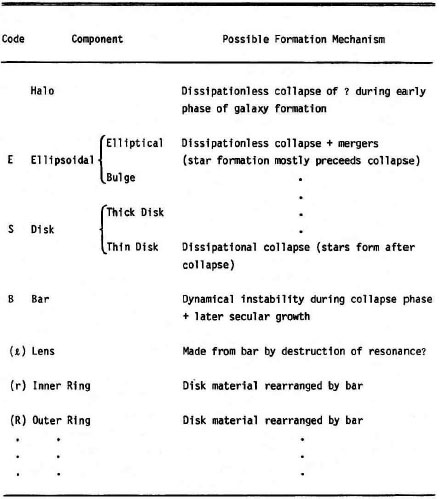
The essential qualitative results of secular evolution were known more than 30 years ago at the time of my Saas-Fee lectures (Kormendy 1982b). From that review, Table 2 here lists the major structural components in galaxies and what we then thought we knew about their origin. All of the suggested formation mechanisms are strongly supported by more recent work and form the main subjects of these lectures. The only change that I have made in reproducing Table 2 is to remove a suggestion that the transition from ellipticals and bulges to thick and thin disks is continuous. The only change in emphasis that I would make in reformulating the table now would be to emphasize major mergers as the origin of classical bulges and ellipticals and note that dissipation and starbursts occur naturally in wet mergers.
 |
To bring this story up to date, let's start by revisiting the definition of a classical bulge. The clearest statement that captures the intention of morphologists such as Sandage and de Vaucouleurs is by Alvio Renzini (1999): "A bulge is nothing more nor less than an elliptical galaxy that happens to live in the middle of a disk." There is a world of information hidden in this beguilingly simple defintion:
First, what is an elliptical? Formally, this subject is beyond the scope of these lectures. We understand that ellipticals form by major galaxy mergers and not by secular processes. Still, we cannot understand pseudobulges without knowing something about classical bulges and ellipticals. Moreover, some lecturers at this school (notably Isaac Shlosman and Nick Scoville) focus on our standard picture of the evolution of structure by hierarchical clustering and galaxy mergers. I try to connect this story with our picture of secular evolution in Section 8. Some properties of elliptical galaxies and classical bulges are compared in Section 7. Here, I list the properties that we need in the present section. Classical bulges and elliptical galaxies
 n
4 for most bulges
(e. g.,
Fisher & Drory
2008);
n
4 for most bulges
(e. g.,
Fisher & Drory
2008);
Point (c) is the most important, because some of (a), (b) and (d) are shared by other kinds of ellipsoidal stellar systems called "spheroidals" (Section 7).
I adopt the Renzini definition, because it embodies the idea that I want to emphasize, namely that the definition of a component should be made in terms of its formation physics as well as its observed properties.
The problem with our definition is that it is difficult to apply,
especially to galaxies that are not seen edge-on. Therefore it is
common to use one of two surrogate definitions as illustrated in
Fig. 21. When a galaxy disk is seen nearly
edge-on (e. g., NGC 4594,
at center), then the part of the galaxy that is like an elliptical
(e. g., M 87, at left) is the high-surface-brightness, centrally
concentrated component that is thicker than the disk. When the galaxy is
seen nearly face-on, we cannot see such a central thickening. But we
know from galaxies like NGC 4594 that the brightness profile of the
bulge is much steeper than that of the disk and extends, near the
center, to much higher surface brightnesses than those of the disk.
NGC 1353 in Fig. 21 shows a
clear separation between the
high-surface-brightness central (pseudo)bulge and the outer exponential
disk. It also illustrates how we decompose the surface brightness
profile of a face-on galaxy into bulge and disk parts that add up to the
observed profile. Bulge-disk decomposition is discussed in
Section 7.4.1. Here, I note the
surrogate definition of a bulge that is used
when a galaxy is seen nearly face-on: it is the central part of the
galaxy that is defined by the extra light above the inward extrapolation
of the outer, exponential or Sérsic disk profile. That is, the
bulge-dominated part of NGC 1353 is the part at r
10". It
happens to be a pseudobulge rather than a classical bulge, but this does
not affect the surrogate definition.
 |
Figure 21. Illustrating the surrogate definitions of a bulge: M 87 is a giant elliptical, and NGC 4594 is a classical-bulge-dominated Sa galaxy seen almost edge-on. These are Hubble Heritage images. The right panel shows the surface brightness profile along the major axis of the Sb galaxy NGC 1353; we use it again in Fig. 33. It is decomposed into an outer exponential disk profile and an inner (it will turn out: pseudobulge) profile with a Sérsic index of n = 1.3 ± 0.3. |
The good news is that classifying bulges by using the surrogate definitions is easy. The bad news is that we don't know what they are physically. That is, there is no guarantee that the surrogate definitions always identify central components that originate via the same formation physics. In fact, I will try to convince you in this section that the surrogate definitions often identify high-surface-brightness central components that are nothing like ellipticals, especially in late-type galaxies.
Therefore, I adopt a different approach that is more physically motivated but also more hazardous (Kormendy & Kennicutt 2004). I define classical bulges to be elliptical galaxies that happen to live in the middle of a disk. For this to make sense physically, we need to check that there exist central components of disk galaxies that have essentially all of the properties of comparable-luminosity elliptical galaxies. This check has been made; it is discussed in Sections 7.4.4 and 8.1. The intention is that classical bulges, like ellipticals, form via major galaxy mergers. In contrast, I define a pseudobulge as the dense central part of a galaxy – either a thick component that bulges above and below an edge-on disk or the extra light at small radii above the inward extrapolation of the outer disk profile – that was constructed from the disk by (mostly) secular processes. For this definition to make sense, we need to see convincing evidence that secular disk evolution happens and that it makes pseudobulges that we know how to identify. We have such evidence; the classification criteria are listed in Section 5.3. There turn out to be three generic kinds of pseudobulges (Fig. 22).
 |
Figure 22. Powerpoint slide illustrating three kinds of pseudobulges. Section 5.2.9 discusses boxy pseudobulges as vertically buckled bars. Construction of disky pseudobulges is discussed here. For nuclear bars, see Section 5.2.8. |
These definitions involve different practical problems. We always know what we are talking about physically. But it may be difficult to apply the classification criteria. I prefer this problem to the ones above that are inherent in a descriptive classification. My job in the rest of this section is to present the case for a physically motivated definition of pseudobulges.
Figure 23 shows the fundamental results of bar-driven secular evolution. The disk spreads (Section 2). Gas at large radii gains angular momentum; it moves to still larger radii and is shepherded into an outer ring near OLR. This is identified with the outer rings in (R)SB galaxies (Fig. 24). Gas at small radii gives up some of its angular momentum and falls to the center. High-density gas likes to make stars; we see starbursts in Figs. 29 – 31. We identify the result as a pseudobulge. In between, gas is focused into a ring around the end of the bar, the inner ring seen in SB(r) galaxies (Fig. 24).
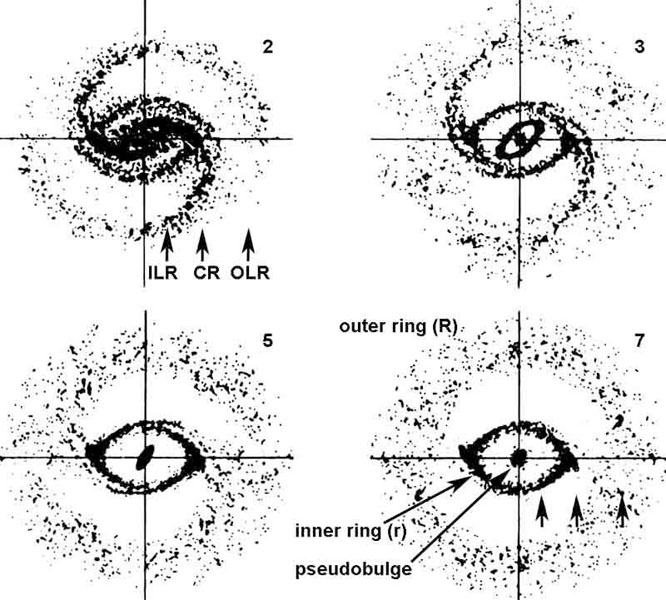 |
Figure 23. Gas particle distributions in a "sticky particle" simulation of the response of cold gas to a rotating bar. The bar is not shown but, in each panel, is horizontal and has a diameter equal to that of the inner ring in the last panel. The panels show the gas response after 2, 3, 5 and 7 bar rotations (numbers at upper-right in each panel). The arrows in the first and last panels indicate the position of the inner Lindblad resonance (ILR), the corotation resonance (CR) and the outer Lindblad resonance (OLR). From Simkin et al. (1980). |
Figure 24 shows the close correspondence between the features produced in the Simkin et al. (1980) simulation and the morphology of barred galaxies. More sophisticated hydrodynamic calculations clarify the physics (Fig. 26), but it is remarkable that just letting gas particles stick together when they collide is enough to reach the most basic conclusions.
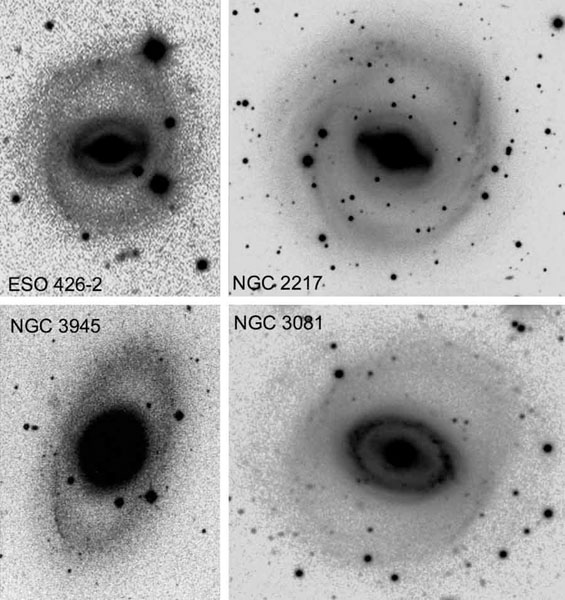 |
Figure 24. Examples of galaxies which show the morphological features that were produced in the sticky particle simulation of Simkin et al. (1980). NGC 3945 is from a photographic plate that I took with the Mount Wilson 100-inch telescope; the others are from the de Vaucouleurs Atlas of Galaxies (Buta et al. 2007). All four galaxies have complete or almost complete outer rings (R). ESO 426-2 and NGC 3081 have both an outer ring and an inner ring (r); such galaxies are rare. NGC 2217 contains a lens component that is filled by the bar in one dimension. NGC 3945 and NGC 3081 are also illustrated in Fig. 17. Additional galaxies with similar morphology are shown in Figs. 3, 6, 8, 9, 17, 36, 37 and 45. |
Figure 25 explores the difference between SB(r) and SB(s) galaxies. Sanders & Tubbs (1980) investigated how the response of gas to a bar varies with bar pattern speed and strength. Fast bars have small corotation radii; e. g., rcor/(disk scale length) = 0.7 in the bottom-left model panel. They drive SB(s) structure like that in NGC 1300. Slower bars end near corotation (rcor / a = 1.1) and drive SB(r) structure like that in NGC 2523. Since bars slow down as they evolve (Fig. 13) and since it takes time to collect gas into an inner ring, we conclude that SB(s) galaxies are dynamically young and that SB(r) galaxies are dynamically mature.
 |
Figure 25. Contours of steady-state gas density in response to a bar (adapted from Sanders & Tubbs 1980, who also show intermediate cases). The bar is horizontal and has a length equal to four axis tick marks. The top row explores the effect of varying the ratio MB / MD of bar mass to disk mass. The second row varies the bar axial ratio b / a. The third row varies the bar pattern speed, parametrized by the ratio rcor / a of the corotation radius to the disk scale length. The middle column is the same standard model in each row; it resembles the SB(r) galaxy NGC 2523. The left panels resemble the SB(s) galaxy NGC 1300. The right panels take the parameters to unrealistic extremes; they do not resemble real galaxies. |
Consistent with this conclusion is the observation (Sandage 1975) that dust lanes on the rotationally leading sides of bars are common in SB(s) galaxies but rare in SB(r) galaxies (cf. Figs. 6, 24, 25). The gas between the inner ring and the pseudobulge has largely been depleted in SB(r) galaxies (see Kormendy & Barentine 2010: Fig. 46 here and Barentine & Kormendy 2012 for examples).
Sanders & Tubbs (1980) also investigated the effects of varying the strength of the imposed bar potential, measured both by the ratio of bar mass to disk mass MB / MD (top row of simulation results in Fig. 25) and by the axial ratio b / a of the bar (middle row of simulation results). Very weak bars (MB / MD = 0.13) or bars that are not very elongated (b / a = 1/2, more like an oval disk than like a bar) produced weak SB(s) structure that does not resemble well developed SB(s) galaxies such as NGC 1300. Parameters that are more realistic in matching strongly barred galaxies (MB / MD = 0.53, b / a = 1.4, and rcor / a = 1.1; i. e., the standard model shown in the middle column of model results) provided the best match to an SB(r) galaxy. This model shows a linear maximum in gas density that is parallel to the bar and offset from it in the forward rotation direction like the straight dust lanes in SB(s) galaxies. But the bar potential and gas content are imposed by the initial conditions; they are not self-consistently evolved from more axisymmetric initial conditions. This accounts for the (rarely observed) coexistence of the offset gas density maximum in the bar and the (r) structure. Finally, note that, when the bar is much stronger than bars in real galaxies (MB / MD = 2.7) or much slower than in real galaxies (rcor / a = 3), the gas response fails to resemble that in observed galaxies.
Better simulations generally confirm and expand on the above conclusions (e. g., Salo et al. 1999; Rautiainen & Salo 2000; Rautiainen et al. 2005; Treuthardt et al. 2009; see Kormendy & Kennicutt 2004 for further review). In particular, detailed hydrodynamic models of the gas response in the region of the bar confirm the offset density maximum seen in the Sanders & Tubbs (1980) model and greatly clarify the nature of bar-driven secular evolution.
The most illuminating simulations are by Athanassoula (1992), shown here in Fig. 26. She explored the response of inviscid gas to an imposed bar, concentrating on the production of gas shocks and their relation to dust lanes. If the mass distribution is sufficiently centrally concentrated to result in an ILR, then she found that straight gas shocks – which we identify with dust lanes – are produced that are offset in the forward (rotation) direction from the ridge line of the bar. The "x2 orbits" that align perpendicular to the bar inside ILR push the offset to be largest near the center. This is seen in Fig. 26 and Fig. 27 as well as in Fig. 5 and Fig. 6.
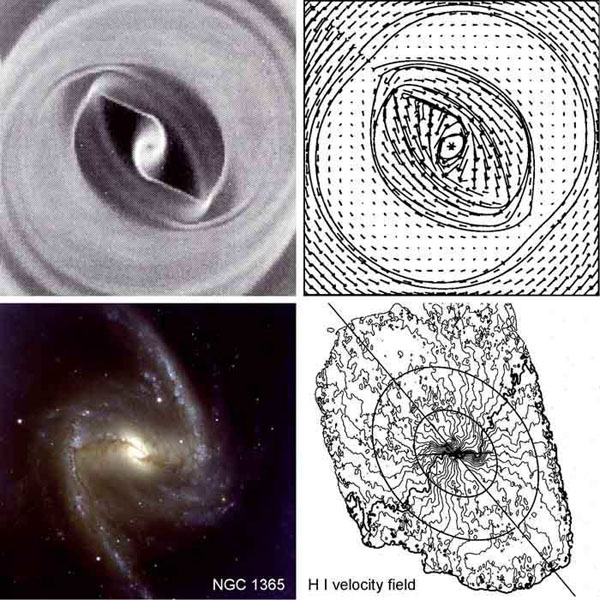 |
Figure 26. Comparison of the gas response to a bar (Athanassoula 1992 model 1) with NGC 1365. The galaxy image is from the VLT and is reproduced courtesy of ESO. In the models, the bar potential is oriented at -45° to the vertical, parallel to the lowest-density (dark) part of the gas density grayscale distribution at upper-left. The bar axial ratio is 0.4 and its length is approximately half of the box diagonal. The top-right panel shows the velocity field; arrow lengths are proportional to flow velocities. Discontinuities in gas velocity indicate shocks at the narrow ridge lines of high gas density in the upper-left panel. High gas densities are identified with dust lanes in real galaxies. The model correctly reproduces the observations that dust lanes are offset in the forward rotation direction from the ridge line of the bar, that they are offset by larger amounts nearer the center, and that very near the center, they curve and become nearly azimuthal. The bottom-right panel shows the H i velocity field of NGC 1365 from Lindblad et al. (1996). The contour interval is 20 km s-1. The velocity contours crowd strongly in the dust lanes shown at lower-left (the scales of the two panels are slightly different). This supports the interpretation that the dust lanes are signatures of shocks in the gas velocity field. Shocks are signs that the gas loses energy. It must fall toward the center. In fact, NGC 1365 has high gas densities and active star formation in its bright center (Lindblad 1999; Curran et al. 2001a, b). Adapted from Fig. 7 of Kormendy & Kennicutt (2004). |
The consequence of shocks is that they inevitably imply that gas flows toward the center. Because the shocks are nearly radial, gas impacts them at a steep angle. Therefore the velocity that is lost in the shock is mainly rotational. This robs the gas of energy and forces it to fall toward the center.
Important confirmation of these results is provided by the observation that H i gas velocity contours crowd closely just where we observe dust lanes in optical images (e. g., NGC 1365 in Fig. 26 and NGC 1530 in Fig. 27). The H i observations do not have high enough spatial resolution to prove that a shock must be present, but the rapid change in the velocity field coincident with the dust lane strongly supports the above evolution picture.
 |
Figure 27. NGC 1530 is another excellent example of the crowding of H i velocity contours at the position of the dust lane in an SBb galaxy. The image is from http://www.caelumobservatory.com/gallery/n1530.shtml courtesy of Adam Block. The velocity field is from Regan et al. (1997) courtesy of Michael Regan. |
It is easy to get a heuristic understanding of the gas velocity field shown in Fig. 26. Gravitational torques produced by the bar accelerate the gas as it approaches the bar. As a result, it climbs to larger radii as it crosses the ridge line of the bar. Then, as it leaves the bar, the bar potential minimum is behind the gas and decelerates it. Incoming gas overshoots a little before it plows into the departing gas, so the shocks are nearly radial but offset from the ridge line of the bar in the rotationally forward direction.
Do observations show central concentrations of gas in barred galaxies and in other galaxies (e. g., oval disks) in which the above secular evolution is expected to happen? And do they not show such central gas concentrations in the absence of engines for secular evolution? Figure 28 provides six examples of the general result that the answer is "yes".
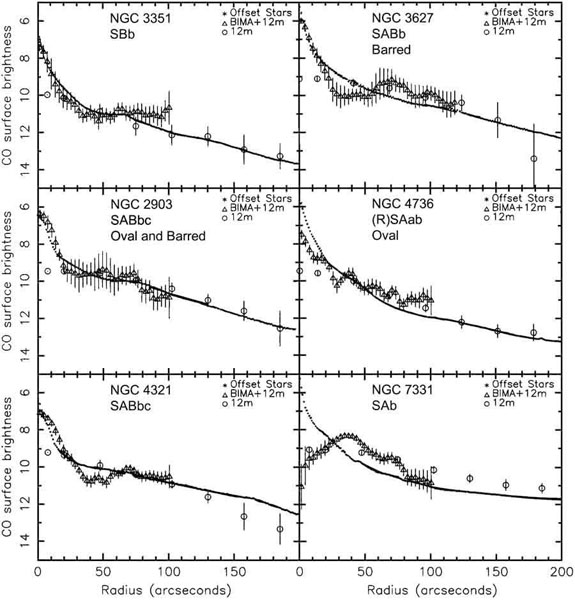 |
Figure 28. Radial profiles of CO gas and stellar K-band surface brightness from the BIMA SONG (Fig. 20 from Kormendy & Kennicutt 2004, adapted from Regan et al. 2001). CO surface brightness is in magnitudes of Jy km s-1 arcsec-2 with zeropoint at 1000 Jy km s-1 arcsec-2. The stellar surface brightness profiles have been shifted vertically to the CO profiles. Morphological types are from the RC3 (de Vaucouleurs et al. 1991) and oval disks are identified in Kormendy & Kennicutt (2004). NGC 4736 is a prototypical pseudobulge also illustrated in Figs. 3, 6 and 8. All galaxies in this figure except NGC 7331 have structures that are expected to cause gas to flow toward the center. NGC 7331 is included to show the very different CO profile in a galaxy with a probable classical bulge (cf. Fig. 29). |
What happens to the infalling gas? Concentrated into a small volume, it gets very dense. Crunching gas likes to make stars. The Schmidt (1959) – Kennicutt (1989, 1998a, 1998b) law that star formation rates increase faster than linearly with gas density makes this explicit (Fig. 32 here). Confirming our expectations, observations point to enhanced star formation, often in spectacular starbursts, near the centers of barred and oval galaxies. In particular, Spitzer Space Telescope mid-infrared observations in the 24 μm bandpass are sensitive to warm dust that reradiates light from hot young stars (Fig. 29). Survey results by Fisher (2006) and Fisher et al. (2009) show ubiquitous central star formation in medium- and late-type barred and oval galaxies but not in galaxies with classical bulges (Fig. 29).
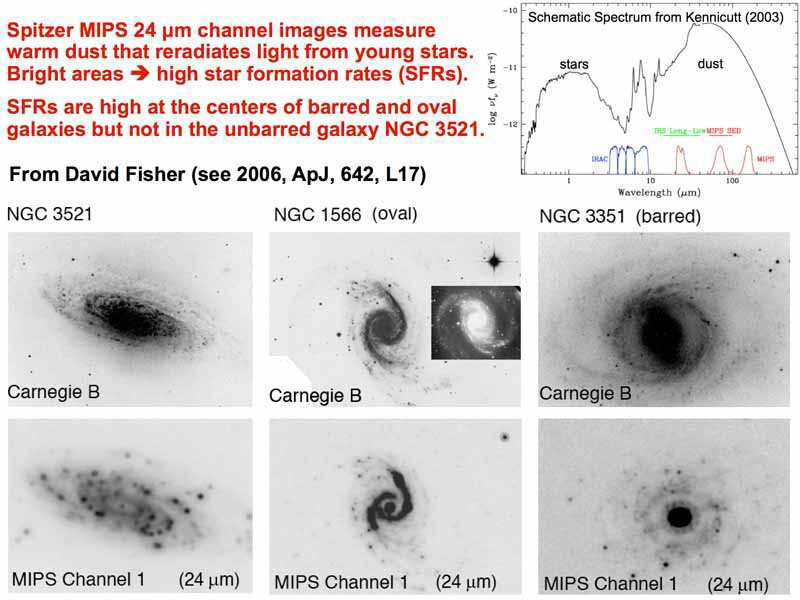 |
Figure 29. Powerpoint slide showing typical high central star formation rates (SFRs) in galaxies that contain driving agents for secular evolution (bars and oval disks) but not in galaxies that contain no driving agent (NGC 3521). A schematic galaxy spectrum (top right, from Kennicutt 2003) shows the separate, roughly black body spectra of stellar populations in galaxies ("stars") and of warm dust ("dust"). The Spitzer Space Telescope MIPS 24 μm bandpass is sensitive to dust that reradiates light from young stars. Thus SFRs are high where galaxies are bright at 24 μm. The upper row of images from the Carnegie Atlas of Galaxies (Sandage & Bedke 1994) show typical galaxies in B band. The bottom row of Spitzer 24 μm images show high central SFRs in the pseudobulges of NGC 1566 and NGC 3351 but not in the classical bulge of NGC 3521. This figure appears courtesy of David B. Fisher. |
More detailed views of this star formation are shown in Figs. 30 and 31. Figure 30 shows NGC 5236, a particularly close and well known example. The dust lanes on the rotationally trailing sides of the spiral arms are believed to have the same cause as the ones on the leading sides of the bar: they trace shocks where the gas enters the spiral arms. Star formation is triggered there by gas compression. Since Ω > Ωp, the gas moves forward, beyond the shock, during the time that it takes stars to form. As a result, the ridge line of bright young stars and H ii regions that "are strung out like pearls along the arms" (Baade 1963) is offset forward of the dust lanes. Our picture of how spiral density waves stimulate star formation and hence are traced by young stars is discussed in Roberts (1969); Dixon (1971); Shu et al. (1973) and Roberts et al. (1975) and is reviewed in Toomre (1977b).
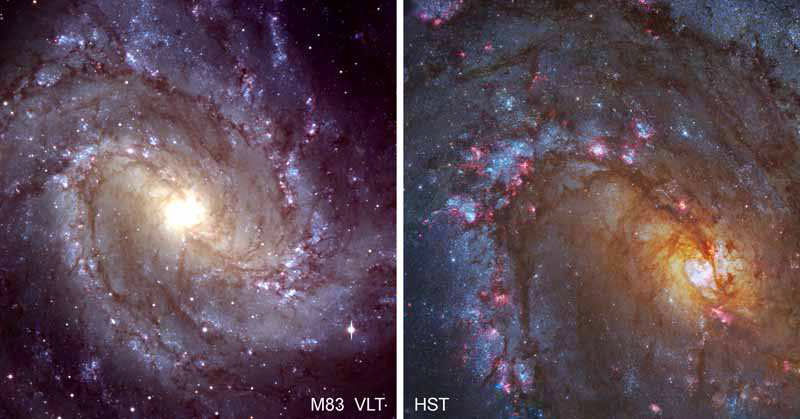 |
Figure 30. M 83 = NGC 5236 is a prototypical face-on SAB(s)c galaxy with dust lanes on the trailing sides of the spiral arms and the leading sides of the bar. The center is undergoing a spectacular starburst. The left image is from the ESO VLT (http://www.eso.org/public/images/eso9949a/ with color balance tweaked to better match the enlargement at right, which is a Hubble Heritage image). |
Returning to bar-driven inward gas transport and its consequences, the central regions of NGC 5236 are dominated by intense star formation (Harris et al. 2001; Knapen et al. 2010). Similarly, the whole of the central region of NGC 1365 (Fig. 26) is undergoing a starburst (Kristen et al. 1997; Galliano et al. 2008; Elmegreen et al. 2009) A less intense but still prototypical example is NGC 1300 (Fig. 6; Knapen et al. 2006; Comerón et al. 2010).
Spiral galaxies in which there is no significant ILR and in which the spiral structure extends to the center can also have central starbursts (for example, NGC 4321, Knapen et al. 1995a, b; Sakamoto et al. 1995).
Nuclear starburst rings are particularly compelling examples of the star formation that – we suggest – results from inward transport of disk gas. Figure 31 shows examples. Three of these galaxies are barred, but NGC 4736 is in my prototypical unbarred, oval galaxy (Figs. 3, 6, 8). It emphasizes again that numerical simulations and observations both imply that oval galaxies evolve secularly in the same way that barred galaxies do.
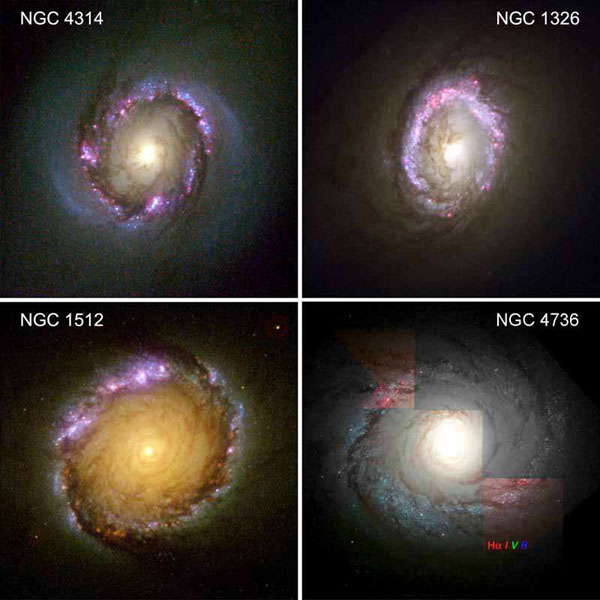 |
Figure 31. Nuclear star-forming rings in barred and oval galaxies (update of Fig. 8 in Kormendy & Kennicutt 2004). Sources: NGC 4314 – Benedict et al. (2002); NGC 1326 – Buta et al. (2000) and Zolt Levay (STScI); NGC 1512 – Maoz et al. (2001); NGC 4736 – Zolt Levay (STScI). The NGC 4736 panel was made from nonoverlapping images in the bandpasses indicated by the colors used in these RGB renditions. All colors are available in only two places around the ring, but they make it clear that this star-forming ring in a prototypical oval galaxy (see Figs. 3, 6 and 8) is closely similar to the other nuclear rings, which occur in barred galaxies. Note that these nuclear rings are distinct from and always smaller than the inner rings that encircle bars (see point (f) in Section 3.1). |
The star formation discussed in this section is not associated with galaxy mergers and instead is closely connected with probable engines for secular evolution and with observed features (such as radial dust lanes in bars) which suggest that such evolution is in progress. We conclude with some confidence that it is building pseudobulges. Are the gas supplies and star formation rates (SFRs) consistent with reasonable growth times for pseudobulges of the observed masses?
Kormendy & Kennicutt (2004) address this for nuclear star-forming rings (Fig. 32). The rings have larger SFR densities ΣSFR and total gas densities Σgas than do spiral galaxies in general, defining a Schmidt-Kennicutt relation similar to the well known ΣSFR ∝ Σgas1.4. Absent continued gas infall, the currently available gas would be consumed in ~ 0.2 – 2 Gyr. However, I have argued that the central gas is continually replenished. Thus the observed SFRs of 0.1 – 10 M⊙ yr-1 are consistent with the formation of pseudobulges with masses ~ 108 – 1010 M⊙ over several Gyr. These values are reasonable.
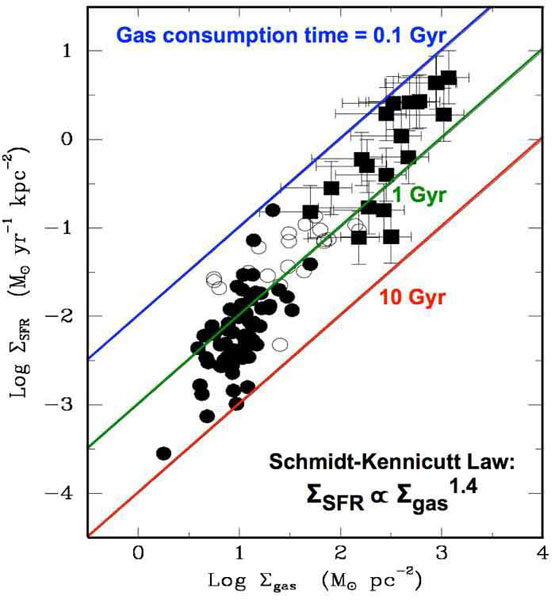 |
Figure 32. Correlation between SFR surface density and total gas surface density for circumnuclear star-forming rings (filled squares) compared to disk-averaged values for spiral galaxies (filled circles) and the centers of these galaxies (open circles). The nuclear ring data are compiled in Kormendy & Kennicutt (2004, from which this figure is taken); the other data are from Kennicutt (1998b). Diagonal lines show gas consumption timescales if no additional gas is supplied to the central region. |
Fisher et al. (2009) and Fisher & Drory (2010) use the Spitzer Space Telescope to study SFRs and star formation histories in classical and pseudo bulges in detail. They conclude (2009) that "All bulges are found to be forming stars irrespective of bulge type (pseudobulge or classical bulge). [However,] classical bulges have the lowest specific SFR [SFR per unit stellar mass], implying growth times that are longer than a Hubble time, thus the present-day SFR does not likely play a major role in the evolution of classical bulges. [In contrast,] at present-day SFRs, the median pseudobulge could have grown the present-day stellar mass in 8 Gyr. In almost all galaxies in our sample, the specific SFR of the bulge is higher than that of the outer disk. This suggests that almost all galaxies are increasing their B / T through internal star formation. The SFRs in pseudobulges correlate with their structure. More massive pseudobulges have higher SFR density, this is consistent with the stellar mass being formed by moderate, extended star formation. Bulges in late-type galaxies have similar SFRs as pseudobulges in intermediate-type galaxies and are similar in radial size. However, they [have lower masses]; thus, they have much shorter growth times, ~ 2 Gyr. Our results are consistent with a scenario in which bulge growth via internal star formation is a natural and near ubiquitous phenomenon in disk galaxies."
I want to emphasize the contrast between star formation in major mergers
and star formation during secular evolution
(Kormendy &
Kennicutt 2004).
Merger starbursts last
a few
hundred million years. Most classical bulges and ellipticals are seen
long after the assembly events that constructed them. Therefore, they
are mostly seen to contain old stars. In contrast, secular evolution is
inherently long-term. Except in S0 pseudobulges, we usually see star
formation in action. If star formation is ubiquitous, it must be
secular. As a result, ongoing star formation that is not observed to
be associated with morphological indicators of a merger in progress
(such as tidal tails) is the first pseudobulge classification criterion
listed in Section 5.3.
We have a detailed picture of internal secular evolution in galaxy disks. Central molecular gas concentrations and starbursts are closely associated with bars and oval disks that act as evolution engines. They are not generally found in classical bulges. They are also closely associated with dust lanes and H I velocity crowding in bars that are signatures of secular evolution. These correlations argue in favor of internal secular evolution and against the idea that these features could be produced by large numbers of minor mergers.
5.2. The observed properties of pseudobulges
Quoting Kormendy & Kennicutt (2004): "How can we tell whether a (pseudo)bulge is like an elliptical or whether it formed secularly? The answer and the theme of this section is that pseudobulges retain enough memory of their disky origin so that the best examples are easily recognizable." As we move from "proof of concept" into work on large samples of galaxies, we will have to face the difficulty that classification gets difficult when – as we must expect – both a classical bulge and a subsequently grown pseudobulge are present. In such cases, bulge-pseudobulge decomposition is necessary (e. g., Erwin et al. 2003). In this section, I discuss the properties of more prototypical, pure pseudobulges to show how they differ from classical bulges and ellipticals. Section 5.3 then lists the classification criteria, numbered according to the subsections in the following discussion.
5.2.1. Pseudobulges of spiral galaxies show ongoing star formation
As noted in the previous section, ongoing central star formation in relatively normal spiral galaxies that show no signs of a merger in progress is a strong pseudobulge indicator. The work by Fisher et al. (2009, 2010) shows that such star formation is generally present in morphologically classified pseudo but not classical bulges. If star formation is ubiquitous, it must be secular.
5.2.2. Pseudobulges are flatter than classical bulges
This is a two-part criterion. First, when the galaxy is highly inclined and the ellipticity profile є(r) tells us the relative flattening of various components, pseudobulges are often (not always) seen to be flatter than classical bulges. Commonly a part of them is as flat as the associated outer disks. Second, pseudobulges in spiral (but not S0) galaxies usually show spiral structure all the way to the center of the galaxy. Classical bulges, like ellipticals, are essentially never flatter than є = 0.6 . They cannot show spiral structure. This classification criterion can be applied even to face-on galaxies.
The connection between pseudobulge flatness and secular evolution has been made since the earliest papers on this subject. Kormendy (1993b) describes the prototypical pseudobulge in NGC 4736 like this: "The central brightness profile is an r1/4 law that reaches the high central brightness characteristic of a bulge (Boroson 1981). However, the r1/4-law component shows a nuclear bar and spiral structure to within a few arcsec of the center. Bars are disk phenomena. More importantly, it is not possible to make spiral structure in a bulge. Thus the morphology already shows that the r1/4-law profile belongs to a disk. This is shown more quantitatively by [rapid rotation]", which is discussed here in Section 5.2.3.
The importance of spiral structure is further emphasized by Courteau et al. (1996): "Many of these [late-type] galaxies [in their sample] show spiral structure continuing into the central regions. ... We invoke secular dynamical evolution and gas inflow via angular momentum transfer and viscous transport" as the interpretation of the disky central structure.
Spectacular examples of disky pseudobulges often with spiral structure emerge from HST imaging surveys. The best known of these is by Carollo and collaborators (Carollo et al. 1997, 1998; Carollo & Stiavelli 1998; Carollo 1999; Carollo et al. 1999, 2002; Seigar et al. 2002). They refer to bulges that are structurally unlike ellipticals as "irregular bulges" and note that: "The widespread presence of star formation in the irregular bulges support scenarios in which a fraction of bulges form relatively late, in dissipative accretion events driven by the disk." Figures 33 and 34 show examples.
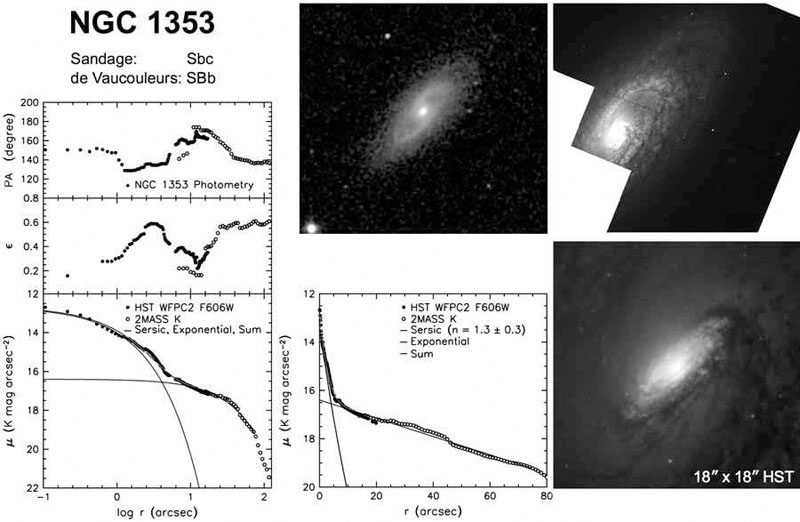 |
Figure 33. NGC 1353 pseudobulge: the images
show (left to right and top to bottom) the 2MASS JHK image with
a field of view of
4.4' × 4.4'
(Jarrett et al.
2003),
an HST WFPC2 F606W image
(Carollo et al.
1998),
and an 18" × 18" zoom of the F606W image.
The plots show surface photometry with the HST profile shifted
to the K band; μ is surface brightness, є is
ellipticity and PA is position angle. A bulge-disk decomposition of the
major-axis profile into a Sérsic function plus an exponential disk
(curves) shows that a "bulge" dominates at radii r
|
Figure 34 shows HST images of the central parts of Sa – Sbc galaxies. All show flat shapes, spiral structure, of patchy star formation. These are the central regions that, by the surrogate definitions, would be identified as the galaxies' bulges. It seems safe to conclude that no one who saw these images would define bulges as mini-ellipticals that live at the centers of disks.
 |
Figure 34. Sa – Sbc galaxies whose "bulges" have disk-like properties. Each panel shows an 18" × 18" region around the galaxy center extracted from HST WFPC2 F606W images taken and kindly provided by Carollo et al. (1998). North is up and east is at left. Intensity is proportional to the logarithm of the galaxy surface brightness. From Kormendy & Kennicutt (2004). |
5.2.3. Pseudobulges are more rotation-dominated than classical bulges
Pseudobulges were first recognized because rotation is more important with respect to random motions than it is in classical bulges. Via the Vmax / σ – є diagram (Fig. 35) for galaxies such as NGC 3945 and NGC 4736, Kormendy (1982a, b) concluded that some "SB bulges are more disklike than SA bulges" and: "a significant fraction of the bulge in many SB galaxies may consist of disk gas which has been transported to the center by the bar. As the gas accumulates, it forms stars and builds up a centrally concentrated stellar distribution which is photometrically like a bulge but dynamically like a disk." Again, the fundamental ideas about secular evolution have been with us for a long time. These results are brought up to date with more recent long-slit spectroscopy in Fig. 35. The result is that Vmax / σ is larger at a given є in pseudobulges (most filled symbols) than in classical bulges (open symbols) or in ellipticals (crosses).
 |
Figure 35. Relative importance of rotation and random velocity as a function of ellipticity є = (1 - axial ratio) for various kinds of stellar systems. Here Vmax / σ is the ratio of the maximum rotation velocity to the mean velocity dispersion interior to re. The "Oblate" line describes oblate-spheroidal systems that have isotropic velocity dispersions and that are flattened by rotation; it is a consequence of the tensor virial theorem (Binney & Tremaine 1987). From Kormendy & Fisher (2008). |
The disky dynamics of pseudobulges are beautifully illustrated by the
SAURON team's integral-field spectroscopy. This result is particularly
important, so Figs. 36 and
37 show three examples in detail. In
Fig. 36, the surface brightness profile tells
us the part of NGC 4274
that the surrogate definitions would identify as the bulge. It dominates
at r
10". The two-dimensional
kinematic and line-strength maps then show that, compared to the rest of
the inner parts of the galaxy, the component at r
10" rotates
more rapidly, has a lower
velocity dispersion, and has stronger H β absorption lines. The
latter result means that the central disky structure is made of younger
stars than the rest of the galaxy. As
Falcón-Barroso
et al. (2006)
and Peletier et al.
(2007a,
b;
2008)
note, all this is
very consistent with our picture of bar-driven secular evolution.
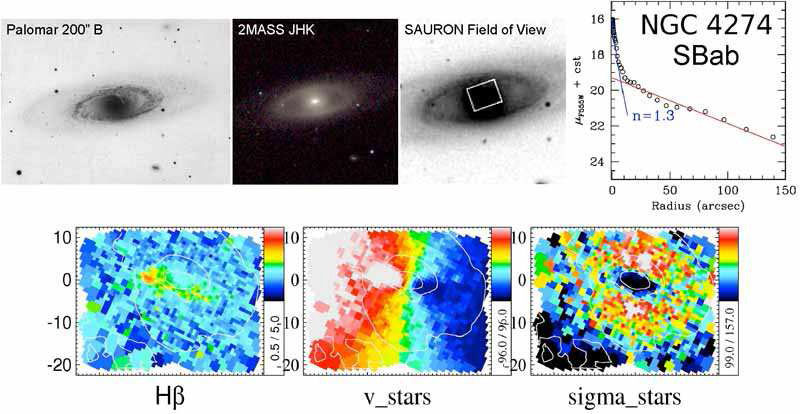 |
Figure 36. SAURON integral-field
spectroscopy of the disky pseudobulge of the Sa galaxy NGC 4274. The
galaxy is barred, but the bar is foreshortened, because it is oriented
nearly along the minor axis. It fills an inner ring, as is normal in
SB(r) galaxies
(Kormendy 1979b).
The brightness profile (upper-right) is decomposed into a
Sérsic (1968)
function plus an exponential
disk. The Sérsic function has n = 1.3, i. e., n <
2, as in other pseudobulges (Section 5.2.6). The
pseudobulge dominates the light at radii r
|
Figure 37 shows closely similar results for the SB galaxies NGC 3623 and NGC 5689. It is remarkable how clearly the central component is a rapidly rotating, cold disk in all three galaxies. The younger ages of the pseudobulges also supports our evolution picture. Note again that all three galaxies are barred.
 |
Figure 37. SAURON integral-field spectroscopy of the disky pseudobulges of the SB0 galaxy NGC 5689 and the SABa galaxy NGC 3623 (adapted from Falcón-Barroso et al. 2006). Again, both bars are oriented nearly along the minor axis. As in NGC 4274, the bar in NGC 3623 fills an inner ring. Also as in NGC 4274, the kinematic maps show that both galaxies contain pseudobulges that are prominently disky and more rapidly rotating (center), lower in velocity dispersion (right), and stronger in Hβ line strength (left) and hence younger than the rest of the inner galaxy. It is important to emphasize that pseudobulges generally show more than one (here: three) of the classification criteria listed in Section 5.3). |
5.2.4. Pseudobulges have small velocity dispersions for their luminosities
Pseudobulges have smaller σ than do classical bulges of the same MB (e. g., Kormendy & Illingworth 1983; Kormendy & Kennicutt 2004; Gadotti & Kauffmann 2009; cf. Falcón-Barroso et al. 2006; Peletier et al. 2007a). This could partly be due to low M / LB ratios resulting from young stars.
Fisher & Drory (2008) study the properties of (pseudo)bulges in 79, S0 – Sc galaxies to clarify our classification criteria. They show that, in general, different classification criteria agree in distinguishing pseudobulges from classical bulges. To do this work, they need first to classify bulges using purely morphological criteria (Fig. 38). This has the disadvantage that morphology alone cannot always identify pseudobulges in S0 galaxies. But it lets them study a large sample, and it allows a fair test of (for example) the already strong hint (see Kormendy & Kennicutt 2004) that the Sérsic indices of pseudobulges are smaller than those of classical bulges.
 |
Figure 38. Morphological features used by Fisher & Drory (2008; 2010) to classify bulges as classical or pseudo. Classical bulges have smooth, nearly featureless and nearly elliptical isophotes as do elliptical galaxies (NGC 3998, NGC 3031 = M 81). Pseudobulges show one or more of the following: nuclear bars, spiral structure, or patchy star formation (bottom four galaxies). From Fisher & Drory (2010). |
Fisher & Drory (2008) measure surface brightness profiles of their galaxies using Hubble Space Telescope (HST) archival images, their own large-field images from the McDonald Observatory 0.9 m telescope and images from archives such as the Sloan Digital Sky Survey (SDSS). Combining data from many sources provides accurate profiles over wide dynamic ranges. They decompose the brightness profiles into disk components with exponential profiles and (pseudo)bulge components with Sérsic (1968) function profiles. Figure 39 is an example.
 |
Figure 39. Photometric decompositions of a galaxy with a classical bulge (M81, left) and one with a pseudobulge (NGC 3169). Classification is carried out as in Fig. 38. In the bottom panels, the filled circles are the major-axis profiles and the solid curves are the Sérsic function (pseudo)bulge, the exponential disk and their sum, which is almost invisible atop the data points. The fit is made between the vertical dashes; note that both galaxies contain nuclear star clusters ("nuclei") in addition to their bulges. The Sérsic index and the fit RMS are given in the key. The middle panel shows the deviations of the fit from the data in more detail. The top panel shows the total ellipticity profile. From Fisher & Drory (2008). |
This work further confirms the pseudobulge properties discussed in previous sections and provides several new results:
About half of early-type galaxies contain pseudobulges; almost all Sbc galaxies contain pseudobulges, and as far as we know, no Sc or later-type galaxy has a classical bulge (see Fig. 40). This is in excellent agreement with results discussed in Kormendy & Kennicutt (2004).
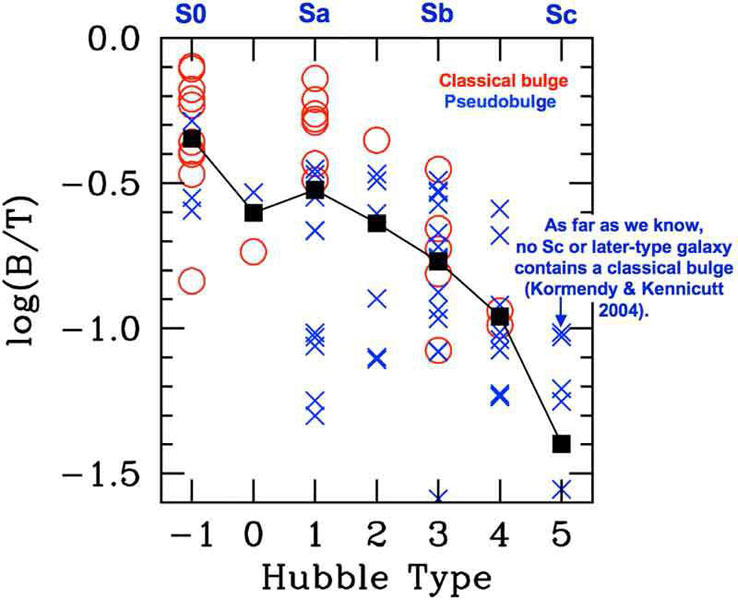 |
Figure 40. Logarithm of (pseudo)bulge-to-total luminosity ratio B / T versus Hubble type. Bulges are classified as in Fig. 38. Black squares show how the average B / T for pseudobulges and classical bulges together correlates with Hubble type as expected from its use as a Hubble classification criterion (Sandage 1961). Note: some pseudobulges have log B / T < -1.6. From Fisher & Drory (2008). |
Pseudobulges are often as flat as their associated disks; classical bulges are thicker than their associated disks. NGC 3031 = M 81 and NGC 3169 in Fig. 39 are examples.
Pseudobulge-to-total luminosity ratios are almost always PB /
T 0.35
(Fig. 40),
consistent with the expectation that one cannot secularly convert
almost all of a disk into a bulge
(Kormendy &
Kennicutt 2004).
Small bulge-to-total luminosity ratios B / T do not
guarantee that a bulge is pseudo, but large B / T
 0.5 guarantee
that it is classical.
0.5 guarantee
that it is classical.
5.2.6. Most pseudobulges have Sérsic n < 2. Classical bulges have n ≥ 2.
Figures 33 and 36 show that the pseudobulges in NGC 1353 and NGC 4274 have Sérsic indices n = 1.3 ± 0.3; i. e., almost-exponential brightness profiles. The pseudobulge in NGC 3169 (Fig. 39) has n = 1.45 ± 0.24, which is still close to exponential. In contrast, the classical bulge of M 81 has n = 3.79 ± 0.39. This difference turns out to be a general result.
Kormendy & Kennicutt (2004) review the history of this result. The idea that bulges in late-type galaxies have nearly exponential (not r1/4-law) brightness profiles dates back to work by Andredakis & Sanders (1994) and Andredakis et al. (1995). At first, no connection was made to pseudobulges; the result was just that n is smaller in bulges of later-Hubble-type galaxies.
Then Courteau et al. (1996) carried out bulge-disk decompositions for > 300 galaxies and concluded that > 2/3 of them – especially at late Hubble types – are best fitted by double exponentials, one for the bulge and one for the disk. As a diagnostic of formation processes, Courteau et al. (1996) went on to examine the ratio hb / hd of the scale lengths of the inner and outer exponentials. They found that hb / hd = 0.08 ± 0.05 and concluded that: "Our measurements of exponential stellar density profiles [in bulges] as well as a restricted range of [bulge-to-disk] scale lengths provide strong observational support for secular evolution models. Self-consistent numerical simulations of disk galaxies evolve toward a double exponential profile with a typical ratio between bulge and disk scale lengths near 0.1 (D. Friedli 1995, private communication) in excellent agreement with our measured values".
Fisher & Drory (2008) find closely similar results. The effective radii re of pseudobulges and the scale lengths hd of their associated disks are coupled, whereas the same is not true for classical bulges. Specifically, the mean ratio is <re / hd> = 0.21 ± 0.10 for 53 pseudobulges but <re / hd> = 0.45 ± 0.28 for 26 classical bulges. Since re = 1.678 hb for an exponential, the above result for pseudobulges corresponds approximately to <hb / hd> = 0.13 ± 0.06 (the conversion is approximate because the pseudobulges are not exactly exponentials). This confirms the results by Courteau et al. (1996) and similar results by MacArthur et al. (2003). Courteau and MacArthur did not calculate hb / hd separately for classical and pseudo bulges and therefore found a correlation with Hubble type rather than different distributions of hb / hd for the two types of bulges. But Courteau and MacArthur, like Fisher and Drory, interpreted the connection between bulge and disk properties as a sign that secular evolution and pseudobulge formation become more important at later Hubble types.
As a result of this and other work (see especially
Weinzirl et al.
2009),
the connection between pseudobulges and small Sérsic
indices is by now well established. Classical bulges, on the other hand,
have Sérsic indices like those of elliptical galaxies, which have
n 2 (e. g.,
Kormendy et al.
2009,
hereafter KFCB). Moreover, the Sérsic indices n
≃ 2 to 3 of ellipticals are well understood as natural results of
their formation by major galaxy mergers (e. g.,
Hopkins et al.
2009a,
c;
see
Kormendy et al.
2009
for a review). So the connection between the n
2
Sérsic indices of classical bulges with their formation by major
mergers is also well established.
Therefore, even though we do not fully understand how disk secular evolution determines the resulting pseudobulge Sérsic indices, we see strong enough correlations between n and other pseudobulge properties so that we can use the Séersic index as a classification criterion (Figs. 41, 42).
 |
Figure 41. Correlations with (pseudo)bulge Sérsic index nb of (top to bottom) bulge absolute magnitude, effective brightness at (left) or averaged interior to (right) the half-light radius re and effective radius re. The V-band date in the left plots are from Fisher & Drory (2008); the 3.6 μm-band Spitzer Space Telescope data in the right plots are from Fisher & Drory (2010). In all panels, the central components are classified morphologically as in Fig. 38. |
Therefore classical bulges have Sérsic n ≥ 2, whereas pseudobulges usually have n < 2. Note in Fig. 41 and in the earlier discussion of NGC 4736 that some pseudobulges do have Sérsic indices as big as n ≃ 4. Therefore it is always important to apply as many classification criteria as possible.
5.2.7. Fundamental plane parameter correlations
Figure 41 provides an introduction to the correlations between effective radius re, effective brightness μe at re, velocity dispersion σ and bulge absolute magnitude MV (the "fundamental plane"). Classical bulges satisfy the fundamental plane correlations of elliptical galaxies. Some pseudobulges do so, too. But many have larger re and fainter μe than do classical bulges.
Figure 68 updates the observation that classical bulges and ellipticals have the same correlations. Simulations of major galaxy mergers reproduce these correlations (e. g., Robertson et al. 2006; Hopkins et al. 2008, 2009b).
Earlier versions that emphasize pseudobulges are shown in Figs. 42 and 43. Many pseudobulges satisfy the correlations for bulges and ellipticals, but in general, they show substantially larger scatter.
 |
Figure 42. Structural parameter correlations for pseudobulges (blue), classical bulges (brown), ellipticals (red), and spheroidal galaxies (green). Pseudobulge data and most bulge points are from Fisher & Drory (2008). The ellipticals, five bulge points and the green squares are from Kormendy et al. (2009: KFCB). Green triangles show all spheroidals from Ferrarese et al. (2006) that are not in KFCB. Crosses show all spheroidals from Gavazzi et al. (2005) that are not in KFCB or in Ferrarese et al. (2006). Open squares are Local Group spheroidals (Mateo 1998; McConnachie & Irwin 2006). The bottom panels show major-axis Sérsic index n and effective surface brightness μe versus galaxy or bulge absolute magnitude. The top panel shows μe versus effective radius re (the Kormendy 1977b relation, which shows the fundamental plane almost edge-on). From Kormendy & Fisher (2008). |
Figure 43 shows the μe – re correlation from Carollo (1999). I emphasize this version because it shows more extreme pseudobulges together with spheroidal galaxies, galactic nuclear star clusters and globular clusters. Spheroidals form a sequence perpendicular to the correlation for ellipticals (Figs. 42, 61). Globular clusters are different from both ellipticals and spheroidals (Kormendy 1985, 1987). The comparison that is important here is the one between bulges plus ellipticals, pseudobulges and galactic nuclei.
Figures 42 and 43 show that some pseudobulges satisfy the parameter correlations for classical bulges and ellipticals, but many deviate by having brighter μe (Kormendy & Bender 2012) or fainter μe (see also Falcón-Barroso et al. 2002; Kormendy & Fisher 2008; Gadotti 2009). All available data suggest that pseudobulges fade out by becoming low in surface brightness, not by becoming like nuclear star clusters. Nuclear star clusters are not faint versions of pseudobulges. Indeed, tiny pseudobulges and normal nuclei coexist in Scd galaxies like M 101 and NGC 6946 (Kormendy et al. 2010).
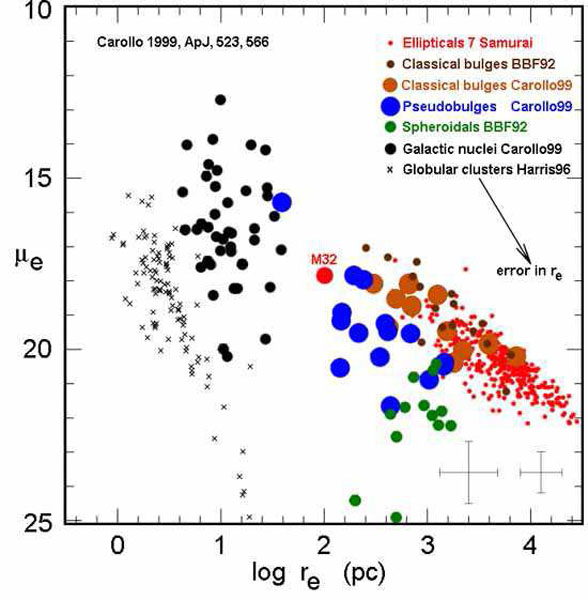 |
Figure 43. Effective surface brightness versus effective radius for various kinds of stellar systems (Carollo 1999; this version is from Kormendy & Fisher 2008). |
The fundamental plane is only secondarily useful for bulge classification. Many pseudobulges satisfy the correlations for classical bulges, so use of the correlations as the only classification method (Gadotti 2009; Gadotti & Kauffmann 2009) is not feasible. Extreme pseudobulges can be identified because their parameters deviate from the E correlations in Fig. 42, but these objects can usually be robustly classified using other criteria anyway.
Figure 44 shows examples of nuclear bars at the centers of barred and oval galaxies. Nuclear bars are well known phenomena (de Vaucouleurs 1959; Sandage 1961; Kormendy 1981, 1982b; Buta et al. 2007; Buta 2011, 2012). They are always much smaller than the main bars in which they are embedded. Observations are consistent with the suggestion that their physics is essentially the same as that of main bars. How they form is not known in detail, but it is reasonable to expect that the growth of stellar disky pseudobulges out of inflowing cold gas can result in a bar instability.
 |
Figure 44. Bars within bars. The main bar is rotated until it is horizontal. Contour levels are close together in intensity at large radii and widely spaced in intensity in the nuclear bars. NGC 3081 and NGC 1433 have inner rings. NGC 1291 is also shown in Fig. 6. NGC 3081 and NGC 3945 are shown in Figs. 17 and 24. The images are courtesy Ron Buta; this figure is from Kormendy & Kennicutt (2004). The nuclear bar in NGC 2950 (see above discussion) is illustrated in Fig. 17. |
Pattern speeds Ωp of nuclear bars are well predicted by Section 4.2. They live at small radii where stellar densities are high and where Ω - κ/2 is large. So Ωp ~ Ω - κ/2 should be larger for nuclear bars than it is for main bars. This is seen in n-body models (Debattista & Shen 2007; Shen & Debattista 2009). Direct measurement of Ωp is difficult, but Corsini et al. (2009) use the Tremaine & Weinberg (1984) method on NGC 2950 and conclude that the main and nuclear bars have different pattern speeds. For present purposes, different Ωp is sufficiently well established by the observation that nuclear bars have random orientations with respect to their main bars (Fig. 44).
Bars are disk phenomena. A nuclear bar therefore identifies a pseudobulge.
5.2.9. Boxy pseudobulges are edge-on bars.
Section 4.3.3 reviews how bars buckle and thicken in the vertical direction and consequently look like "box-shaped bulges" when seen edge-on. These are parts of disks, so I call them "boxy pseudobulges". The one in our Galaxy is particularly clearcut, because we are close enough to it so that, from our perspective, the near side looks taller than the far side (Fig. 45).
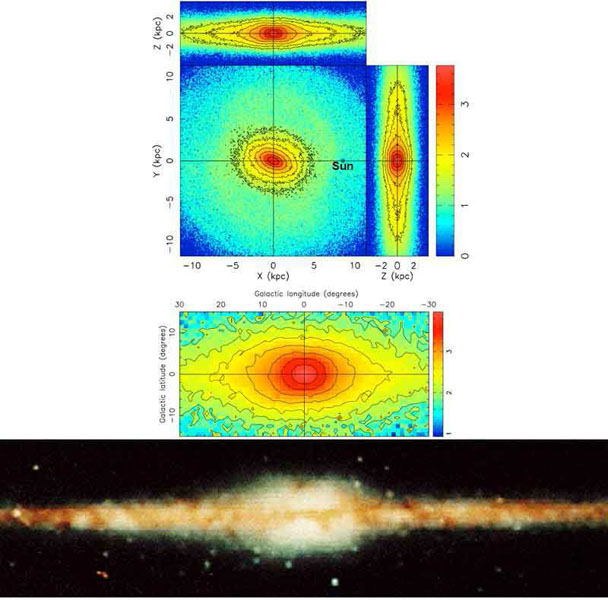 |
Figure 45. The boxy pseudobulge = almost-end-on bar of our Galaxy in (bottom: from http://www.nasaimages.org/luna/servlet/detail/nasaNAS~5~5~24223~127634:COBE-s-View-of-the-Milky-Way) a COBE infrared view and (top) an n-body model from Shen et al. (2010). The top three model panels show the face-on and side-on views as projected and seen from far away. Seen almost side-on (top), the bar looks peanut-shaped. Seen almost end-on from the direction of our Sun (right-hand view), it looks boxy when seen from far away. Viewed instead from within our Galaxy at the position of the Sun (bottom model panel), the near side of the bar is significantly closer than the far side. Therefore the near side looks taller than the far side, exactly as in the COBE image (Blitz & Spergel 1991). |
Observations which further show that boxy bulges are edge-on bars are reviewed in Kormendy & Kennicutt (2004). The well known example of NGC 4565 (Fig. 46, from Kormendy & Barentine 2010) turns out to be an SB(r) galaxy with a second, tiny pseudobulge at its center that is distinct from the boxy bar (Fig. 47).
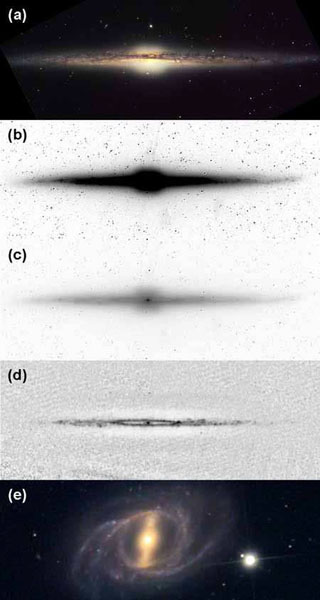 |
Figure 46. (a) Optical and (b, c) Spitzer 3.6 μm negative images of NGC 4565 shown at different stretches to emphasize (b) the boxy bar and (c) an inner ring and pseudobulge. The newly detected pseudobulge is the central bright dot. (d) Spitzer IRAC 8 μm negative image showing PAH emission and therefore star formation from the inner ring and outer disk. Because the inner ring is dark inside at 8 μm, we conclude that the dark inside seen at 3.6 μm is not caused by dust absorption. Rather, the ring really is dark inside. Therefore NGC 4565 is an SB(r)b galaxy, i. e., an almost-edge-on analog of NGC 2523 (bottom panel). The NGC 2523 image has been scaled so the inner ring has the same apparent radius as in NGC 4565 and rotated to the apparent bar position angle inferred for NGC 4565. We suggest that NGC 2523, if oriented as in the bottom panel and inclined still more until we observed it almost edge-on, would show the features seen in the NGC 4565 images. |
Finding the tiny pseudobulge hidden inside the boxy bar of NGC 4565 solves a long-standing puzzle and cements an important implication for the statistics of (P)B / T luminosity ratios. Compare NGC 4565 with any more face-on barred galaxy, such as NGC 2523 in Fig. 46. Face-on galaxies show a (pseudo)bulge, a bar, and an outer disk; i. e., three or more components. The edge-on galaxy NGC 4565 shows only a "boxy bulge" and a disk. As long as we thought that boxy distortions were minor features of bulges, this was no problem – many unbarred Sb galaxies have just a bulge and a disk. But if the box in NGC 4565 is an edge-on bar, then the galaxy contains a bar and a disk; i. e., only two components. This is not seen in face-on galaxies except at very late Hubble types. Where is the "bulge" in NGC 4565?
Figures 46 and 47 show the answer. The minor-axis profile of the boxy structure is exponential. Inside this structure, there is a clearly distinct, tiny central component that has n = 1.33 ± 0.12 and that therefore is a second, "disky" pseudobulge. The important implication is that PB / T = 0.06 ± 0.01 is much smaller than the value B / T ≃ 0.4 (Simien & de Vaucouleurs 1986) for the box. Closely similar results are found for the edge-on "boxy bulge" galaxy NGC 5746 (Barentine & Kormendy 2012). Not counting boxy bulges because they are bars, (P)B / T ratios are much smaller than we have thought for essentially all edge-on galaxies with boxy bulges. In particular, the classical-bulge-to-total ratio in our Galaxy is ~ 0 (Shen et al. 2010).
 |
Figure 47. Minor-axis profile of NGC 4565 from Kormendy & Barentine (2010). The dashed lines show a decomposition of the profile into components in order of increasing radius: a Seyfert nucleus (Ho et al. 1997) or nuclear star cluster that is not included in the fit, the pseudobulge (Sérsic), box-shaped bar (Sérsic) and outer halo (exponential). The solid line is the sum of the components. |
5.3. Pseudobulges classification criteria
The bulge-pseudobulge classification criteria updated from Kormendy & Kennicutt (2004) are listed here for convenience. They are identified by the number m in the Section 5.2.m in which they were discussed.
If the center of the galaxy is dominated by Population I material (young stars, gas and dust), but there is no sign of a merger in progress, then the bulge is at least mostly pseudo.
Pseudobulges often have disky morphology; e. g., their apparent flattening is similar to that of the outer disk, or they contain spiral structure all the way in to the center of the galaxy. Classical bulges are much rounder than their disks unless the galaxy is almost face-on, and they cannot have spiral structure.
Pseudobulges are more rotation-dominated than classical bulges in the Vmax / σ – є diagram. Integral-field spectroscopy often shows that the central surface brightness excess over the inward extrapolation of the outer disk profile is a flat central component that rotates rapidly and that has a small velocity dispersion.
Many pseudobulges are low-σ outliers in the Faber-Jackson (1976) correlation between (pseudo)bulge luminosity and velocity dispersion. A similar signature is that σ decreases from the disk into the pseudobulge.
Small bulge-to-total
luminosity ratios do not guarantee that a bulge is pseudo, but almost
all pseudobulges have PB / T
0.35. If
B / T
0.5, the bulge is
classical.
Most pseudobulges have Sérsic index n < 2, whereas almost all classical bulges have n ≥ 2. The processes that determine the small Sérsic indices of pseudobulges are not understood, but the correlation of small n with other pseudobulge indicators is so good that this has become a convenient classification criterion. Note, however, that some pseudobulges do have Sérsic indices as big as 4.
Classical bulges fit the fundamental plane correlations for elliptical galaxies. Some pseudobulges do, too, and then these correlations are not helpful for classification. But more extreme pseudobulges are fluffier than classical bulges; they have larger re and fainter surface brightnesses μe at re. These can easily be identified using fundamental plane correlations.
In face-on galaxies, the presence of a nuclear bar shows that a pseudobulge dominates the central light. Bars are disk phenomena. Triaxiality in giant ellipticals involves completely different physics – slow (not rapid) rotation and box (not x1 tube) orbits.
In edge-on galaxies, boxy bulges are edge-on bars; seeing one is sufficient to identify a pseudobulge. The boxy-nonrotating-core side of the "E – E dichotomy" of elliptical galaxies into two kinds (Kormendy et al. 2009) cannot be confused with boxy, edge-on bars because boxy ellipticals – even if they occur in disk galaxies (and we do not know of an example) – are so luminous that we would measure B / T > 0.5. Then point (5) would tell us that this "bulge" is classical.
It is important always to apply as many classification criteria as possible.
5.4. Secular evolution and hierarchical clustering
We now have a well articulated paradigm of secular evolution in galaxy disks that complements our standard picture of hierarchical clustering. There is no competition between these two galaxy formation pictures – both are valid, and their relative importance depends on cosmological lookback time and on environment. I have emphasized that the Universe is in transition from early times when the rapid processes of hierarchical clustering were most important in controlling galaxy evolution to future times when galaxy merging will largely have finished and slow, internal processes will dominate.
In the present Universe, the mass in bulges (including ellipticals) and that in disks are roughtly equal (Schechter & Dressler 1987; Driver et al. 2007; Gadotti 2009; Tasca & White 2011). Uncertainties are large, with estimated ratios of the mass in bulges to that in disks as large as ~ 2 (Fukugita et al. 1998). One reason is that the relative numbers of disks and merger remnants is a strong function of environment: disks predominate in the field, whereas most giant ellipticals live in galaxy clusters (Section 6.1).
The ratio of mass in classical bulges to that in pseudobulges has not yet been determined for large and unbiased galaxy samples. It is reasonable to expect that the ratio of masses is not large.
In contrast, the ratio of numbers of pseudobulges to numbers of
classical bulges could easily be
1.
Kormendy &
Kennicutt (2004)
estimated that most Sa galaxies contain classical
bulges, that in Sb galaxies, classical and pseudo bulges are comparably
common and that most Sbc galaxies contain pseudobulges. Recent work
suggests that there are more pseudobulges at early Hubble types than
Kormendy & Kennicutt thought
(Fisher & Drory
2008;
Weinzirl et al.
2009).
S0 galaxies contain pseudobulges more often than
Sa galaxies, consistent with parallel-sequence galaxy classifications in
which S0s form a sequence in (P)B / T that parallels
the sequence of spirals (Section 7). At
late Hubble types, Sc –
Im galaxies appear never to contain classical bulges. Many Scd –
Sm galaxies do not contain pseudobulges, either; M 33 is an example, and
the main reason is that Ω(r) depends little enough on
radius so that it is not energetically profitable to transport angular
momentum outward (Section 2.4).
I conclude with a point of perspective from Kormendy & Kennicutt (2004). In the early 1970s, when I was a graduate student, Hubble classification was in active use, but we also knew about many regular features in galaxy disks, such as lens components, nuclear, inner and outer rings, nuclear bars and boxy bulges, that we did not understand and that often were not even included in the classification. We also knew many peculiar galaxies, no two of which look alike; they did not fit comfortably into Hubble classification, and we did not understand them, either. Now both the peculiar galaxies and the structural regularities are becoming well understood within two paradigms of galaxy evolution that got their start in the late 1970s. The peculiar galaxies were once normal but now are undergoing tidal interactions or are galaxy mergers in progress (Section 8.1). And structures such as rings and lenses that are seen in many galaxies are products of the secular evolution of relatively isolated galaxy disks. Between collisions, galaxies do not just sit quietly and age their stellar populations. Galaxies represent snapshots of moments in time during dynamical evolution that goes on today and that will contine to go on for many billions of years to come.