


The launch of the Herschel Space Observatory and advent of increasingly sensitive submm spectrometers has allowed for the characterization of FIR fine structure lines at low and high-redshift respectively. The predominant lines studied are those of neutral and ionized carbon, nitrogen and oxygen, with a particular emphasis on the [CII] ionized fine structure line. These lines are the dominant cooling lines for diffuse ISM, and can provide a diagnostic into both the cold neutral medium, HII regions, and photodissociation regions (PDRs) in galaxies. Accordingly, we review here what is known about [CII] at high-redshift, though we note results from other lines when appropriate.
The [CII] 158 µm line (in reality 157.7 µm) is a fine structure line which is thought to be excited by collisions with neutral hydrogen, or with free electrons and protons when the electron density is sufficiently high. Important sources of free electrons are from dust grains and PAHs via photo-electric heating (Draine, 1978, Helou et al., 2001) from UV photons.
The first detection of [CII] at high-z was presented by Maiolino et al. (2005), who detected the line in the luminous z = 6.4 quasar host galaxy J1148+5251. Since then, the number of detections of the 158 µm [CII] emission line at high-redshift have grown rapidly. Luminous quasar host galaxies (e.g. Maiolino et al., 2005, Iono et al., 2006, Maiolino et al., 2009, Walter et al., 2009, Wagg et al., 2010, Stacey et al., 2010, Gallerani et al., 2012, Carniani et al., 2013), SMGs (e.g. Ivison et al., 2010d, Stacey et al., 2010, Cox et al., 2011, De Breuck et al., 2011, Carilli et al., 2013, Swinbank et al., 2012, Wagg et al., 2012, George et al., 2013, Huynh et al., 2013) and normal star-forming galaxies (e.g. Graciá-Carpio et al., 2011) at high-redshift have all been detected in [CII]. The line is thought to be an important coolant in the ISM, and can make up as much as 1% of the far infrared luminosity of a galaxy (Nikola et al., 1998, Malhotra et al., 2001, Stacey et al., 2010). However, the sites of origin of [CII] emission can be diverse, and thus its power as a diagnostic for the physical conditions in the ISM of early Universe galaxies is still debated. Because it has a relatively low ionization potential (11.3 eV, compared to the 13.6 eV characteristic of HI), [CII] can arise from both neutral gas, as well as ionized regions. Beyond this, the critical densities for [CII] emission can range from ~ 5 - 50 cm-3 for collisions with electrons, to ~ 1 - 8 × 103 cm-3 for collisions with neutral atomic or molecular hydrogen (Goldsmith et al., 2012). Hence, the line is relatively easy to excite.
At the same time, other lines provide complementary information to [CII] in high-z galaxies. For example, [NII] at 205 µm has an ionization potential of 14.5 eV, and thus traces ionized ISM. Because the [NII] transition has a critical density and second ionization potential very similar to that of [CII], the ratio of the two lines can serve as a diagnostic for the amount of [CII] arising from the ionized medium (e.g. Decarli et al., 2014).
9.1. The [CII]-FIR deficit in Galaxies
The Milky Way has a [CII]/FIR luminosity ratio of roughly 0.003, as do other nearby disk galaxies with some scatter. In the early days of [CII] observations of low-redshift galaxies with the Long Wavelength Spectrometer (LWS) on the Infrared Space Observatory (ISO), it was recognized that very luminous infrared galaxies such as ULIRGs appear to have a deficit in [CII] emission compared to their FIR luminosities. However, present-epoch ULIRGs emit roughly ~ 10% of the expected [CII] flux, given their far infrared luminosities (e.g. Malhotra et al., 1997, 2001, Luhman et al., 1998, 2003). A variety of possible explanations have been posited for the apparent deficit. These include optically thick [CII] emission in the presence of large dust columns. Alternatively, if the UV radiation fields are softer owing either to dust extinction in compact starbursts, or a varying IMF, there may be less heating of hydrogen and electrons, and hence less collisions with ionized carbon. Other explanations for the [CII]/FIR deficit include high ionization parameters in the vicinity of an AGN, and saturated [CII] emission in extremely dense environments (e.g. Luhman et al., 1998, Abel et al., 2009, Papadopoulos et al., 2010, Sargsyan et al., 2012). Based on the existence of a deficit in [NII] (among other lines, such as [OI], Farrah et al. (2013) proposed a combination of a harsher interstellar radiation field in HII regions with increased dust grain charging in the ISM as a potential origin of the line deficits. In Figure 48, we plot the current state of CII-FIR measurements for low and high-z galaxies. The grey points denote low-z galaxies, and highlight the deficit of L[CII] at high FIR luminosities.
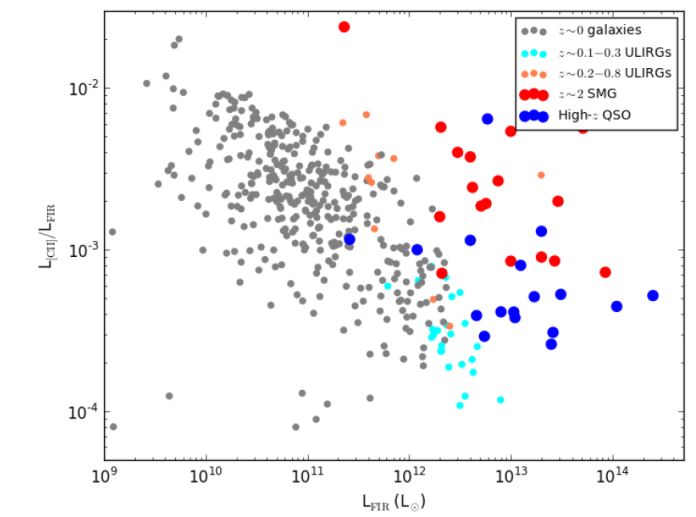 |
Figure 48. Relationship between LCII / LFIR ratio and LFIR for both local galaxies and galaxies at mid (z ~ 0.1-0.3) and high-z. At a fixed redshift, there appears to be a deficit in the [CII]/FIR ratio at high FIR luminosities. This said, the high-z points appear to be offset from the low-z data. The local data is compiled by Brauher et al. (2008), with new data by Dí-Santos et al. (2013) from the GOALS survey included as well. The data at moderate redshifts is from Farrah et al. (2013) and Rigopoulou et al. (2014). The high-z data is subdivided into quasars and SMGs, and comes from Cox et al. (2011), De Breuck et al. (2011), George et al. (2013), Graciá-Carpio et al. (2011), Ivison et al. (2010d), Maiolino et al. (2005), Rawle et al. (2013), Stacey et al. (2010), Swinbank et al. (2012), Valtchanov et al. (2011), Venemans et al. (2012), Wagg et al. (2012), Wang et al. (2013a), Willott et al. (2013). |
The results from high-z systems have been more mixed. Stacey et al. (2010) compiled a number of new detections with literature measurements to suggest that the [CII]-FIR deficit persists when including high-z galaxies. The high-z points that show a deficit in this study tended to host an AGN. Wang et al. (2013a) found that the [CII]/FIR deficit also persisted in their sample of five z ~ 6 quasars detected by ALMA, and Rawle et al. (2013) found a deficit for an extreme starburst SMG at z ~ 5. Similarly, Iono et al. (2006) found [CII]/FIR ratios comparable to local ULIRGs in a z ~ 5 quasar. This deficit is potentially not confined to [CII] emission. Graciá-Carpio et al. (2011) examined the [CII] emission properties (along with a host of other FIR lines, including [OI], [OIII], [NII] and [NIII]), and found evidence for a (line flux)/FIR deficit for all of these lines. Similarly, Farrah et al. (2013) found deficits in [OI] 63, [OI] 145, [NII] and [CII] at high LIR. Graciá-Carpio et al. (2011) found that when plotting the deficit against LFIR / MH2 instead of LFIR, the deficit began uniformly around LFIR / MH2 ≈ 80 L⊙ / M⊙ for each of the emission lines. This result was confirmed for [NII] by Decarli et al. (2012). Interestingly, Pope et al. (2013) find a deficit in LPAH 6.2 / LIR with LIR for both local and high-z DSFGs, with a similar offset as is possibly seen in the [CII]/FIR deficit in high-z galaxies.
On the other hand, some studies have found no deficit when examining [CII], as well as other nebular lines (e.g. Hailey-Dunsheath et al., 2010, Wagg et al., 2010, De Breuck et al., 2011, Ferkinhoff et al., 2011, Swinbank et al., 2012, Coppin et al., 2012). These studies have found that at typical ULIRG luminosities, where local galaxies exhibit a clear [CII] / FIR deficit, some high-z SMGs appear to show a [CII] excess.
The issue may be that comparing galaxies at low and high-z via simple luminosity bins is comparing apples and oranges. At a given stellar mass, galaxies at high-z have a higher SFR (and hence, LFIR) than a z = 0 analog. Similarly, at a fixed LFIR, galaxies at high-z tend to be more spatially extended than present epoch counterparts, which may mitigate whatever physical mechanism produces a deficit in local galaxies. Indeed, further examination of Figure 48 suggests that perhaps the [CII]-FIR deficit continues to persist at high-z, though the relation is simply shifted in FIR luminosity. Hence, one reasonable approach for future studies may involve comparing the [CII]/FIR ratio against luminosity surface density, as in Dí-Santos et al. (2013).
9.2. [CII] as a Star Formation Rate Indicator
The role of [CII] as a SFR tracer in galaxies is under debate, though it is a topic of great interest in the community. If a reasonable calibration between [CII] and SFR can be determined, the line would serve as a powerful probe of high-z galaxies. At the least, [CII] does not suffer from extinction as heavily as more traditional shorter-wavelength SFR tracers.
Leech et al. (1999) presented an examination of [CII] emission from 19 Virgo cluster spirals, and found a positive correlation between the line luminosity and FIR luminosity, with less dispersion than is seen in local ULIRGs. Boselli et al. (2002) found a relation between [CII] and Hα luminosity in galaxies.
de Looze et al. (2011) presented an analysis of [CII] emission from 24 nearby star-forming galaxies, and compared the line luminosity to star formation rates determined from UV data (taken from GALEX), and MIPS 24 µm fluxes. These authors find a relatively tight correlation between the SFR of galaxies and [CII] luminosity between log(SFR) ≈ [-1,2]. de Looze et al. (2011) attribute the positive correlation to two possible explanations. The first is that the [CII] flux from PDRs comes from the regions extremely close to star-forming regions, near the border of HII regions and neutral gas. The second is that the [CII] emission principally arises from cold neutral medium, and the relation between SFR and [CII] emission is simply a manifestation of the global Kennicutt-Schmidt law. Similarly, Sargsyan et al. (2012) found that, when excluding AGN selected by the 6.2 µm PAH equivalent width, [CII] correlates well with the LIR of nearby galaxies, and is thus a reasonable SFR tracer in these environments. These authors further suggest that the [CII]-FIR deficit therefore owes to increased contribution to the infrared luminosity by embedded AGN. Farrah et al. (2013) report an empirical calibration of the [CII]-SFR relation as well.
On the other hand, the existence of a deficit of [CII] emission at high infrared luminosities (with the deficits beginning at seemingly increasing IR luminosity at increasing redshifts; c.f. Figure 48) suggests that [CII] may not be a robust tracer of a galaxy's SFR, at least in the high luminosity regime. Beyond this, as is apparent from Figure , at a given infrared luminosity, there is approximately an order of magnitude scatter in the [CII]/FIR ratio. Some of this scatter may owe to the fact that [CII] can arise from both neutral and ionized gas. Sargsyan et al. (2012) and Farrah et al. (2013) show a ~ 1 dex scatter in their SFR-[CII] relations.
9.3. [CII] Morphologies and Dynamics
At high-redshift, utilizing CO as a tracer of the morphologies and dynamics of neutral gas can become problematic. First, low-metallicity galaxies will suffer from a decreased abundance of CO, making the molecule harder to detect (c.f. § 8.2). Second, low ΣSFR galaxies will typically have lower CO excitation. At increasing redshifts, a given receiver detects increasingly high excitation lines, which may be faint in low ΣSFR galaxies. Both of these have motivated the exploration of alternative gas dynamical tracers in high-z galaxies, such as [CII].
A number of studies have used extremely high resolution [CII] observations to constrain the size of the emitting region of high-z quasar host galaxies. Walter et al. (2009) derived a source size of ~ 1.5 kpc, and suggested that the galaxy was undergoing an Eddington-limited starburst event. Similar compact sizes were derived for two z~ 4 quasar host galaxies by Gallerani et al. (2012) and Carniani et al. (2013), who also detected companion galaxies potentially due to merge with the quasar host. Carniani et al. (2013) and Wang et al. (2013a) displayed the power of using ALMA to examine the dynamics of [CII]-emitting gas in quasar host galaxies, and showed that a number of galaxies in their sample potentially exhibited rotating gas disks.
This all said, there have been a number of notable non-detections of [CII] at high-z that have called into question the reliability of [CII] as a gas tracer in high-z galaxies. For example, Kanekar et al. (2013) searched for [CII] emission from a lensed Lyman-α emitter at z ~ 6.5, and showed a non detection. Similarly, Ouchi et al. (2013) utilized ALMA to search for [CII] from Himiko, a luminous galaxy at z ~ 6.5 that forms stars at ~ 100 M⊙ yr-1. These authors showed a non detection to limits LCII < 5.4 × 10⁷ L⊙. If these results are confirmed by followup deep observations of Himiko and other similar galaxies, they may suggest that [CII] emission may not be ubiquitous in early-Universe galaxies, even those forming stars at a relatively prodigious rate. Whether the lower metallicity of Himiko drives the [CII] non-detection is an open question. Further investigation into the origin of [CII] emission, and its value both as an SFR tracer, as well as gas dynamics probe are clearly warranted.
Going forward, increased observational constraints on the origin of [CII] emission in star-forming galaxies will be critical. Recently, Decarli et al. (2014) examined the unique z ~ 4.7 interacting system BR1202-0725 in [NII] and [CII]. BR1202 consists of a quasar, SMG and two Lyman-α emitters. These authors found large [CII]/[NII] ratios for the QSO and SMG, though ratios closer to unity for one Lyman-α emitter, suggesting ionized gas as the principle source of [CII] emission in the latter source.
Finally, we conclude this section by briefly noting that observations of neutral atomic carbon, CI, are gaining traction in recent years. CI is a simple three level system that is typically optically thin - detection of multiple lines allows for observed constraints on the excitation temperature and column density (of carbon), and serves as a cross-check against values derived from CO (Walter et al., 2011, Alaghband-Zadeh et al., 2013).