


The rotation curves of galaxies – i.e. the circular velocity profile of the stars and gas in a galaxy, as a function of their distance from the galactic center – played a particularly important role in the discovery of dark matter. Under some reasonable simplifying assumptions, it is possible to infer the mass distribution of galaxies from their rotation curves. Historically, it was the observation of approximately “flat” rotation curves at very large galactocentric distances that did the most to convince the scientific community that large amounts of dark matter is present in the outer regions of galaxies.
In 1914, ten years before Hubble convincingly demonstrated that Andromeda (M31) was a galaxy and located outside of the Milky Way, Max Wolf [340] and Vesto Slipher [297] noticed that the spectral lines from this system were inclined when the slit of the spectrogram was aligned with the galaxy's major axis and straight when it was aligned with the minor axis, allowing them to conclude that Andromeda rotates. Based on 79 hours of observation in 1917 with the Mount Wilson Observatory's 60-inch reflector, Francis Pease measured the rotation of the central region of Andromeda out to an angular radius of 2.5 arcminutes, finding that it rotates with an approximately constant angular velocity. Several authors used Andromeda's observed rotational velocity to calculate its mass and discuss its mass-to-light ratio in comparison with the measured value for the solar neighborhood (see Chapter II), finding values that were in reasonable agreement, e.g. Hubble (1926) [163], Oort (1932) [226].
In a paper published in 1930 [203], Knut Lundmark made estimates for the mass-to-light ratios of five galaxies based on a comparison of their absolute luminosity – as estimated using novae as distance indicators – and their mass as inferred from spectroscopic observations. These mass-to-light ratios varied, quite unrealistically, from 100 for M81 to 6 for M33 – much larger than those found for the solar neighborhood (Lundmark also made early estimates for the mass of the Milky Way [202]). This demonstrates that astronomers at the time were open to the possibility that large amounts of dark matter might be present in astrophysical systems, in the form of “extinguished stars, dark clouds, meteors, comets, and so on”, as Lundmark writes in 1930 3. Holmberg argued in 1937 that the large spread in mass-to-light ratios found by Lundmark was a consequence of the absorption of light “produced by the dark matter”, and that once this was correctly taken into account, all of the galaxies studied by Lundmark, including the Milky Way, would have mass-to-light ratios between 6 and 7 [157].
Fritz Zwicky, in his famous 1937 article on galaxy clusters, discussed the possibility of using the rotation curves of galaxies to infer their mass distribution, concluding that:
It is not possible to derive the masses of [galaxies] from observed rotations, without the use of additional information.
Beside the lack of information on the ellipticity of orbits, one of Zwicky's main concerns was the possible internal “viscosity” resulting from the mutual interactions of stars. Only four years later, Chandrasekhar would demonstrate in his classic paper, “The Time of Relaxation of Stellar Systems”, that these interactions are completely negligible, allowing one to reliably describe galaxies as systems of non-interacting stars.
Meanwhile, in his 1939 PhD dissertation, Horace Babcock presented the rotation curve of M31 out to 100 arcminutes (i.e. about 20 kpc) away from its center [31]. Interestingly, he found very high values for the circular velocity at large radii – so high, in fact, that they are at odds with modern measurements. Approximating M31 as a sphere surrounded by a flattened ellipsoid, he calculated the mass distribution of the galaxy, recognizing that the observed rising rotation curve at large radii implied the existence of large amounts of mass in the outer parts of the galaxy. But when interpreting this result, he conservatively argued that:
the calculated ratio of mass to luminosity in proceeding outward from the nucleus suggests that absorption plays a very important role in the outer portion of the spiral, or, perhaps, that new dynamical considerations are required, which will permit of a smaller mass in the outer parts.
More than a decade later, observations made by Nicholas Mayall in 1951 at Mount Wilson [282] were used by Martin Schwarzschild to further study the dynamics of M31. In doing so, Schwarzchild showed that a model with a constant mass-to-light ratio was able to explain the rotational velocities measured by Mayall out to 115 arcminutes.
The German invasion of Poland in 1939 marked the official start of World War II. Hostilities brought death and destruction, but also unexpected benefits for science, as after the war ended military radars began to be used for radio astronomical observations. The Netherlands was particularly active in this field, under the push of the visionary astronomer Jan Oort, who was not only a great scientist, but also a great organizer. A chain of so-called Würzburg antennas – 7.5 meter parabolic radars used at 54 cm wavelengths for aircraft tracking – had been left behind in the Netherlands by occupying German forces at the end of the war, and since the reflective surface and tracking precision were also suitable for shorter wavelengths, and in particular for the 21 cm line predicted by Oort's student Hendrik van de Hulst, one was mounted in Kootwijk for the purpose of radio astronomy [318].
When Harold Ewen and Edward Purcell, from Harvard, detected the 21 cm line in 1951, van de Hulst was visiting Harvard, and so was F. J. Kerr from the Radiophysics Laboratory in Sydney. The Dutch and Australian groups were soon able to confirm the detection: the reports of the American and Dutch groups appeared in the same issue of Nature, together with a confirming telegram from the Australian group. This success provided an important boost to the young field of radio astronomy, and had a dramatic impact on the history of astrophysics and cosmology.
Back in the Netherlands, the construction of a new 25 meter radio telescope was completed in Dwingeloo, in 1955. Only two years later, van de Hulst, Jean Jacques Raimond, and Hugo van Woerden published the first radio rotation curve of M31, extending observations to 2 degrees away from its center [316]. Although the data seemed at first to be at odds with the rotation curve calculated by Schwarzschild, Maartin Schmidt argued in a paper accompanying the publication of van de Hulst et al. that a constant mass-to-light ratio provided a satisfactory explanation of the data, although also noting that “nothing as yet can be stated about the ratio in the innermost and outermost parts” of M31 [280].
In 1959, Franz Kahn and Lodewijk Woltjer proposed an ingenious method to determine the combined mass of M31 and the Milky Way. Since 21 cm observations of M31 indicated that it was approaching the Milky Way at a speed of 125 km/s, they derived a lower bound on the reduced mass of the M31-Milky Way system, assuming that the two galaxies are part of a bound system and that the orbital period is smaller than the age of the Universe. That lower bound was, however, six times larger than the currently accepted value of the reduced mass of the system [171]. The authors argued at the time that this provided evidence for intergalactic material in the form of gas stabilising the local group. In retrospect, this simple argument is one of the earliest clear indications of dark matter halos around galaxies.
In his detailed historical account [277], Robert Sanders argues that despite these developments there was no sense of crisis in the field of astrophysics at the end of the 1950s, or at least that there was no consensus that the observed rotation curves were in conflict with the current understanding of galaxies. A decade later, things began to dramatically change.
In the 1960s, Kent Ford developed an image tube spectrograph that Vera Rubin and he used to perform spectroscopic observations of the Andromeda Galaxy. The observations of the M31 rotation curve Rubin and Ford published in 1970 [267] represented a step forward in terms of quality. Their optical data extended out to 110 arcminutes away from the galaxy's center, and were compatible with the radio measurements obtained previously by Morton Roberts in 1966 [257].
It was also in 1970 that the first explicit statements began to appear arguing that additional mass was needed in the outer parts of some galaxies, based on comparisons of the rotation curves predicted from photometry and those measured from 21 cm observations. In the appendix of his seminal 1970 paper [126], Ken Freeman compared the radius at which the rotation curve was predicted to peak, under the assumption of an exponential disk with a scale length fit to photometric observations, to the observed 21 cm rotation curve. This combination of theoretical modelling and radio observations extending beyond the optical disk allowed Freeman to reach a striking conclusion. He found that for M33 (based on data summarised in Ref. [62]) and NGC 300 (based on data from Ref. [287]), the observed rotation curves peaked at larger radii than predicted, and – prompted by discussions with Roberts 4 – concluded that:
if [the data] are correct, then there must be in these galaxies additional matter which is undetected, either optically or at 21 cm. Its mass must be at least as large as the mass of the detected galaxy, and its distribution must be quite different from the exponential distribution which holds for the optical galaxy.
 |
Figure 2. Flat rotation curves began to emerge clearly from 21 cm observations in the early 1970s. Here we show the hydrogen surface density profile (left) and the rotation curves (right) of five galaxies as obtained by Rogstad and Shostak in 1972 [262]. The bars under the galaxy names indicate the average radial beam diameter, i.e. the effective spatial resolution. R80 is the radius containing 80% of the observed HI. |
This is perhaps the first convincing (or at least convinced) claim of a mass discrepancy in galaxies. D. Rogstad and G. Shostak performed a similar analysis in 1972 [262], by analyzing the rotation curves of five galaxies – M33, NGC 2403, IC 342, M101 and NGC 6946 – they had themselves obtained using the radio telescope at the Owens Valley Radio Observatory. They found that these rotation curves remained flat out to the largest radii observed (see Fig. 2) and, following the method of Freeman, they derived mass-to-light ratios as high as 20 at large radii. As explicitly said in their paper, they:
confirm[ed] the requirement of low-luminosity material in the outer regions of these galaxies.
Morton Roberts was among the first to recognize the implications of the observed flatness of galactic rotation curves. Together with R. Whitehurst, he published in 1972 a rotation curve of M31 that extended to 120 arcminutes from its center [335]. In 1973, together with Arnold Rots, he extended the analysis to M81 and M101, and argued that these spiral galaxies each exhibited flat rotation curves in their outer parts [260] (see Fig. 3). The authors' interpretation of these data was unambiguous:
The three galaxies rotation curves decline slowly, if at all, at large radii, implying a significant mass density at these large distances. It is unreasonable to expect the last measured point to refer to the ‘edge' of the galaxy, and we must conclude that spiral galaxies must be larger than indicated by the usual photometric measurements [...]. The present data also require that the mass to luminosity ratio vary with radius increasing in distance from the center.
 |
Figure 3. The rotation curves for the galaxies M31, M101, and M81 (solid lines) obtained by Roberts and Rots in 1973. The rotation curve of the Milky Way Galaxy was included by the authors for comparison. From Ref. [260]. |
In the Proceedings of the IAU Symposium No. 69, held in Besançon, France in September of 1974, Roberts reviewed the status of galactic rotation curves [259], highlighting the importance of radio observations, which extended well beyond the optical radius of the galaxies. When discussing the implications of the high mass-to-light ratios implied by these observations, he argued that the excess mass might take the form of intermediate and late dwarf M stars. He further tried to reassure his colleagues by arguing that the required radius-dependent luminosity function need not be alarming, since there was evidence of a dependence on the height above the Galactic Plane that exhibited a similar trend.
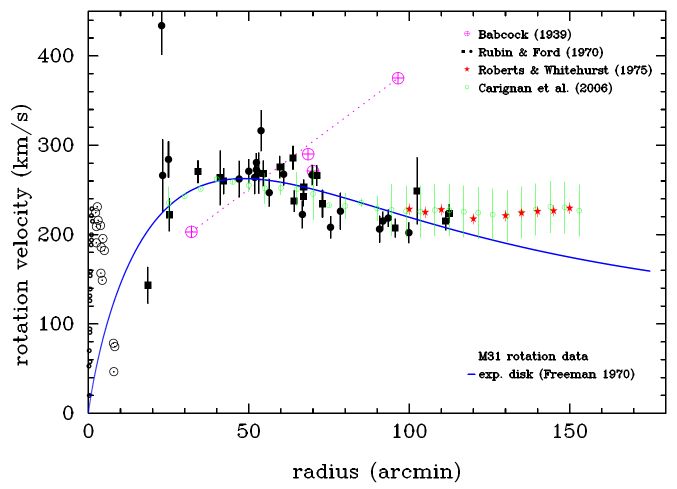 |
Figure 4. Rotation curve data for M31. The purple points are emission line data in the outer parts from Babcock 1939 [31]. The black points are from Rubin and Ford 1970 [267] (squares for the SW data, filled circles for the NE data, and open circles for the data in the inner parts – the presence of non-circular motions in the inner parts makes the modelling of those data uncertain). The red points are the 21-cm HI line data from Roberts and Whitehurst 1975 [261]. The green points are 21-cm HI line data from Carignan et al. [73]. The black solid line corresponds to the rotation curve of an exponential disc with a scalelength according to the value given in Freeman 1970 [126], suitably scaled in velocity. 21-cm data demonstrate clearly the mass discrepancy in the outer parts. Figure courtesy of Albert Bosma. |
As we will discuss in Chapter VIII, two influential papers in 1974 brought together the observed mass discrepancies observed in clusters and in galaxies [109, 229]. Both of these papers clearly state in their first paragraph that the mass of galaxies had been until then underestimated by about a factor of ten. In support of this, Jerry Ostriker, Jim Peebles, and Amos Yahil [229] cited Roberts and Rots [260] and Rogstad and Shostak [262] for the observed flat rotation curves. For the same purpose, Jaan Einasto, Ants Kaasik and Enn Saar [109] cited a review written in 1975 by Roberts for a book edited by A. and M. Sandage together with J. Cristian [272]. In a separate paper that appeared in the same year, focusing on the “morphological evidence” of missing mass around galaxies, Einasto and collaborators cited the 1973 paper of Roberts and Rots [260]. Interestingly, Einasto and collaborators excluded the possibility that this missing mass was in the form of stars, and argued that the most likely explanation was the presence of large amounts of gas in the outer parts of galaxies, which they referred to as “coronas” [110].
By 1974, the flat rotation curves obtained by radio astronomers had done much to establish the existence of large amounts of mass in the outer parts of galaxies – at least to the eyes of the influential authors of Refs. [109, 229]. Portions of the astronomical community, however, were still not convinced of this conclusion [266]. In the late 1970s, this evidence was strengthened and corroborated by a series of new studies. In 1977, Nathan Krumm and Edwin Salpeter [191] observed six spiral galaxies with the Arecibo Observatory, and showed that they each exhibited a flat rotation curve out to radii larger than their optical extent, but these data turned out to be unreliable due to beam-smearing (see the discussion at the end of Ref. [270]).
In 1978, Albert Bosma published the results of his PhD thesis [60], including the radio observation of the velocity fields and corresponding rotation curves of 25 galaxies. This work convincingly proved that most of these objects had flat rotation curves out to the largest observed radius, which again exceeded the optical size of the galaxies, therefore demonstrating that their mass continued to grow beyond the region occupied by the stars and gas (see also Fig. 5).
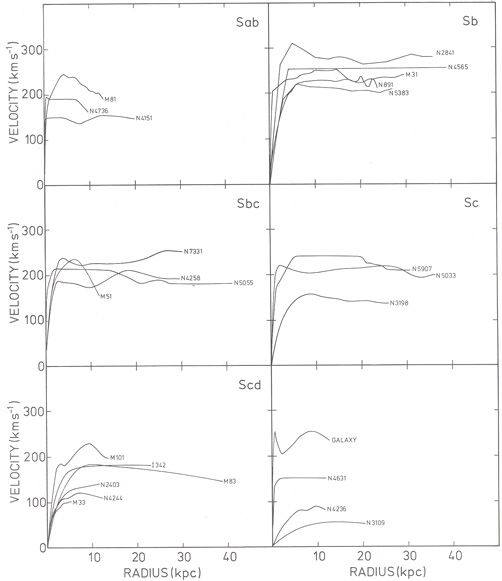 |
Figure 5. The rotation curves of the 25 galaxies published by Albert Bosma in 1978 [60]. |
A few months later, Rubin, Ford and Norbert Thonnard published optical rotation curves for ten high-luminosity spiral galaxies and found that they were flat out to the outermost measured radius [268]. This work has become one of the most well-known and widely cited in the literature, despite the fact that the optical measurements did not extend to radii as large as those probed by radio observations, thus leaving open the possibility that galaxies may not have dark matter halos, as pointed out, for example, by Agris J. Kalnajs in 1983 (see the discussion at the end of Ref. [150]) and by Stephen Kent in 1986 [175]. Rubin, Ford and Thonnard themselves acknowledged the credit that was due to the preceding analyses:
Roberts and his collaborators deserve credit for first calling attention to flat rotation curves. [...] These results take on added importance in conjunction with the suggestion of Einasto, Kaasik, and Saar (1974) and Ostriker, Peebles and Yahil (1974) that galaxies contain massive halos extending to large r.
A lucid and timely review of the status of galaxy masses and mass-to-light-ratios appeared in 1979, authored by Sandra Faber and John Gallagher [115]. We refer the reader to this excellent article for an overview of the various ideas that had been put forward in an effort to understand the complex and diverse observational data that was available at the time. The abstract of that article provides a clear indication of its contents:
The current status of the ‘missing mass' problem is reviewed on the basis of standardized mass-to-light (M/L) ratios of galaxies. The stellar mass density in the immediate vicinity of the sun is examined, along with the mass of the Milky Way and the M/L ratios of spiral galaxies, E and S0 galaxies, and binary galaxies. The dynamics of small groups of galaxies is investigated, and mass derivations for cluster galaxies are discussed. It is concluded that the case for invisible mass in the universe is very strong and becoming stronger.
We conclude this chapter with a brief overview of the efforts to determine the local dark matter density, i.e. the density of dark matter in the solar neighborhood. This quantity was historically important, as it provided the first – albeit rather weak – dynamical evidence for matter in the local Universe beyond visible stars. It is also important today, as the prospects for detecting dark matter particles in underground and astrophysical experiments strongly depend on this quantity.
As we have seen in the previous chapter, Kapteyn, Lindblad, Jeans and Oort had studied the dynamics of nearby stars, and compared the inferred gravitational mass with that of the visible stellar density. After decades of steady improvements (Oort 1932 [226], Hill (1960), Oort 1960 [227], Bahcall 1984 [32, 33]), Konrad Kuijken and Gerry Gilmore published a series of papers based on a refined method and a volume complete sample of K-dwarf data, to derive a much more precise value of the local density [192]. The advent of the Hipparcos, SDSS, and RAVE surveys has more recently triggered many new analyses. We refer the reader to the excellent review by Justin Read [253] for further details and references.
Alternatively, the local dark matter density can be constrained using measurements of the Milky Way's rotation curve (e.g. Fich et al. 1989 [122], Merrifield 1992 [212], Dehnen and Binney 1998 [89], Sofue et al. 2009 [298], Weber and de Boer 2010 [326], Catena and Ullio 2010 [76], Salucci et al. 2010 [271], Iocco et al. 2011 [166], Pato et al. 2015 [233]). Although rather precise determinations can be made using this approach, the results strongly depend on the assumptions one makes about the shape of the halo. Upcoming astronomical surveys – and in particular the Gaia satellite – are expected to lead to significant improvements in the reconstruction of the local density (Perryman et al. 2001 [243], Wilkinson et al. 2005 [338], Read 2014 [253], Silverwood et al. 2015 [292]).
 |
Figure 6. Timeline of local dark matter density measurements. See Read (2014) for further details and references [253]. |
3 Translation from the German by Lars Bergström. Back.
4 K. Freeman, private communication. Back.