


The most recent development in our understanding of the composition of the DGRB has focused on the study of its cross-correlation with other observables. For instance, the fraction of the DGRB that originates from extragalactic objects (whether astrophysical sources or DM halos) traces the LSS of the Universe, up to a maximal redshift that depends on the EBL attenuation. Thus, a certain level of cross-correlation is expected with any LSS tracer, e.g. the distribution of resolved galaxies [399, 73, 74, 70] or the gravitational lensing effect of cosmic shear [72, 71, 75]. These are new and independent observables that can complement the information inferred from the DGRB energy spectrum (see Sec. 2) or from its auto-correlation APS (see Sec. 3). Also, note that the gamma-ray sky-maps analyzed in Ref. [66] to measure the auto-correlation APS are noise dominated. Thus, even if it was still possible to report a significant auto-correlation signal by subtracting the photon noise, one may expect the cross-correlation with other signal-dominated quantities to be, in principle, very informative.
In the following sections, we present the formalism proposed to predict the cross-correlation of the DGRB with LSS tracers. We also summarize the data currently available. Sec. 5.1 focuses on the cross-correlation with galaxy catalogs, while in Sec. 5.2 we discuss the case of the cosmic shear. Sec. 5.3 presents the results of the cross-correlation of the DGRB with other observables.
5.1. The cross-correlation with galaxy catalogs
Ref. [399] was the first work that measured the 2-point correlation function of the Fermi LAT DGRB with 4 galaxy surveys, namely: i) the Sloan Digital Sky Survey (SDSS) Data Release 6 of optically-selected quasars from Ref. [425], ii) the IR galaxies of the 2 Micron All-Sky Survey (2MASS) Extended Source Catalog from Ref. [426], iii) the radio sources from the NRAO VLA Sky Survey (NVSS) [427] and iv) the luminous red galaxies in SDSS Data Release 8 from Ref. [428]. The authors of Ref. [399] analyzed 21 months of Fermi LAT data but no significant cross-correlation was observed. More recently, Ref. [70] have updated the analysis using 60 months of data and exploring also the cross-correlation with the main galaxy sample of SDSS Data Release 8 from Ref. [429]. The region with |b| < 30° around the Galactic plane was masked out, as well as the 1-degree region around the point sources in the 3FGL catalog. Both the Large and Small Magellanic Clouds were also left out of the analysis, together with the Fermi Bubbles and of the so-called Loop-I. A model for the diffuse Galactic foreground was subtracted from the sky maps. The residuals of the gamma-ray maps and the distribution of galaxies in the catalogs were re-binned into HEALPix maps with Nside = 512.
The authors computed both the cross-correlation APS and the 2-point correlation functions 43 using the PolSpice package 44. The signal region was defined between 0.1 and 100 degrees for the 2-point correlation function and between multipoles of 10 and 1000 for the cross-correlation APS. Three different energy thresholds were considered for the gamma rays, including all events above i) 500 MeV, ii) 1 GeV or iii) 10 GeV. The authors in Ref. [70] also validated their results against changes in the mask and in the model adopted for the diffuse Galactic foreground. They also tested their analysis pipeline on a simulated sky map with no signal.
The 2-point correlation functions are shown in Fig. 19 for the 5 different catalogs: a cross-correlation signal is evident up to few degrees for all the catalogs apart from the SDSS luminous red galaxies (rightmost central panel). The significance of these detections is 4.5σ for the SDSS quasars, 3.6σ for the 2MASS catalog, 3σ for the SDSS main galaxies and as large as 10σ in the case of NVSS. These numbers refer to the energy threshold that maximizes the detection significance, i.e. 500 MeV for the case of the SDSS quasars and 1 GeV otherwise. These are also the thresholds considered in the different panels of Fig. 19. The case of the cross-correlation with NVSS deserves some additional comments: the authors of Ref. [70] noticed that, for that catalog, the cross-correlation signal exhibits an angular extension that is consistent with the PSF of Fermi LAT. In particular, it decreases as the energy threshold increases. This suggests a different origin for the NVSS signal with respect to the one observed with the other catalogs. They also noted that a 1-halo component to the signal (see Sec. 3.2) would manifest itself as a Dirac delta at θ = 0 degrees, smeared up to the angular size of the Fermi LAT PSF. Such a 1-halo term would be present, for example, if some of the galaxies in NVSS emitted also in the gamma-ray band as well. Indeed, NVSS galaxies are standard candidates to be gamma-ray emitters and this catalog is routinely searched for counterparts of gamma-ray sources [115, 2]. With all these considerations in mind, the authors of Ref. [70] concluded that the 2-point correlation function with NVSS is probably contaminated by a 1-halo term and it does trace the LSS.
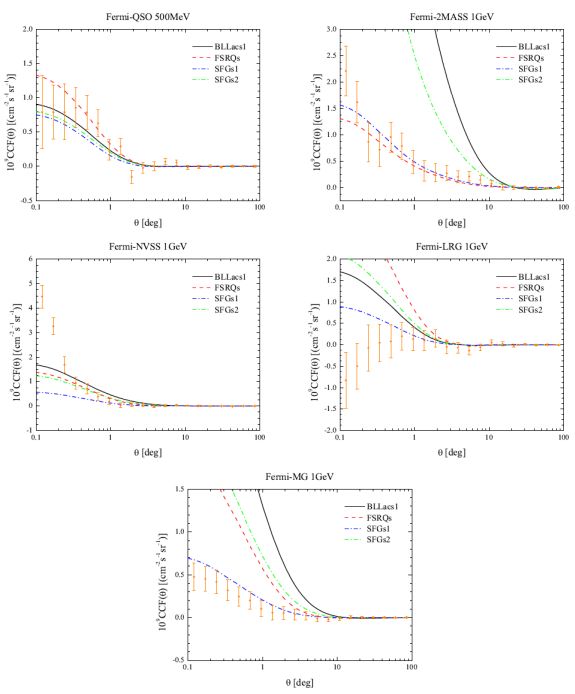 |
Figure 19. Upper left: 2-point cross-correlation function (orange data points) estimated from the SDSS Data Release 6 optically-selected quasars and the DGRB obtained from 60 months of Fermi LAT data at |b| > 30° and for E > 500 MeV. Errors bars represent the diagonal elements of the covariance matrix. Model predictions for different classes of sources are represented by continuous curves: FSRQs (red dashed), BL Lacs (black solid), two models of SFGs (blue and green dot-dashed). All predictions are obtained assuming that each source class contributes 100% of the DGRB intensity and they do not represent fits to the data. Upper right: same as in the previous panel but for the cross-correlation with the 2MASS Source Extended Catalog and for energies > 1 GeV. The other panels show the same as in the previous panel but for the NVSS catalog (medium left), luminous red galaxies in the SDSS Data Release 8 (medium right) and the main galaxy sample in the SDSS Data Release 8 (bottom). Note the different scale in the plots. Taken from Ref. [70]. |
In Ref. [70], the measured correlation functions are compared with the predictions obtained if the DGRB were contributed entirely by only one class of astrophysical sources. These theoretical predictions are included in Fig. 19 as colored lines. In particular, the dashed red line stands for FSRQs, modeled as in the luminosity-dependent density evolution scheme of Ref. [22], while the solid black is for BL Lacs, following the results of Ref. [23], see Sec. 2.2.1. The dot-dashed lines denote the case of SFGs, considering two different models: i) the gamma-ray emission of SFGs is assumed to follow the cosmic SFR, as in Ref. [31], and ii) the gamma-ray luminosity is related to the IR one through the Lγ − LIR relation obtained in Ref. [33] (see Sec. 2.2.3). The two scenarios are represented by the blue and green dot-dashed lines, respectively. Finally, we note that MAGNs are not included in the analysis of Ref. [70] as their emission is showed to be very similar (and, therefore, degenerate) with the contribution of SFGs. MAGNs, however, are explicitly included in the follow-up analysis of Ref. [430].
The 2-point correlation functions are, then, computed assuming that the fluctuations in the gamma-ray maps and in the galaxy distributions from the catalogs both trace the LSS matter density fluctuations (provide that the so-called bias factor is considered). This allows for the correlation functions to be determined in terms of the non-linear power spectrum of matter fluctuations, which can be obtained, e.g., by means of the public CAMB code [431] or Halofit routine [432].
We note that the cross-correlation expected from the classes of astrophysical sources mentioned above (colored lines in Fig. 19) is indeed different from zero at small angles, as in the observed signal. Whether the amplitude of the predicted correlation functions is in agreement with the data or not depends on the redshift overlap between the gamma-ray emitters and the sources in the catalogs. In particular, optically-selected quasars and sources in the NVSS catalog have a quite broad redshift distribution, extending to z ∼ 3-4. Thus, a large cross-correlation is expected with the emission from unresolved SFGs (modeled as in Ref. [31]), whose redshift distribution peaks at z ∼ 2−3. On the other hand, the luminous red galaxies and the objects in the 2MASS catalog probe the local Universe (respectively, from z ∼ 0.8 and z ∼ 0.3, and down to the present time) and they are characterized by narrower redshift distributions. Both are expected to correlate mainly with BL Lacs. Indeed, by considering several galaxy catalogs with different redshift distributions, one can effectively probe different redshift ranges, developing a full tomographic approach. Specifically, in Ref. [70], the authors build a model of the DGRB that includes FSRQs, BL Lacs and SFGs, leaving the normalization of the different components free to vary when fitting the cross-correlation data in Fig. 19. Ref. [70] shows that including the cross-correlation with SDSS quasars is crucial in deriving a lower bound on the contribution of SFGs. 45 These are, indeed, found to be the dominant component in the DGRB, with blazars accounting for, at most 10% of the total DGRB measured by Fermi LAT in Ref. [9] (at 1σ level). Also, depending on which description is assumed for the SFGs, the best-fit model to the cross-correlation data in Fig. 19 can account for only 70% or 20% of the total DGRB intensity.
The cross-correlation with galaxy catalogs can also be used to constrain the DM component of the DGRB. This possibility was studied in Refs. [73, 74], where the authors considered the 2MASS Redshift Survey [433] and the 2MASS Extended Source Catalog from Ref. [426]. These two catalogs are chosen against others because they trace the matter distribution in the local Universe and, therefore, they are expected to correlate with any potential DM-induced gamma-ray signal. The 2MASS Redshift Survey extends to z ∼ 0.1, while the 2MASS Extended Source Catalog peaks at z = 0.072 and does not contain galaxies beyond z ∼ 0.4. The Fermi LAT has detected most of the blazars in this volume, down to a very low sensitivity. Thus, unresolved blazars are not expected to exhibit a large cross-correlation with catalogs of the local Universe. 46 This means that the cross-correlation APS will be potentially very sensitive to other DGRB contributors, emitting mainly at low redshift as, e.g., SFGs or DM.
In Refs. [73, 74], galaxies are described by means of the so-called Occupation Distribution (HOD) model. This framework postulates that each source is embedded into a DM halo of mass M and that the abundance and distribution of galaxies are related to the properties of the host DM halos. The HOD model is a phenomenological formalism, based on results from N-body simulations and on semi-analytical descriptions of DM halos and galaxy formation [434, 201, 435]. Under this formalism, Ref. [73] shows that DM dominates the cross-correlation with the 2MASS Redshift Survey and that 5 years of Fermi LAT data should be able to distinguish a DM scenario from one with purely a strophysical sources. Ref. [74] also computes the upper limit that it would be possible to derive on ⟨ σ v ⟩ if the cross-correlation were found compatible with an astrophysical interpretation. These results, however, largely depend on the model adopted for low-mass DM halos and subhalos. In the most optimistic scenario, the cross-correlation will be able to exclude thermal cross sections for DM masses up to almost 1 TeV.
These predictions were tested against actual data in Ref. [436], where the authors explained the measured cross-correlation signal with the 2MASS Extended Source Catalog in Ref. [70] in terms of DM. They found that a WIMP DM particle with a mass in the range between 10 and 100 GeV (depending on the annihilation channel) and a thermal cross section can reproduce both the shape and intensity of the measured cross correlation. This is also the case for decaying DM candidates, for a similar range in DM mass and a decay lifetime between 5 × 1025 and 5 × 1027 s. The colored contours in Fig. 20 show the the regions in the (mχ, ⟨ σ v ⟩) and (mχ, τ) parameter spaces that are compatible with the cross-correlation found with 2MASS. The figure also shows how, for an annihilating DM candidate, a different assumption for the subhalo boost can shift the preferred contours by more than one order of magnitude.
 |
Figure 20. Left: 1σ and 2σ allowed regions for the DM annihilation rate versus DM mass, for different gamma-ray production channels and assuming the “LOW” substructure scheme in Ref. [62]. Crosses indicate the best-fit models. In the “HIGH” scenario of Ref. [62], regions remain similar in shape but they shift downward by a factor of ∼ 12 (star symbols). Right: The same but for decaying DM, showing the DM particle lifetime as a function of its mass. Taken from Ref. [436]. |
In addition, Ref. [436] used the measured cross-correlation to derive upper limits on ⟨ σ v ⟩, by requiring that the DM-induced correlation function do not to over-produce the data. This allowed Ref. [436] to exclude thermal annihilation cross sections for DM masses below 100 GeV (in the case of annihilations into b quarks and a “LOW” subhalo boost model inspired by Ref. [62]). This makes the cross-correlation with local galaxy catalogs the strongest observable up to date to constrain a potential DM contribution to the DGRB, compared to the DGRB energy spectrum reported in Ref. [9] or the auto-correlation APS in Ref. [66].
Astrophysical and DM-induced emissions are considered at the same time in Ref. [430]: the authors define a model of the DGRB that includes FSRQs, BL Lacs, SFGs, MAGNs (parametrized according to Refs. [22, 23, 161, 29], respectively) and annihilating DM. The galaxy catalogs are described following the HOM formalism. The normalizations of the emission of the 4 mentioned astrophysical source classes are left free in the model, as well as the DM mass and annihilation cross section. 5 additional parameters are included, one for each class of gamma-ray emitters, accounting for possible 1-halo terms in the 2-point correlation functions. The model is, then, used to fit the measured cross-correlation reported in Ref. [70]. As expected, the posterior probability distribution function for the intensity of the 1-halo term points towards a value different than zero, in the case of the cross-correlation with NVSS. The distributions are compatible with zero for the other catalogs.
Fig. 21 summarizes the probability distributions of the remaining 5 free parameters (excluding mχ). An examination of this figure makes evident that the interpretation of the cross-correlation data is affected by significant degeneracies: there is a mild indication of a peak in the probability distribution of the normalizations of MAGNs (AmAGNs in Fig. 21) and of the DM component (ADM, proportional to ⟨ σ v ⟩), but, otherwise, the data effectively just enforce upper limits on the other parameters. The degeneracy is particularly visible between AmAGNs and ADM in the fourth panel of the bottom row of Fig. 21. Nevertheless, the measured cross correlations are still able to provide stringent uppers limit on the DM component, as it can be seen in Fig. 22. The regions above the solid lines are excluded as they would over-produce the 2-point correlation functions measured above 500 MeV (yellow line), 1 GeV (cyan line), 10 GeV (green). The red solid line indicates the upper limit obtained from the combined analysis of the data sets for the three mentioned energy thresholds. These results are all obtained by adopting the assume a “LOW” subhalo boost. Note that, even for such a moderate description of low-mass DM structures, the inferred DM limits are more stringent than those obtained in Ref. [64] by studying the DGRB intensity or those derived from the DGRB auto-correlation APS in Ref. [420]. 47 In the case that a “HIGH” subhalo boost were adopted instead, the upper limit on the DM annihilation cross section would improve by roughly one order of magnitude (dash-dotted black line in Fig. 22). On the contrary, in an overly conservative scenario in which no substructures are present below Mmin = 107 M⊙, the exclusion worsen by a factor ∼ 4−5 (blue dash-dotted line).
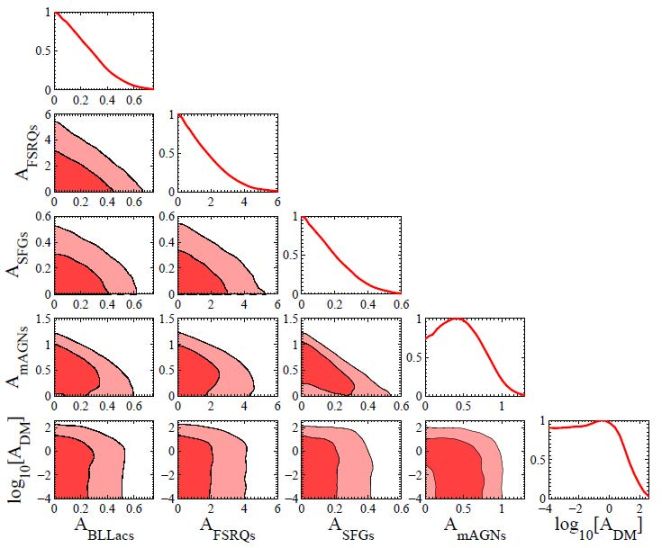 |
Figure 21. Posterior probability distributions for the normalization of the component to the DGRB due to FSRQs (AFSRQs), BL Lacs (ABLLacs), SFGs (ASFGs), MAGNs (AmAGNs) and annihilating DM (ADM). These parameters are defined with respect to a fiducial model introduced in Ref. [430]. Panels along the diagonal show the marginalized 1-dimensional probability distribution for each parameters. All the others indicate the 1σ (darker, innermost) and 2σ (lighter, outermost) confidence level contours in the probability distributions of the different combinations of parameters. The full model contains a total of 11 free parameters, but only the 5 mentioned above are shown in this figure. Taken from Ref. [430]. |
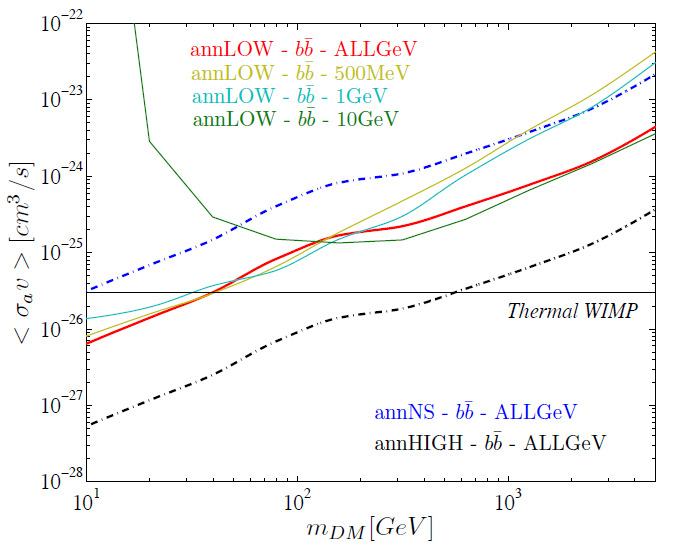 |
Figure 22. 95% confidence limit upper bounds on the DM annihilation rate ⟨ σ v ⟩ as a function of the DM mass, for the “LOW” substructures model of Ref. [62] and the reference NVSS-10 A1hk ≠ 0 fit (see Ref. [430] for details). Solid lines refer to the bb annihilation channel: the red line refers to the analysis that combines information from all the three energy bins under consideration (i.e. E > 0.5, 1 and 10 GeV), while the other three lines refer to the analysis performed on a single energy bin (as stated in the figure label). The upper dot-dashed blue line refers to the “NS” substructure model, where halos do not have substructures and Mmin = 107 M⊙. The lower dot-dashed black line, instead, representto the “HIGH” substructure model, inspired by Ref. [62]. Taken from Ref. [430]. |
As already hinted at in Ref. [70], the authors of Ref. [430] noted that the models that provide a good fit to the cross-correlation data fall short of accounting for the intensity of the DGRB: above 1 GeV, in the most likely scenario, the model is able to explain only ∼ 30% of the DGRB intensity measured by Fermi LAT in Ref. [9]. Note, though, that multiple reasons can be invoked to explain this apparent discrepancy, e.g. uncertainties in the modeling of the Galactic diffuse foreground when performing the measurement of the DGRB intensity, and/or uncertainties in the model predictions. Another possibility is the presence of a Galactic component in the DGRB that, therefore, does not correlate with the LSS. In this regard, Galactic DM would be a plausible and interesting candidate (see, e.g., Ref. [64] for further discussion on this issue).
5.2. The cross-correlation with cosmic shear
Another tracer of LSS is the gravitational lensing effect of cosmic shear. Due to lensing, the light emitted by distant sources is distorted while it propagates towards us by the presence of intervening matter. In the weak lensing regime, the effect is very small and it is directly related to the distribution of matter at large scale. The signal, referred to as cosmic shear, is expected to cross-correlate with the gamma-ray emission since the same structures responsible for light bending are also those producing the gamma-ray emission, either because they emit light themselves (through DM annihilation or decay) or because they host the astrophysical emitters.
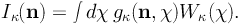
The gravitational distortion can be evaluated on the null-geodesic of the unlensed photon. It can be decomposed into the so-called convergence κ and shear γ [437, 438]. In the flat-sky approximation (i.e. small distortion angles), κ and γ share the same APS and, for convenience, we focus only on the former from now on. The convergence κ is a direct estimator of the fluctuations in the Newtonian potential of the LSS, integrated along the line of sight. κ can be estimated via a statistical analysis of the correlations in the ellipticities of the images of galaxies. Thanks to Poisson’s equation, which links the gravitational potential to the matter distribution, the intensity of the cosmic shear signal Iκ(n) from a direction n can be written as follows:
 |
(40) |
The decomposition of Iκ(n) resembles the way we expressed the gamma-ray emission in Eq. (28): the source field gκ(n, χ) indicates directly the distribution of matter and it is modulated by the window function. The product of the average source field ⟨ gκ(χ) ⟩ and the window function can be expressed as follows:
 |
(41) |
where dNg / dχ′ is the redshift distribution of the background galaxies, normalized to 1 over the observed redshift range.
As done in Sec. 3, the gamma-ray emission associated with a certain population X is written in terms of its window function WX(χ) and of the source field gX(χ, n) as IX(n) = ∫dχ gX(χ, n) WX(χ). The average source field ⟨ gX(χ) ⟩ depends on the abundance of sources as a function of their Y-parameter and of redshift (see Eq. (29)). Similarly to Eq. (32), the cross-correlation APS between the gamma-ray emission produced by population X and the cosmic shear can be written as [406, 74]:
 |
(42) |
The 3-dimensional cross-correlation power spectrum PX, κ can be split into the following 1-halo and 2-halo terms:
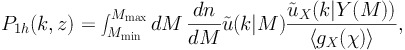 |
(43) |
 |
(44) |
The quantity  (k|M) is the Fourier transform of the
radial density profile of a DM halo with mass M, while
X(k|Y(M)) is the
Fourier transform of the gamma-ray surface brightness profile of the source
characterized by parameter Y. Note that these equations depend on
the Y(M) relation that links the Y-parameter to the
mass of the host DM halo. For astrophysical sources, Y is usually
taken to be the gamma-ray luminosity Lγ. Ref.
[75]
determines the Lγ(M) empirically
for the case of blazars, SFGs and MAGNs, making use of correlations between
different source properties or of the results of semi-analytical models.
However, the Lγ(M) remains very uncertain
for all the source classes considered in Ref.
[75].
Its uncertainty can become an issue when estimating the
cross-correlation APS CℓX,
κ. However, in the case of astrophysical sources,
CℓX, κ is dominated by the 2-halo
term (at least up to multipoles as large as few hundreds), while the
Lγ(M) relation mainly affects the 1-halo
term.
48
The uncertainty on CℓX, κ
generated by the variability of Lγ(M)
can be seen in the left panel of Fig. 23. The
different solid lines show the expected cross-correlation APS for different
classes of astrophysical sources (red for blazars, orange for SFGs and pink
for MAGNs), while dashed lines indicate how the cross-correlation APS
changes for two extreme scenarios bracketing our lack of knowledge on
M(Lγ). The uncertainty bands are within a
factor of 2 from the solid lines, at least at high multipoles. They
increase in size at smaller angular scales (i.e. large ℓ), since
the APS becomes more sensitive to the 1-halo term.
(k|M) is the Fourier transform of the
radial density profile of a DM halo with mass M, while
X(k|Y(M)) is the
Fourier transform of the gamma-ray surface brightness profile of the source
characterized by parameter Y. Note that these equations depend on
the Y(M) relation that links the Y-parameter to the
mass of the host DM halo. For astrophysical sources, Y is usually
taken to be the gamma-ray luminosity Lγ. Ref.
[75]
determines the Lγ(M) empirically
for the case of blazars, SFGs and MAGNs, making use of correlations between
different source properties or of the results of semi-analytical models.
However, the Lγ(M) remains very uncertain
for all the source classes considered in Ref.
[75].
Its uncertainty can become an issue when estimating the
cross-correlation APS CℓX,
κ. However, in the case of astrophysical sources,
CℓX, κ is dominated by the 2-halo
term (at least up to multipoles as large as few hundreds), while the
Lγ(M) relation mainly affects the 1-halo
term.
48
The uncertainty on CℓX, κ
generated by the variability of Lγ(M)
can be seen in the left panel of Fig. 23. The
different solid lines show the expected cross-correlation APS for different
classes of astrophysical sources (red for blazars, orange for SFGs and pink
for MAGNs), while dashed lines indicate how the cross-correlation APS
changes for two extreme scenarios bracketing our lack of knowledge on
M(Lγ). The uncertainty bands are within a
factor of 2 from the solid lines, at least at high multipoles. They
increase in size at smaller angular scales (i.e. large ℓ), since
the APS becomes more sensitive to the 1-halo term.
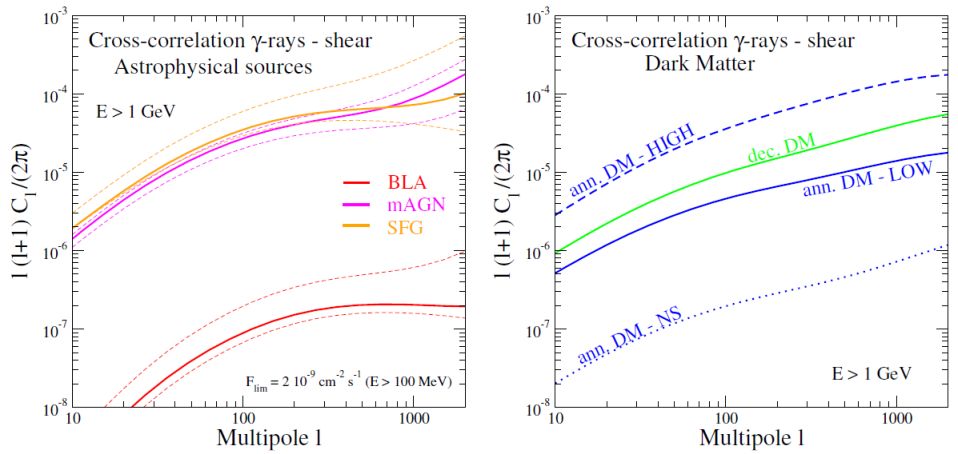 |
Figure 23. Left: Cross-correlation APS between cosmic shear and gamma rays from blazars (red), MAGNs (pink), and SFGs (orange). Among the curves with the same color, different lines correspond to different choices for the Lγ(M) relation: solid lines represent the fiducial models considered in Ref. [75], while dashed ones indicate extreme scenarios assumed to bracket the uncertainty on Lγ(M). Right: Cross-correlation APS between cosmic shear and DM-induced gamma-ray emission. Blue lines correspond to an annihilating DM candidate and the green one to a decaying DM candidate. The different blue lines represent different scenarios for low-mass DM (sub)halos (see Ref. [75] for details). The mass of the DM particle is taken to be 100 GeV (200 GeV) in the case of annihilating (decaying) DM. The annihilation cross section is fixed at 3 × 10⁻²⁶ cm3 s−1 and the decay lifetime at 3 × 1027 s. Annihilations and decays entirely into bb are assumed. Taken from Ref. [75]. |
The left panel of Fig. 23 also demonstrates that the expected cross-correlation between cross-correlation and the emission of unresolved blazars is more than 2 orders of magnitude smaller than the one with the other classes of astrophysical sources in Ref. [75], i.e. SFGs and MAGNs. As commented in the previous section, this is because the Fermi LAT has detected most of the blazars populating the volume probed by cosmic shear (i.e. z ≲ 2 [75]) and, thus, the window functions Wblazars(χ) and Wκ(χ) do not overlap significantly. On the other hand, only a limited number of MAGNs and SFGs have been observed by the Fermi LAT (see also Secs. 2.2.2 and 2.2.3), so that the emission of their unresolved counterparts is still characterized by a notable cross-correlation with the lensing signal.
The right panel of Fig. 23 shows the expected cross-correlation APS with the gamma-ray emission produced by annihilating DM (blue lines) or decaying DM (green line). Different blue lines corresponds to different models for the description of low-mass DM halos. As seen in the previous sections, this uncertainty can have a significant impact on the properties of the DM-induced emission. Ref. [75] estimates that different description of the DM (sub)halos below the mass resolution of N-body simulations can lead to an uncertainty as large as a factor of 100 on the expected cross-correlation APS. 49 In the most optimistic scenario considered in Ref. [75], the cross-correlation APS from annihilating DM is of the same order of that expected from astrophysical sources. This demonstrates how effective this observable can be for the detection of the DM component in the DGRB.
Ref. [75] estimates that the measurement of the cross-correlation between the data of the Dark Energy Survey [439] and those of the Fermi LAT (after 5 years of operation) has the potential to detect an annihilating DM particle with an annihilation cross section smaller that the thermal value of 3 × 10⁻²⁶ cm3 s−1 for DM masses up to 300 GeV (for annihilations into b quarks). The result refers to a very optimistic subhalo boost and the predicted signal decreases by a factor of ∼ 10 in the case of a more realistic description of DM subhalos (see right panel of Fig. 23. Prospects improve significantly with the inclusion of data from the forthcoming Euclid mission (expected for 2020) [440, 441]. Indeed, the cross correlation of Euclid data with those of a hypothetical future gamma-ray telescope with improved performances with respect to the Fermi LAT 50 has the potential to detect a DM component for DM masses up to the TeV scale (assuming a thermal annihilation cross section and an optimistic subhalo boost).
Such an optimal prospect for a DM detection is possible thanks to the “tomographic spectral approach” employed in Ref. [75], which combines spectral information with the study of the dependence of CℓX, κ on redshift (i.e. tomography). Such a technique provides an excellent sensitivity to DM-induced emission, even if the intensity or auto-correlation APS of such a component are only subdominant.
The first (and, to date, only) measurement of the cross-correlation between DGRB and cosmic shear is performed in Ref. [71]. The authors make use of the data of CFHTLens from Ref. [442]. The survey detected more than 5 million galaxies in 4 patches, covering an area of 154 square degrees. The corresponding shear signal is correlated in Ref. [71] with 65 months of Fermi LAT data from the same region in the sky. Only photons between 1 and 500 GeV are considered in the analysis. A model for the diffuse Galactic foreground (determined in Ref. [71] from the gamma-ray data) is subtracted from the total gamma-ray emission and 2FGL sources are masked, before computing the cross-correlation.
The estimator considered in Ref. [71] for the 2-point correlation function is
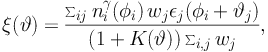 |
(45) |
where niγ is the number of gamma rays in the pixel centered on direction φi, and єj is the shear-induced tangential ellipticity in pixel φj = φi + ϑj. The factors wj and K(ϑ) depend on the precision in the estimation of єj (see Refs. [443, 71]) and the sum runs over all the pairs of pixels available. Fig. 24 shows the 2-point cross-correlation function (binned in 10 logarithmic bins with Δ log10 ϑ = 0.2) for the 4 CFHTLenS sky patches. The measured 2-point correlation function using Eq. (45) are showed in red, while the black points are obtained from another shear component rotated by 45° with respect to the tangential one. In the case of a perfect measurement of the shape of the galaxies and of no intrinsic alignment, there should be no cross-correlation with this rotated data set. Thus, the black points in Fig. 24 represent a control sample with no cross-correlation. Note that black and red points in Fig. 24 are compatible with each other within errors, proving that no significant cross-correlation is present between CFHTLenS and Fermi LAT. This result can be translated into an upper limit on the DM annihilation cross section as a function of its mass. Ref. [71] excludes cross sections as low as the thermal value of 3 × 10⁻²⁶ cm3 s−1 for DM masses smaller than ∼ 10 GeV (in the case of annihilation into τ+τ− and of the optimistic subhalo boost model of Ref. [276]).
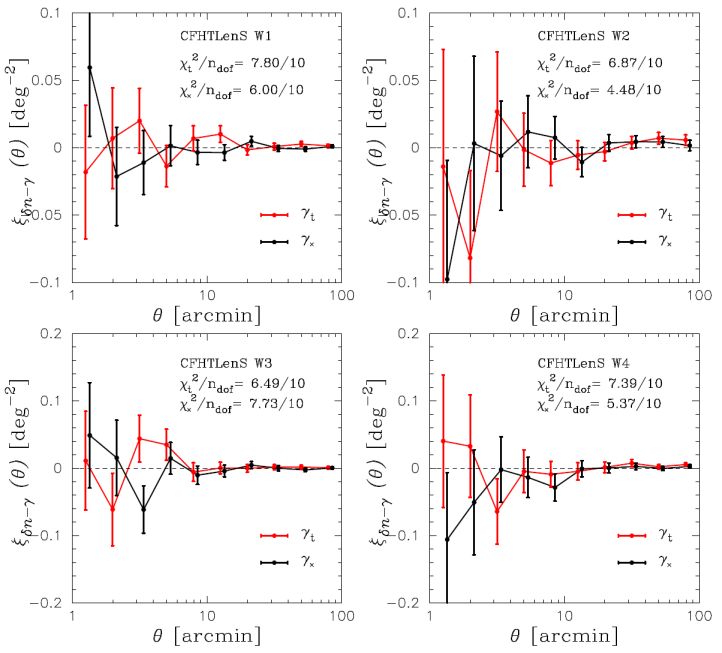 |
Figure 24. The cross-correlation signal of cosmic shear and the DGRB. The 4 panels corresponds to the 4 sky-patches W1-W4 covered by CFHTLenS. Red points show the results obtained using tangential shear (indicated as γt), while black points are for a component of the shear (γ× in the legends) rotated by 45° with respect to γt. The error bars indicate the standard deviation, estimated from 500 randomized shear catalogs. The χ2 quantifies the significance of the signal with respect to the statistical error. Taken from Ref. [71]. |
5.3. The cross-correlation with other tracers
In addition to galaxy catalogs and cosmic shear, it is also possible to consider other observables that trace the LSS of the Universe. Below, we highlight some of these studies.
Ref. [399] cross-correlates the DGRB inferred from the first 21 months of Fermi LAT data with the CMB measured by WMAP7 [444]. Such a measurement has the potential to probe the properties of dark energy through the detection of the so-called integrated Sachs-Wolfe effect [445]. This arises when the LSS gravitational potential changes with time during a cosmic era dominated by dark energy, as, e.g., in the local Universe. Additional anisotropies are induced in the CMB, which are expected to correlate with the LSS and, thus, potentially with the DGRB. In Ref. [399], the 2-point correlation function is computed, similarly to what was done for galaxy catalogs in Sec. 5.1. Their results are compatible with a null detection, due to the large statistical errors. 51 Overall, Ref. [399] shows that the goal of detecting the integrated Sachs-Wolfe effect by cross-correlating the DGRB with the CMB is not unrealistic, but beyond the reach of the limited gamma-ray sample considered in Ref. [399].
More recently, Ref. [446] computed, for the first time, the cross-correlation of the DGRB with the so-called “lensing potential” of the CMB: the gravitational lensing induced by LSS imprints some distortions on the anisotropy pattern of the CMB, in such a way that the radiation detected by the Planck satellite [447] today is not exactly the one emitted at recombination. A statistical analysis of the non-Gaussianity of the CMB allows to reconstruct the lensing potential responsible for such perturbations [448, 449, 450]. The first all-sky map of the CMB lensing potential has been recently reported by the Planck collaboration [451]. The signal is mainly contributed by structures at z ∼ 2 and it exhibits an auto-correlation APS that peaks at ℓ ∼ 20−30.
Ref. [446] cross-correlates the sky-map of the CMB lensing potential with 68 months of Fermi LAT data, after having removed the diffuse Galactic emission. Six energy bins are considered, between 700 MeV and 300 GeV. The region at |b| < 25° along the Galactic plane and a 1°-circle around each source in the 2FGL are masked, together with the baseline 70% Galactic mask from Ref. [451]. The signal region is defined between ℓ = 40 and 400. A detection with a significance of 3.2σ is reported in the low-multipole region (ℓ < 160). No signal is present above ℓ = 160 (see data points in Fig. 25). The signal at low multipoles is compared to the predicted cross-correlation between the lensing potential and the gamma-ray emission from 4 classes of unresolved sources, namely FSRQs, BL Lacs, SFGs and MAGNs. The LFs of these populations are fixed to the best-fit models from Refs. [22, 23, 29, 164, 33] (see Secs. 2.2.1, 2.2.2 and 2.2.3). The combined emission of these 4 source classes (solid black line in Fig. 25) reproduces fairly well the experimental data. More precisely, BL Lacs, SFGs and MAGNs (red, orange and green lines in Fig. 25, respectively) contribute more or less in equal parts to the cross-correlation signal, while FSRQs (blue line) are subdominant. This model also provides a good fit to the DGRB energy spectrum and auto-correlation APS.
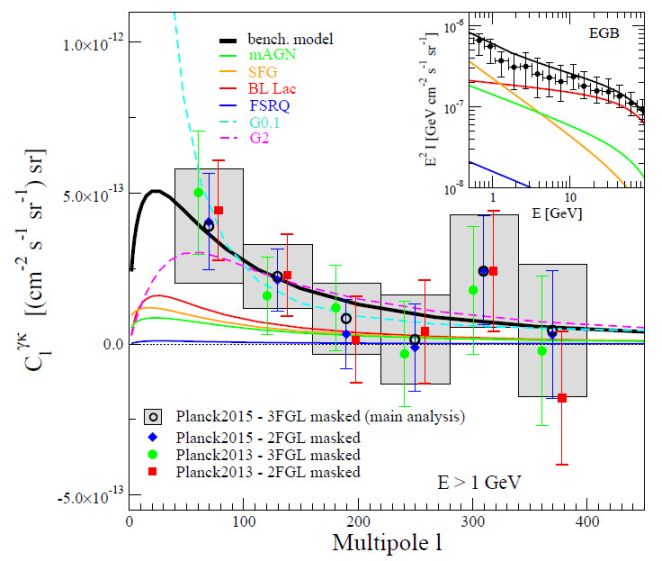 |
Figure 25. Cross-correlation APS Cℓγκ between the DGRB and the CMB lensing potential, as a function of the multipole ℓ, for gamma-ray energies E > 1 GeV. The measurement is averaged (linearly in terms of ℓ Cℓγκ) in multipole bins of Δℓ = 60, starting at ℓ = 40. Points report the minimum-variance combination of the measurement in the individual energy bins (assuming a spectrum ∝ E−2.4), as described in Ref. [446]. Four different analyses are shown. They arise from the combination of two lensing maps (from the 2013 and 2015 release of Planck data) and two gamma-ray point-source masks (masking sources in 2FGL or 3FGL). The benchmark theoretical model, shown in black, is the sum of the contributions from BL Lacs (red), FSRQs (blue), MAGNs (magenta) and SFGs (orange), multiplied by a normalization factor Aκγ = 1.35. Two generic models (labeled “G0.1” and “G2”) with Gaussian window functions are also shown. The peak of the Gaussian is at z0 = 0.1 (z0 = 2), with a dispersion σz = 0.1 (σz = 0.5) for G0.1 (G2). In the inset, the intensity energy spectrum is shown for the Fermi LAT measurement (black data point, labeled “EGB”) and for the model predictions. Taken from Ref. [446]. |
43 We note that the two are related by a Fourier transform and they contain the same information. However, they probe different scales with different efficiency and, thus, it is interesting to consider both. Back.
44 http://www2.iap.fr/users/hivon/software/PolSpice/ Back.
45 Note that this lower bound is found only if SFGs are modeled according to Ref. [31]. Back.
46 In other words, the window function of unresolved blazars does not overlap significantly with that of the 2MASS catalogs considered above. Back.
47 These limits are sensitive to the way the 1-halo terms are implemented. See Ref. [430] for details. Back.
48 The Lγ(M)
relation enters in the computation of the 2-halo term only through the bias
factor, bX(Y(M)), which is, generally,
of  (1).
Back.
(1).
Back.
49 Note, however, that the “NS” model (dotted blue line in Fig. 23) is probably underestimating the signal from DM since it assumes no contribution from DM subhalos and a quite large Mmin = 107 M⊙. On the other hand, the “HIGH” scenario (dashed blue line) is based on power-law extrapolations from Ref. [276] and, thus, it likely overestimates the DM signal (see Sec. 2.3). Back.
50 This improved version the Fermi LAT is described by a wide energy range, i.e. from 300 MeV to 1 TeV. It is also assumed to achieve ∼ 2.5 times more exposure (defined in Ref. [75] as the product of the effective area and the observation time) than 5 years of Fermi LAT data and to drastically improve the angular resolution to a value of 0.027° over the whole energy range. Its field of view is similar to that of the Fermi LAT. Back.
51 The lack of a significant detection is compatible with the expectation if the DGRB is composed by unresolved sources (parametrized as in Ref. [399]). Back.