
|
| © CAMBRIDGE UNIVERSITY PRESS 2000 |


7.3 Growth of structure: peculiar motions
We have just described the expansion of a uniform cosmos: the locations of all galaxies are fixed by their comoving coordinates, which do not change as they recede from each other. But the real Universe contains denser and more tenuous regions; the extra pull of gravity toward the denser parts will pull in yet more material. Peculiar motions develop, in addition to the cosmic expansion. In this section, we look at how denser regions of the Universe have become denser and voids more rarified, and how the galaxies acquired the motions we observe today.
Peculiar velocities tend to die away as the Universe expands, because a
moving galaxy keeps overtaking others,
until it reaches the region where
its motion matches that of the cosmic expansion.
We can imagine two nearby comoving observers, P and Q;
they are at rest relative to the background radiation, and
recede from each other only because of cosmic expansion.
A galaxy passes observer P, with a peculiar motion
Vpec toward Q; if P and Q are close enough that
Vpec >> H(t) d,
their separation remains almost constant as the galaxy travels between
them, taking a time  d
/ Vpec to arrive.
But relative to observer Q, the galaxy moves only at speed
Vpec - H(t) d. The galaxy's speed, relative to
a comoving
observer at its current position, has decreased at the rate
d
/ Vpec to arrive.
But relative to observer Q, the galaxy moves only at speed
Vpec - H(t) d. The galaxy's speed, relative to
a comoving
observer at its current position, has decreased at the rate
| (7.24) |
Integrating this shows that Vpec
 1 /
1 /
 (t);
a galaxy's peculiar velocity Vpec falls in exactly the
same way
as the momentum of a photon is reduced, according to Equation 7.11.
(t);
a galaxy's peculiar velocity Vpec falls in exactly the
same way
as the momentum of a photon is reduced, according to Equation 7.11.
The best-measured peculiar motion is that of the Local Group,
determined from the Sun's velocity
relative to the cosmic microwave radiation: recall Section~1.5.
The Local Group now moves with Vpec
630 km s-1 in the
direction (l, b)
(276°, 30°).
If its peculiar velocity had decreased according to Equation 7.24,
then at redshift z ~ 1000, the gas clouds from which it was made
would have been moving close to the speed of light. But we will see
in Section 7.4 that the sound speed was
then only a few kilometers per
second. Even if they had been accelerated to relativistic speeds,
the fast-moving clouds would have lost their energy in huge shock
waves. In fact, the peculiar motions of the galaxies have been
generated quite recently, by their mutual gravitational attraction.
|
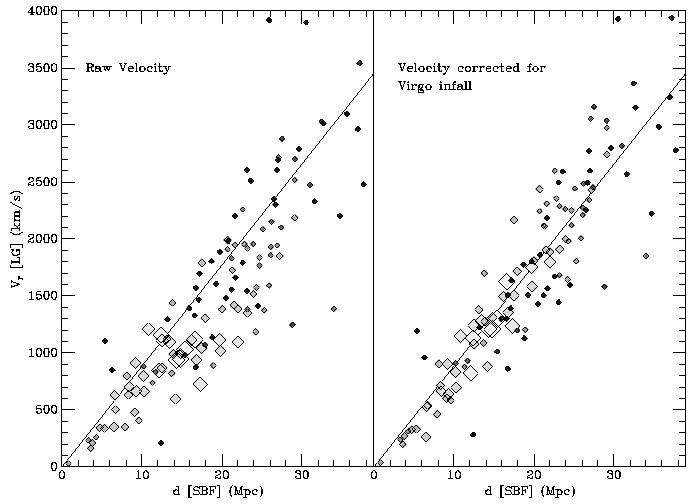
Figure 7.8. Diamonds show average recession speed Vr, measured relative to the Local Group, for groups of galaxies in Figure 7.2. The two largest white symbols are two clumps within the Virgo cluster; others decrease in size to show distance from Virgo. Left, velocity Vr falls further below the linear trend, the closer the group is to Virgo; right, after correction for Virgocentric infall - J. Tonry. |
We can study the peculiar motions of the nearby elliptical galaxies by looking at Figure 7.2. Although the Fornax cluster is roughly as far away as the Virgo cluster, the galaxies of Fornax on average are moving more rapidly away from us. It appears that the Local Group, and the galaxies nearby, are falling toward the complex of galaxies around Virgo. To examine the Virgocentric infall, we look at the average radial velocity with which each group of galaxies in Figure 7.2 recedes from us. The peculiar velocities of individual galaxies are affected by their orbits within the group, but averaging over the whole group should reveal the larger-scale motions. These velocities are plotted in the left panel of Figure 7.8. The two largest white symbols represent the two clumps of Virgo cluster galaxies, around M86 and M49. The other big symbols, indicating groups close to Virgo, fall below the general linear trend.
Peculiar motions complicate our attempts to measure
H0. If we tried
to do this by finding distances and velocities of galaxies in the
direction of Virgo, we would underestimate the Hubble constant,
because Virgocentric inflow partially cancels the cosmic expansion.
But if we had observed galaxies in the opposite direction, our value
for H0 would be too high. The basic difficulty of
measuring galaxy
distances, along with peculiar motions, has defeated our efforts to
pin down H0 more accurately than the rather broad
range 40 km s-1 Mpc-1
 H0
80 km s-1
Mpc-1.
H0
80 km s-1
Mpc-1.
The right panel of Figure 7.8 shows the result
of subtracting
out Virgocentric inflow according to a simple model, which predicts
an infall speed of 270 km s-1 at our position. We now see roughly
Vr d.
Within about 25 Mpc of Virgo, most of the plotted values deviate from
the mean by less than 100 km s-1. Both the local velocity
dispersion and
the Local Group's motion toward the Virgo cluster are significantly
less than our measured speed of ~ 600 km s-1 through the
cosmic microwave
background. The flow of galaxies through space is `cold' on small
scales: galaxies within tens of megaparsecs of each other share a
large fraction of their peculiar velocity.
Most of the Local Group's peculiar motion must be caused by the gravitational pull of very distant matter, tugging at both the Virgo cluster and the galaxies of Figure 7.2. Another indication that more distant mass concentrations cause significant peculiar motion is that the velocities of galaxies furthest from the Virgo cluster, which are mostly on the opposite side of the sky, lie mainly above the sloping line in the right panel of Figure 7.8.
Problem 7.13: Here you use Monte Carlo simulation to show that the peculiar velocities of nearby galaxies must be very close to that of the Milky Way, or Hubble could never have discovered the cosmic expansion from his sample of 22 local galaxies.
Your model sky consists of galaxies
in regions A (1 Mpc < d < 3 Mpc), B (3 Mpc < d < 5 Mpc),
C (5 Mpc < d < 7 Mpc), and D (7 Mpc < d < 9 Mpc).
If the density is uniform, and you have four galaxies in region B,
how many are in regions A, C and D (round to the nearest integer)?
For simplicity, put all the objects in region A at d = 2 Mpc, in B
at 4 Mpc, in C at 6 Mpc, and in D at 8 Mpc.
Now assign peculiar velocities at random to the galaxies.
For each one, roll a die, note the number
N on the upturned face, and give your galaxy
a radial velocity Vr = H0 d
+ (N - 3.5) Plot Vr against the distance d; is there a clear trend? How many of your model galaxies have negative radial velocities? Hubble found no galaxies beyond the Local Group that are approaching us. |
 ;
take the dispersion
;
take the dispersion