2MASS Point Source Catalog
(Latest revision: 24 July 2018)
Data
The 2MASS Point Source Catalog (PSC) contains positional and photometric
infomation for 470,992,970 compact sources
extracted from the
Two Micron All Sky Suvey (2MASS)
imaging data, in the near-infrared J (1.25 microns), H (1.65 microns)
and Ks (2.16 microns) bands. The 10-sigma point
source detection level is better than 15.8, 15.1 and 14.3 mag at the J,
H, and Ks bands, respectively.
Details on the survey and data products can be found in the
2MASS Explanatrory Supplement.
NED Nomenclature
Format: 2MASS JHHMMSSss+/-DDMMSSs
Example: 2MASS J04375556-0931094
Processing Notes
Photometry, astrometry, and nomenclature for 471 million sources in the
2MASS PSC were integrated into NED using the latest data ingestion and
cross-matching pipeline. A brief overview of the process is as follows:
- Analysis of the orginal catalog content
- Production of a configuration file that maps original catalog fields
into the NED database schema
- Ingestion of essential data and metadata including coordinates,
selected magnitudes, and their uncertainties
- Assignment of unique NED source IDs and population of the NED Source
Directory to prepare the incoming catalog sources for cross-matching
- A trial run of approximately 1 million sources through NED's Catalog
Integration Pipeline, which includes
MatchEx, to determine whether each
source is a cross-ID, has possible
matches (associations), or has no match with prior objects in NED.
- Vetting of the object-source match (OSM) results for the trial run
and selection of final match parameters
- Running all catalog sources through the pipeline, resulting in
promotion of each incoming source into the NED Object Directory and
fusion of new measurements from the 2MASS PSC with prior data for
objects determined to have reliable cross-IDs
- Inspection and analysis of the outcome and (incremental) releases of
the results
In November 2017, the team released the results of cross-matching 150
million sources (32% of the entire catalog) located at declination south
of -37 degrees. Among those 2MASS PSC sources, 92% were new objects to NED,
and 8% had new cross-identifications with prior NED objects, including the
fusion of their photometric data into object SEDs. Cross-matching and data
fusion for the rest of the catalog was performed in the Production database
and completed in May 2018. This was followed by a period of verification
and validation, and completion of data management and system engineering
required to prepare the vastly expanded database for release to the
public. The results of integrating the entire 471 million sources into
NED was released in July 2018. The tables and graphics below
characterize the results.
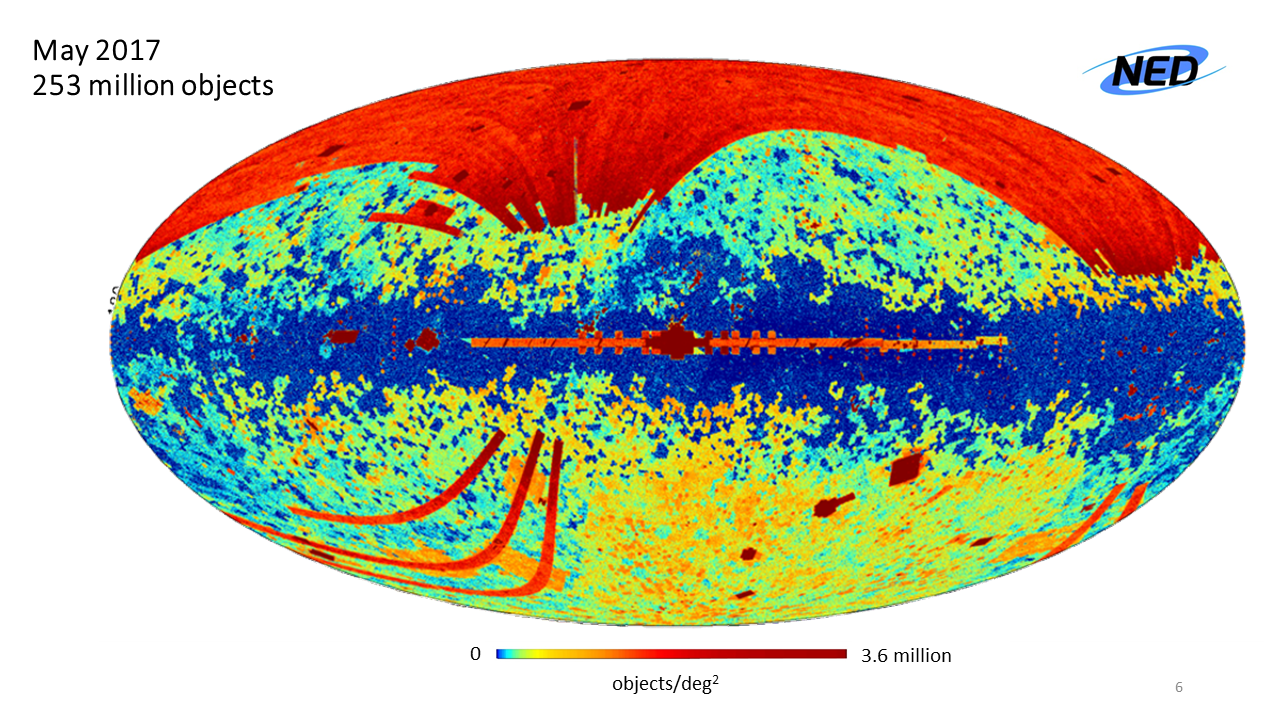
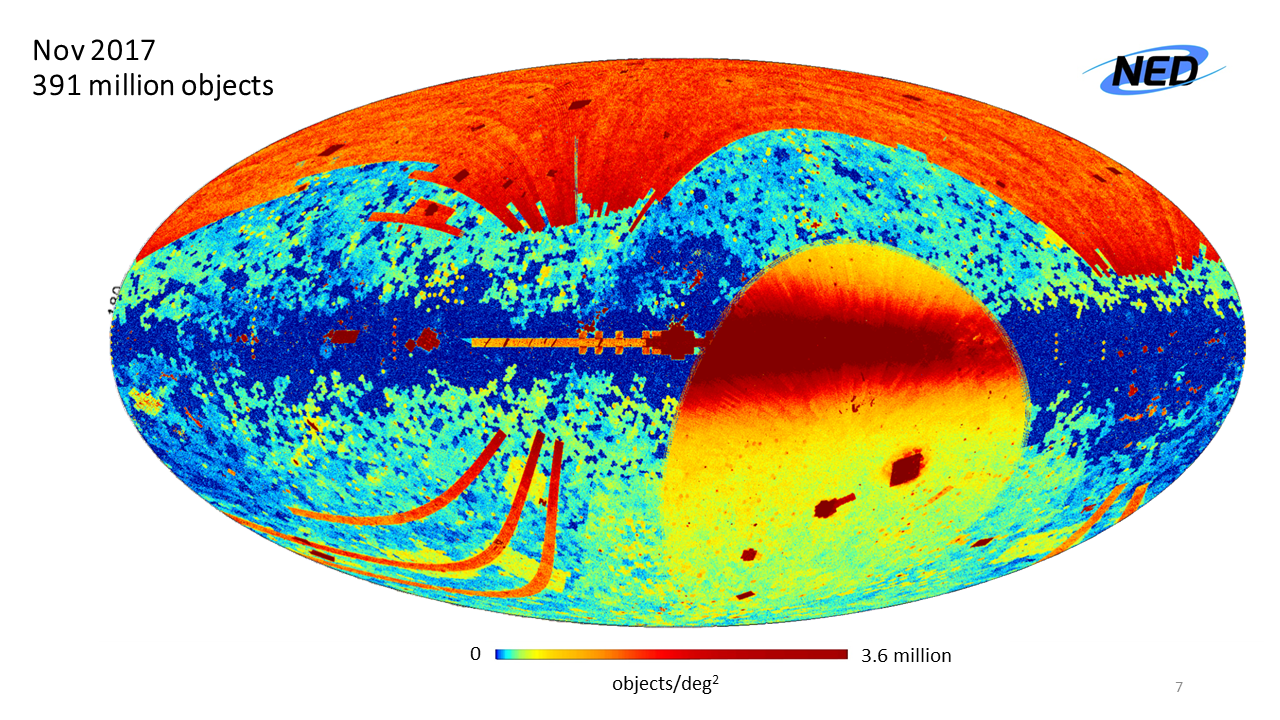
Source Density
(a)
(b)
(c)

(d)

The distribution of NED objects on the sky is shown in a time sequence:
- May 2017: prior to folding in the 2MASS PSC, NED contained 253
million distinct cross-matched objects;
- Nov 2017: after integration of 150 million sources (32% of the
PSC), NED contained 391 million objects;
- Jul 2018: after complete cross-matching of all 471 million sources,
NED contained 666 million objects;
- The above three views in an animated sequence.
The data are plotted in Galactic coordinates.
The color bar shows the number density ranging from 0 (black) to 3.6
million (red) objects per square degree. The most dense region (centered
at l = 223.59 deg, b = -54.39 deg, lower right) is within the
CANDELS/Hubble Ultra Deep Field.
What did the 2MASS point sources match up with?
Approximately 57 million (12%) of the 471 million sources in the 2MASS
PSC were cross-identified with prior NED objects, and their JHKs band
photometry has been joined into spectral energy distributions
(SEDs). The table below lists the largest survey catalogs in NED, along
with the total number of objects and the number of 2MASS point sources
with cross-IDs to each survey, as of the July 2018 NED release.
| Survey in NED |
NED objects with XIDs |
2MASS PSC objects with XIDs |
| SDSS |
154,641,323 |
15,959,270 |
| SSTSL2 (Spitzer Source List) |
41,792,031 |
20,796,851 |
| GALEX ASC |
39,569,906 |
20,672,964 |
| 2MASX (2MASS XSC) |
1,635,513 |
1,613,344 |
| 2dFGRS (z survey) |
233,252 |
140,494 |
| 6dF (z survey) |
111,541 |
104,693 |
| WiggleZ (z survey) |
81,361 |
160 |
| GAMA (z survey) |
59,621 |
25,706 |
| MGC (z survey) |
11,065 |
5,313 |
| Etc. |
|
|
| Total |
|
~57,000,000 |
Objects with Redshifts
Cross-identifications in NED resulted in attaching redshifts from
surveys such as the SDSS and the 2dFGRS, enabling the estimation of
derived quantities such as distance and luminosity for 1.6 million 2MASS
PSC objects.

The distribution of objects on the sky is shown as of July 2018 for all
7.73 million NED objects with an available redshift (left) and the
subset of 1.6 million NED objects with a 2MASS PSC counterpart and an
available redshift (right).
 (b)
(b)
The distribution of redshifts and corresponding cosmological look-back times
for 7.77 million NED objects with an available redshift (in the July
2018 NED release), including the following subsets:
4.26 million spectroscopic redshifts (green);
3.47 million photometric redshifts (blue); and
1.63 million 2MASS PSC objects (red).
Validating Cross-IDs
The results of cross-matching the PSC with NED were evaluated by visual
inspection of many regions of the sky, and also by viewing SEDs for many
compact sources to confirm that the photometry of 2MASS point sources
is consistent with measurements in other spectral regions. Following are
examples that illustrate the results by "blinking" sequences of images:
(a)
Field centered at (Glon, Glat) = (0, +10). Sequence:
(1) DSS2 image showing the optical counterpart of the only 2MASS object
in NED prior to ingest of the PSC, extended source
2MASX J17082726-2326327 near the field center. (2) 2MASS PSC sources
plotted as markers. (3) Results of a NED query after
the cross-matching, verifying excellent corresponance between visual
sources (image) and the 2MASS PSC objects (markers).
(b)

Field centered on M51a. Sequence:
(1) SDSS image. (2) 2MASS PSC sources plotted as pink diamonds. (3)
Objects in NED prior to the 2MASS PSC integration
(blue dots), including H II regions, star clusters, and other features
within the galaxy. (4) Overlay of the 2MASS PSC objects (pink diamonds)
superposed on the prior NED objects (blue dots).
(c)

Field within the SDSS DR6 sky coverage. Sequence:
(1) SDSS image. (2) 2MASS PSC sources (pink diamonds). (3) Objects in
NED prior to the 2MASS PSC integration
(blue dots). (4) Overlay of 2MASS PSC objects (pink diamonds)
cross-matched with prior NED objects (blue dots).
(d)
Field outside the SDSS DR6 sky coverage. Sequence:
(1) SDSS image. (2) 2MASS PSC sources (pink diamonds). (3) Objects in
NED prior to the 2MASS PSC integration
(blue dots). (4) Overlay of 2MASS PSC objects (pink diamonds)
cross-matched with prior NED objects (blue dots).
(e)

The SED of the quasar and Flat-Spectrum Radio Source PKS 1057-79 showing
excellent correspondence of the
2MASS PSC photometry (J, H, Ks bands) with other measurements in NED
spanning from gamma rays through radio frequencies.
This is one of many SEDs used to validate the results of cross matching
the 2MASS PSC with prior objects
in NED.