Chandra Source Catalog (CSC 2.0.1)
(Latest revision: 12 November 2021)
Data
The Chandra Source Catalog (CSC 2.0.1) includes measured properties such as positions, photometry and diameters for 317,167 unique X-ray sources detected by the Chandra X-ray Observatory in six science energy bands, including ACIS b (0.5-7.0 keV), u (0.2-0.5 keV), s (0.5-1.2 keV), m (1.2-2.0 keV), h (2.0-7.0 keV) and HRC w (0.1-10 keV) bands.
The specific version we ingested is v2.0.1, which is an overlay release that updated some variability properties for 10% of the truly variable sources in release 2.0. Please refer to the CSC 2.0 Release page for details on the observations and data products, including the Caveats and Limitations.
Source Nomenclature
Format: 2CXO JHHMMSS.s+|-DDMMSS(A/X)
Examples: 2CXO J173617.3-444406, 2CXO J004244.3+411608A, 2CXO J233614.1+020916X
An "A" suffix is used to differentiate two sources that are at very close positions which result in the same name string, e.g., 2CXO J004244.3+411608 and 2CXO J004244.3+411608A. An "X" suffix is used to indicate extended sources.
Processing Notes
Nomenclature, astrometry, photometry, diameter measurements and quality flags (extended, variable, confusion etc.) for 315,868 compact and 1,299 extended X-ray sources in CSC 2.0 were integrated into NED using the latest data ingestion and cross-matching pipeline (see Ogle et al. 2015 for a description of the cross-matching algorithm). The equatorial coordinates from the catalog are the best estimates of the ICRS celestial position of the source. Four sets of fluxes for each science energy band (ACIS b, u, s, m, h and HRC w) were ingested, including the best estimate and average of the aperture-corrected net energy flux inferred from the source region aperture, and the best estimate and average of the aperture-corrected net energy flux inferred from the PSF 90% ECF aperture. Diameters for extended sources are given by the major and minor axis of the ellipse defining the deconvolved source extent for each science energy band.
Cross-matching with NED objects
80% of the CSC 2.0 sources were cross-matched with exisiting objects in NED, while 20% (63,225 sources) became new NED objects.
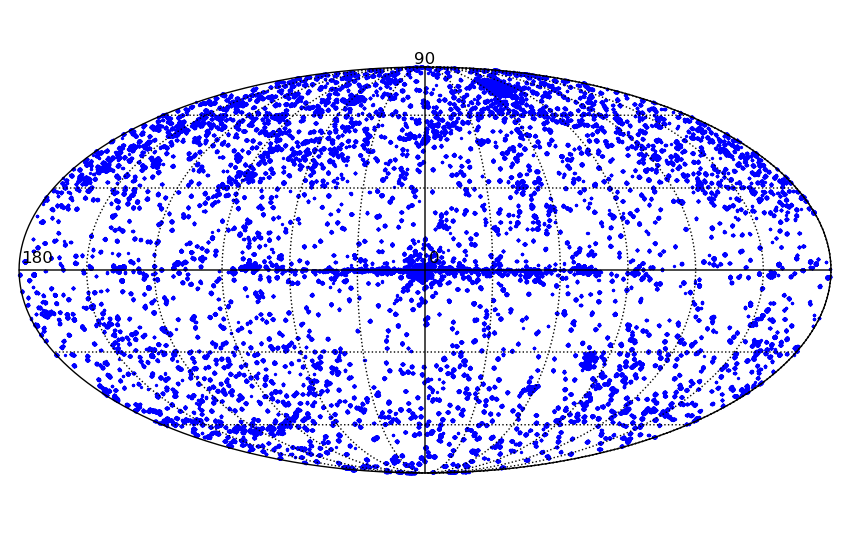
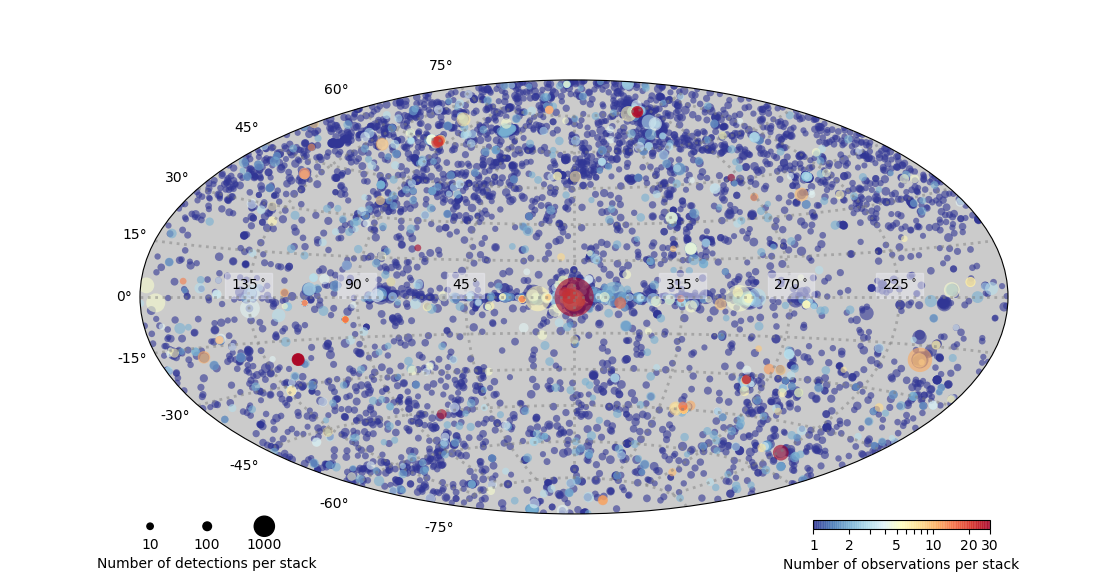
Below we show the distribution of NED objects crossmatched with CSC 2.0 sources, in Galactic coordinates. The locations of all the CSC 2.0 detections in Galactic coordinates are also given here for comparison (image credit: CSC 2.0 Release).
Photometry Validation
Individual comparison
We selected 108 X-ray objects with ≥ 30 X-ray flux measurements in NED prior to the CSC 2.0 ingestion that matched to CSC 2.0 sources, and plotted their SEDs in the X-ray regime (3e16 ≤ ν ≤ 3e19 Hz). For the majority of the 108 objects, the CSC 2.0 measurements fit in nicely with the exisiting SEDs. Below are two examples, where existing photometric measurements are plotted as blue crosses and new fluxes from the CSC 2.0 are indicated with red circles.
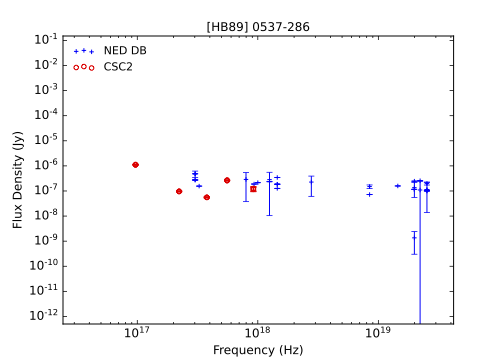
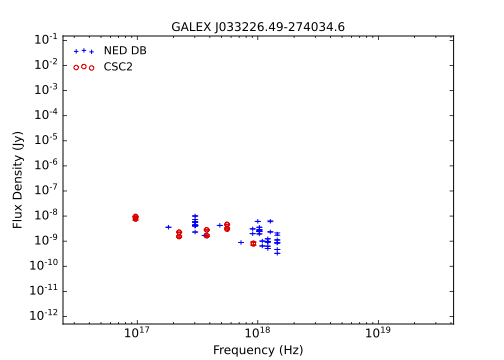
There are a few sources in our sample that show large discrepancies between CSC 2.0 and existing measurements, which are mainly attributed to aperture differences and X-ray source variability.
Statistical comparison
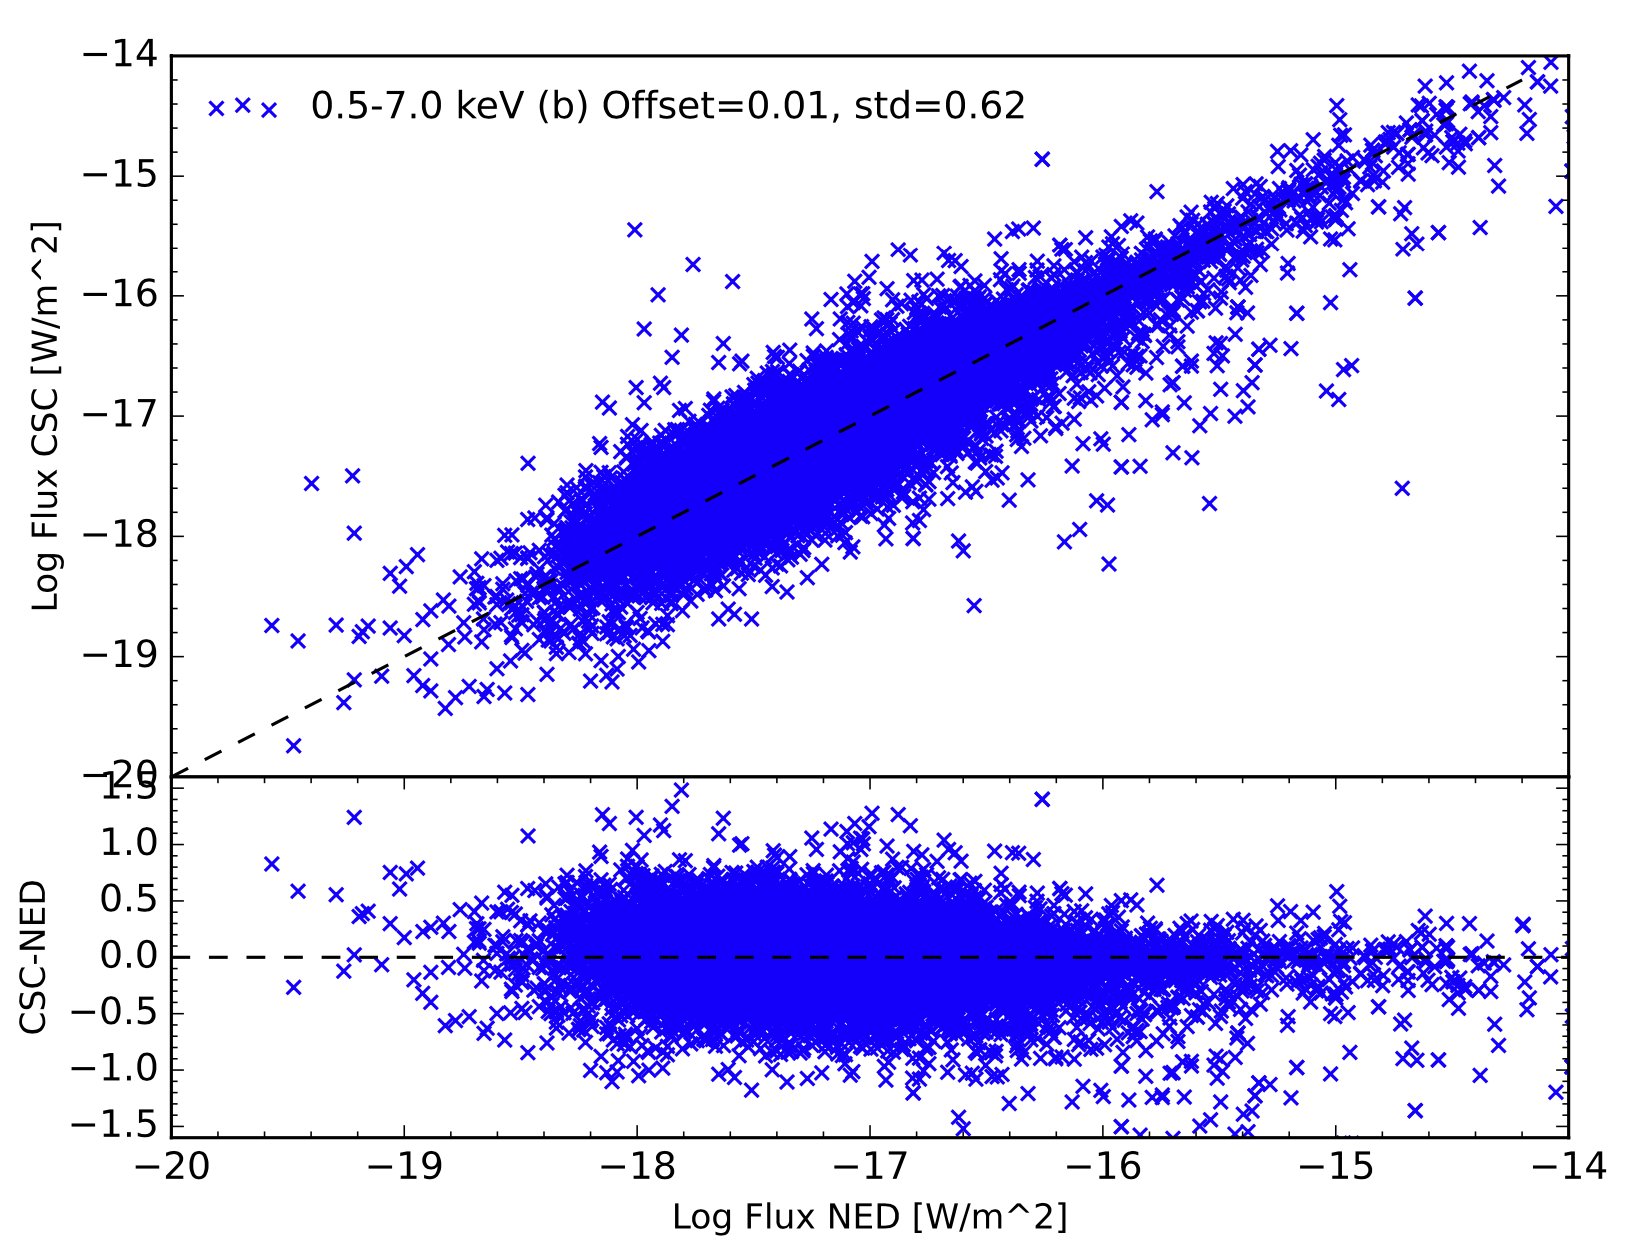
We further validated the cross-matching by extracting the CSC 2.0 and existing X-ray fluxes in similar energy bands, and compared the CSC 2.0 fluxes to the median of the prior fluxes. The median was chosen for the existing fluxes as the energy bands from other surveys (XMM, Swift, etc.) don't exactly match up with the energy bands of CSC 2.0. The comparision result for ACIS b band is shown below. This is the energy band that had the most X-ray measurements in NED prior to the CSC 2.0 ingestion.
