The AllWISE Source Catalog
(Latest revision: 11 December 2019)
Data
The AllWISE Source Catalog (PSC) contains positional and photometric
infomation for 747,634,026 compact sources
extracted from the
WISE All Sky Suvey (AllWISE)
maps, at 3.4, 4.6, 12, and 22 microns (W1, W2, W3, W4) in 2010 with an angular resolution of 6.1", 6.4", 6.5", & 12.0" in the four bands.
Details on the survey and data products can be found in the
AllWISE Explanatory Supplement.
NED Nomenclature
Format: WISEA JHHMMSS.ss+/-DDMMSS.s
Example: WISEA J120253.95-162225.0
Processing Notes
Nomenclature, astrometry, photometry and quality flags (extended, variable, confusion etc.) for 747.6 million sources in the AllWISE source catalog were integrated into NED using the latest data ingestion and cross-matching pipeline (see Ogle et al. 2015 for details on the cross-matching algorithm). For astrometry, the "stationary" positions derived from the deep detection profile-fit measurements made without the small linear motion term in the model were selected. It is the preferred position for >99% of all catalog sources as they don't have detectable apparent motion. Note that the positions of non-saturated, high SNR AllWISE Catalog sources (8<W1<12 mag) in non-confused region are accurate to ∼50 mas radially with respect to those of the quasars that define the ICRF. AllWISE position accuracy gradually decreases with decreasing source brightness. For photometry, three sets were ingested, including the deep detection profile-fit photometry, curve-of-growth (COG) corrected aperture photometry (8.25" radius for W1, W2 and W3 bands, and 16.5" radius for W4 band) and 22.0" fixed radius aperture photometry. The deep detection profile-fit photometry is best for unresolved sources, may underestimate brightness of extended sources, and provides the highest SNR flux measurement for faint sources. The COG corrected aperture photometry is appropriate for unresolved objects, but not good for extended sources and susceptible to contamination from nearby objects. It also greatly underestimates the brightness of saturated sources. The 22.0" fixed radius aperture magnitudes are useful measurements for extended sources smaller than aperture sizes, but susceptible to contamination from nearby objects, and does not compensate for saturated or missing pixels in the images.
Source Density
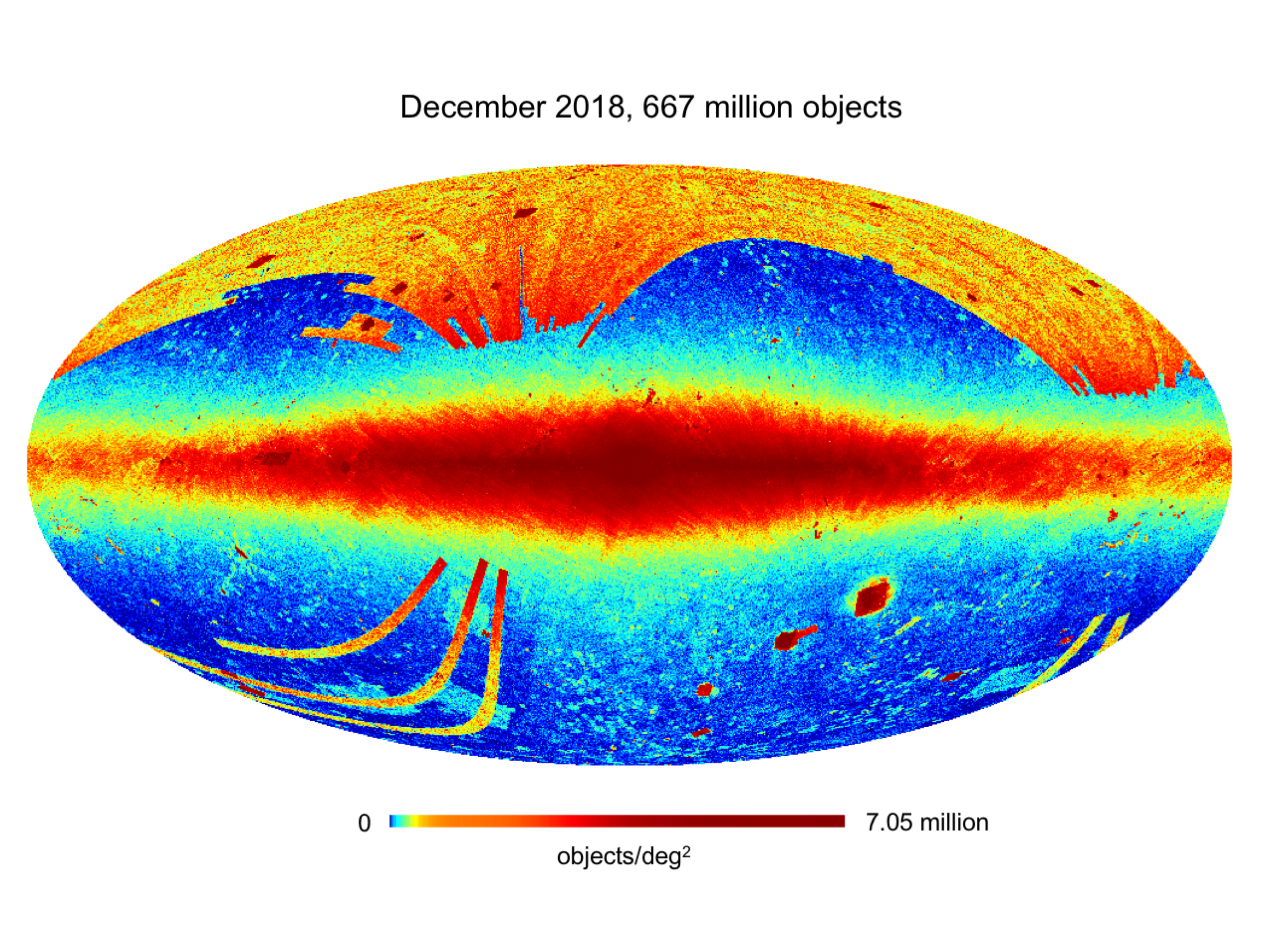
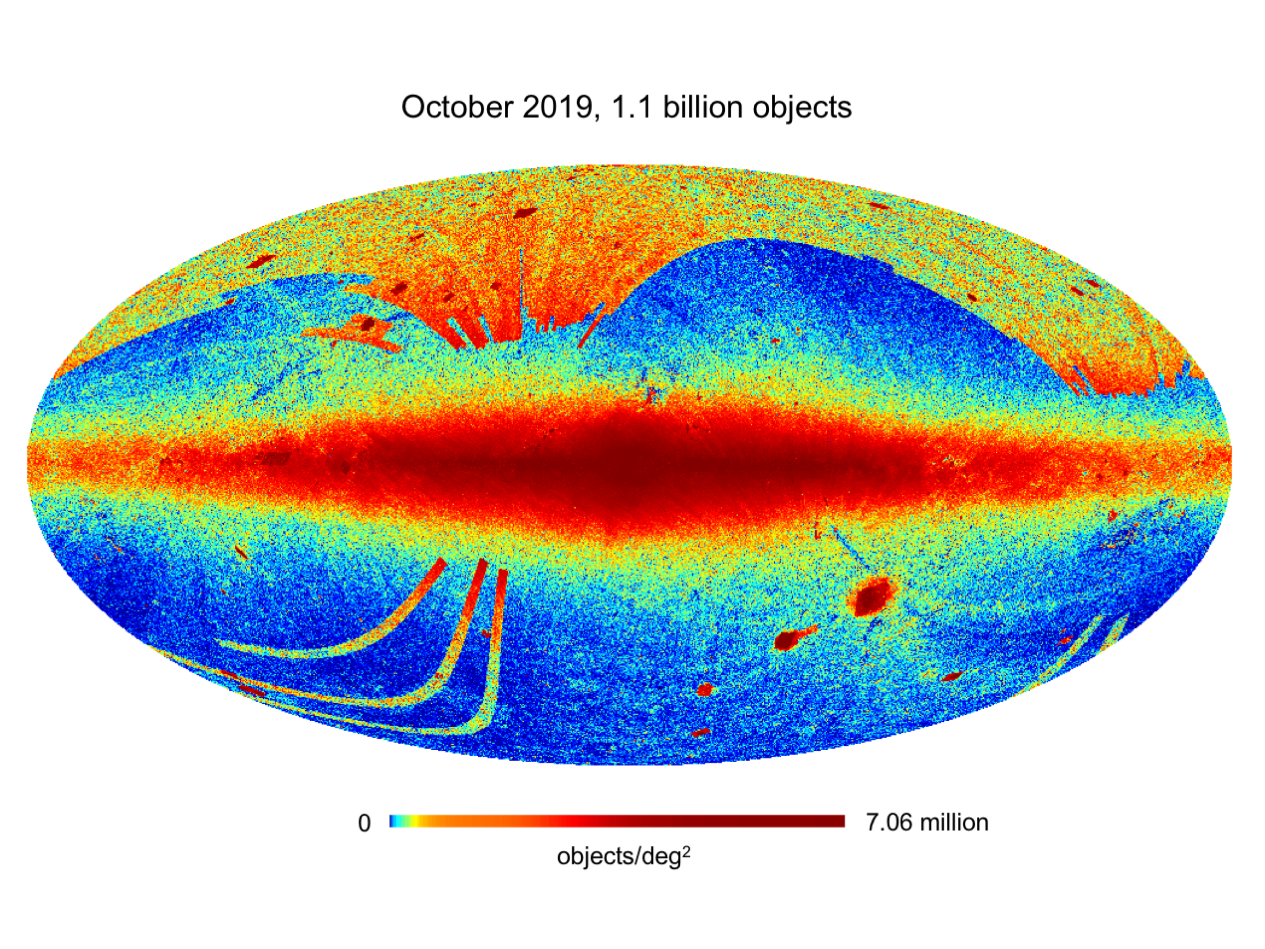
Prior to the AllWISE ingestion, there were 667,033,216 total objects in NED. Integrating AllWISE into NED brought the number of total objects to 1,106,718,386, which meants that 41.2% of the AllWISE sources were crossmatched with exisiting objects in NED, while 58.8% of the AllWISE sources became new NED objects. The distribution of NED objects on the sky before and after the AllWISE source catalog ingeston are presented here. The data are plotted in Galactic coordinates.
The color bar shows the number density in objects per square degree. Blue is the most sparse region where red is the densest. After the AllWISE integration, the most dense region (centered
at l = 223.59 deg, b = -54.39 deg, lower right) is within the CANDELS/Hubble Ultra Deep Field, and has a number density of 7.1 million objects per square degree.
(a)
(b)
What did the AllWISE point sources match up with?
| Survey in NED |
NED objects with XIDs |
AllWISE objects with XIDs |
| 2MASS-PSC |
470,744,651 |
239,778,703 (50.9%) |
| SDSS |
154,672,626 |
66,498,357 (43.0%) |
| SSTSL2 (Spitzer Source List) |
41,792,031 |
12,869,653 (30.8%) |
| GALEX ASC |
39,569,906 |
29,954,758 (75.7%) |
| 2MASX (2MASS XSC) |
1,635,513 |
1,514,225 (92.6%) |
| 2dFGRS (z survey) |
233,252 |
216,778 (92.9%) |
| 6dF (z survey) |
111,541 |
102,005 (91.5%) |
| WiggleZ (z survey) |
81,361 |
23,576 (29.0%) |
| GAMA (z survey) |
59,621 |
53,494 (89.7%) |
| MGC (z survey) |
11,065 |
9,680 (87.5%) |


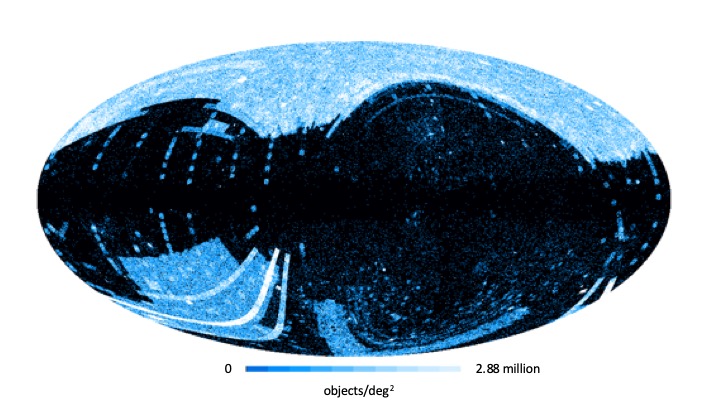
Left: The distribution of the 2MASS objects in NED that were not matched to AllWISE. As expected, most of the non-matches occur in the Galactic plane, in the LMC and SMC where confusion is high.
Right: The distribution of the AllWISE objects in NED that were not matched to 2MASS. The additional objects brought into the database by AllWISE are mostly in the ecliptic pole areas where the AllWISE map sensitivity is at the highest.
Objects with Redshifts
Cross-identifications in NED resulted in attaching redshifts from
surveys such as the SDSS and the 2dFGRS, enabling the estimation of
derived quantities such as distance and luminosity for 4.19 million AllWISE objects.

Left: The distribution of objects on the sky is shown as of October 2019 for all 7.92 million NED objects with an available redshift.
Right: The distribution of objects on the sky is shown as of October 2019 for all 4.19 million NED objects with an AllWISE counterpart and an available redshift.
Validation
SEDs
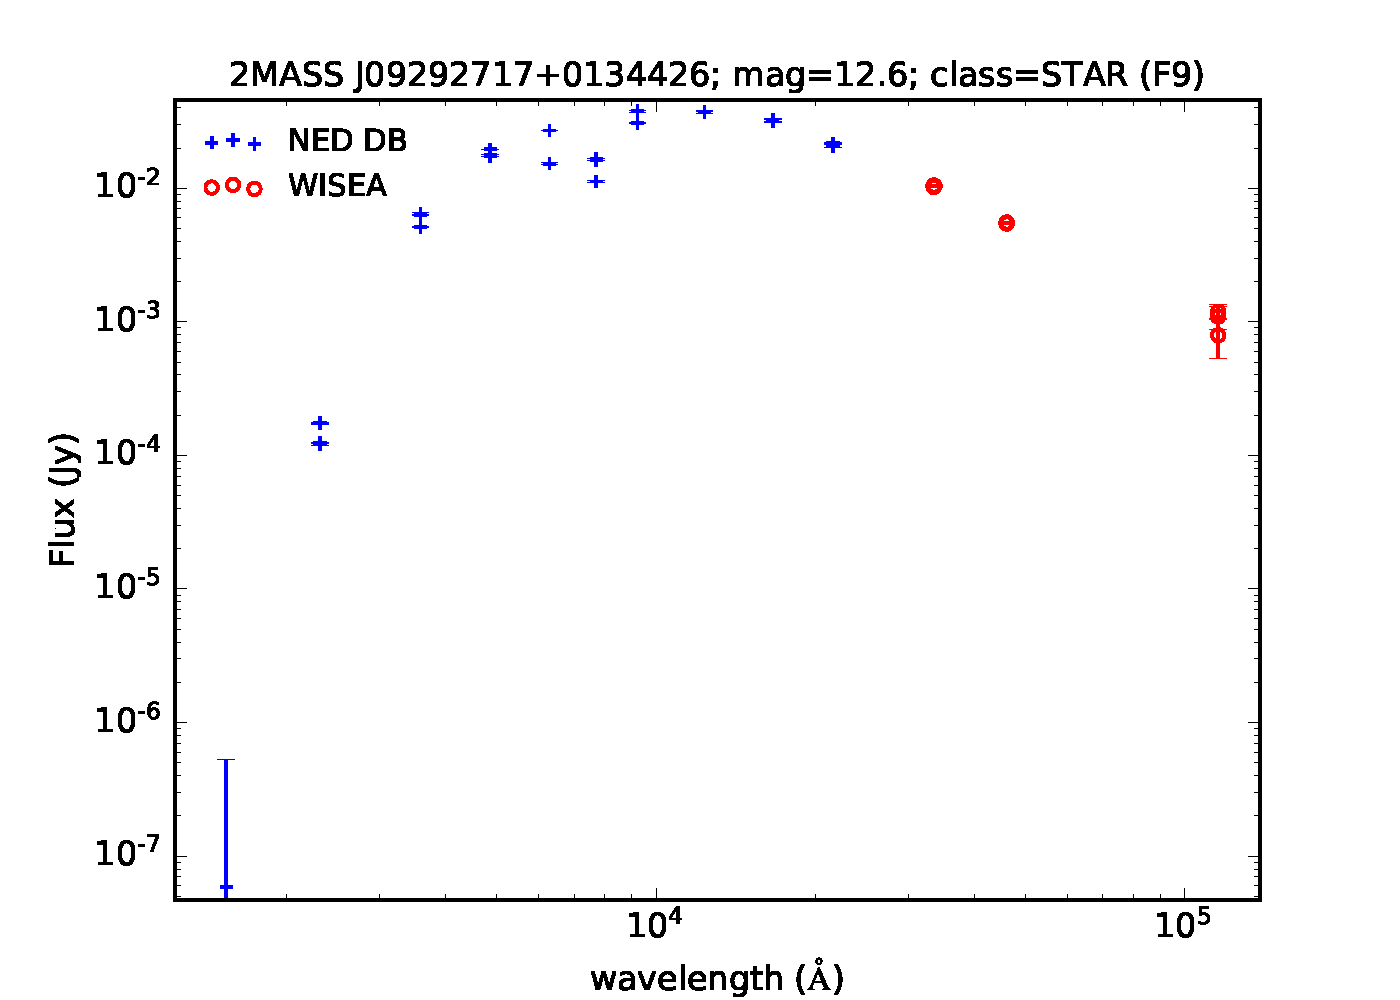
To validate the crossmatches using SEDs, 100 galaxies, 100 QSOs and 100 stars were selected from the SDSS DR14 sources that has r-band magnitude between 12 and 22 mag. There are 10 sources
of each object type in one of the ten r-band magnitude bins (binsize = 1 mag). The photometric measurements in NED for all these objects were plotted, with all three sets of AllWISE photometric measurements overplotted. For all the 300 objects, the AllWISE measurements fit in nicely with the exisiting SEDs. Below are a few examples. Blue crosses are existing photometric measurements of the NED objects, the three sets of AllWISE measurements are in red circles.

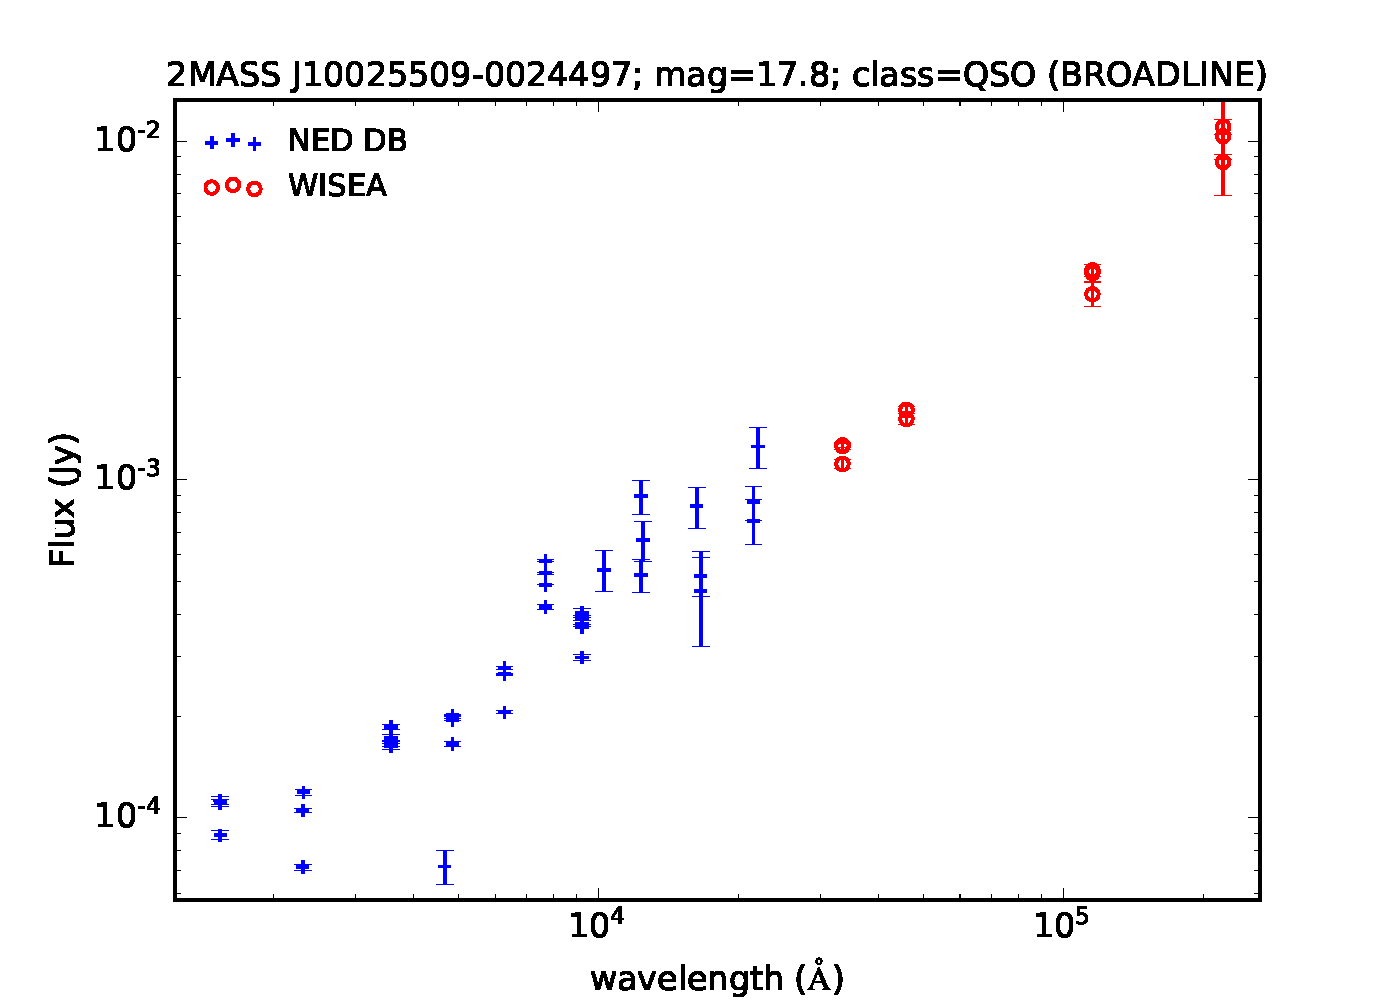
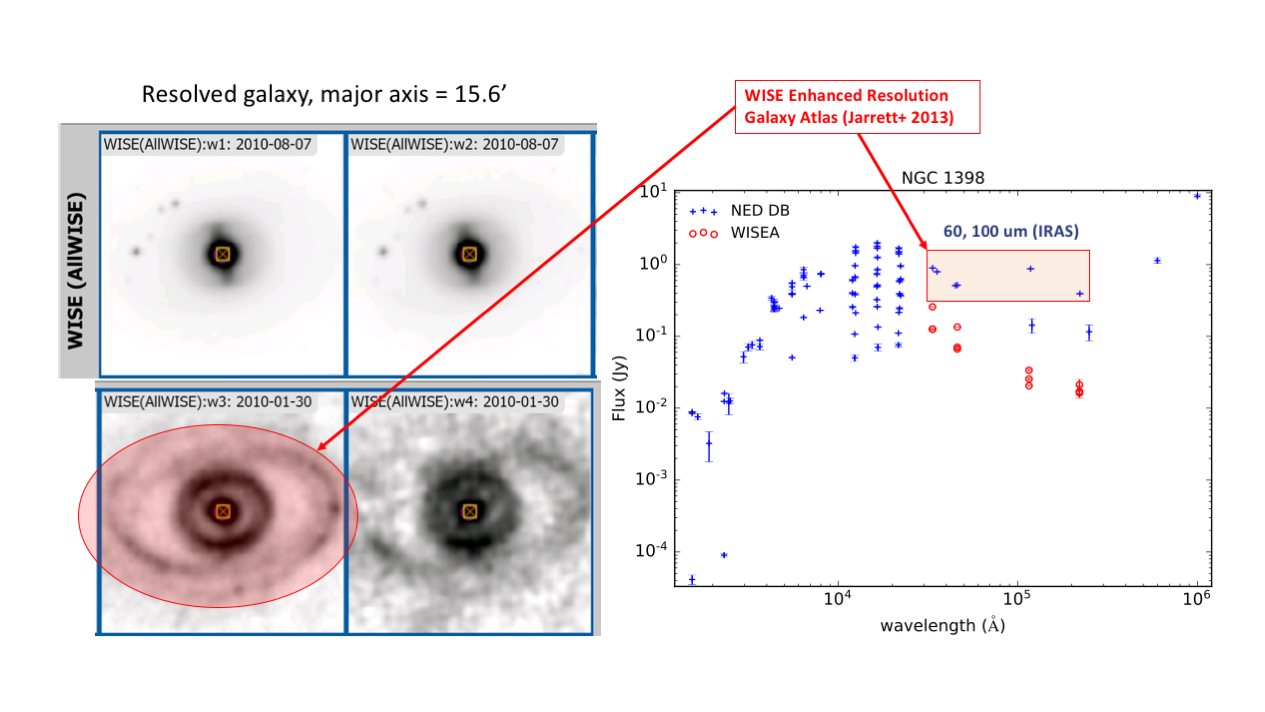
Note that the AllWISE photometry measurements, especially the profile-fit photometry and the COG-corrected aperture photometry, are mostly suitable for point sources. For the highly extended sources, such as the resolved galaxy shown below, the AllWISE photometry measurement can greatly underestimate the brightness of the object.
Stellar Masses
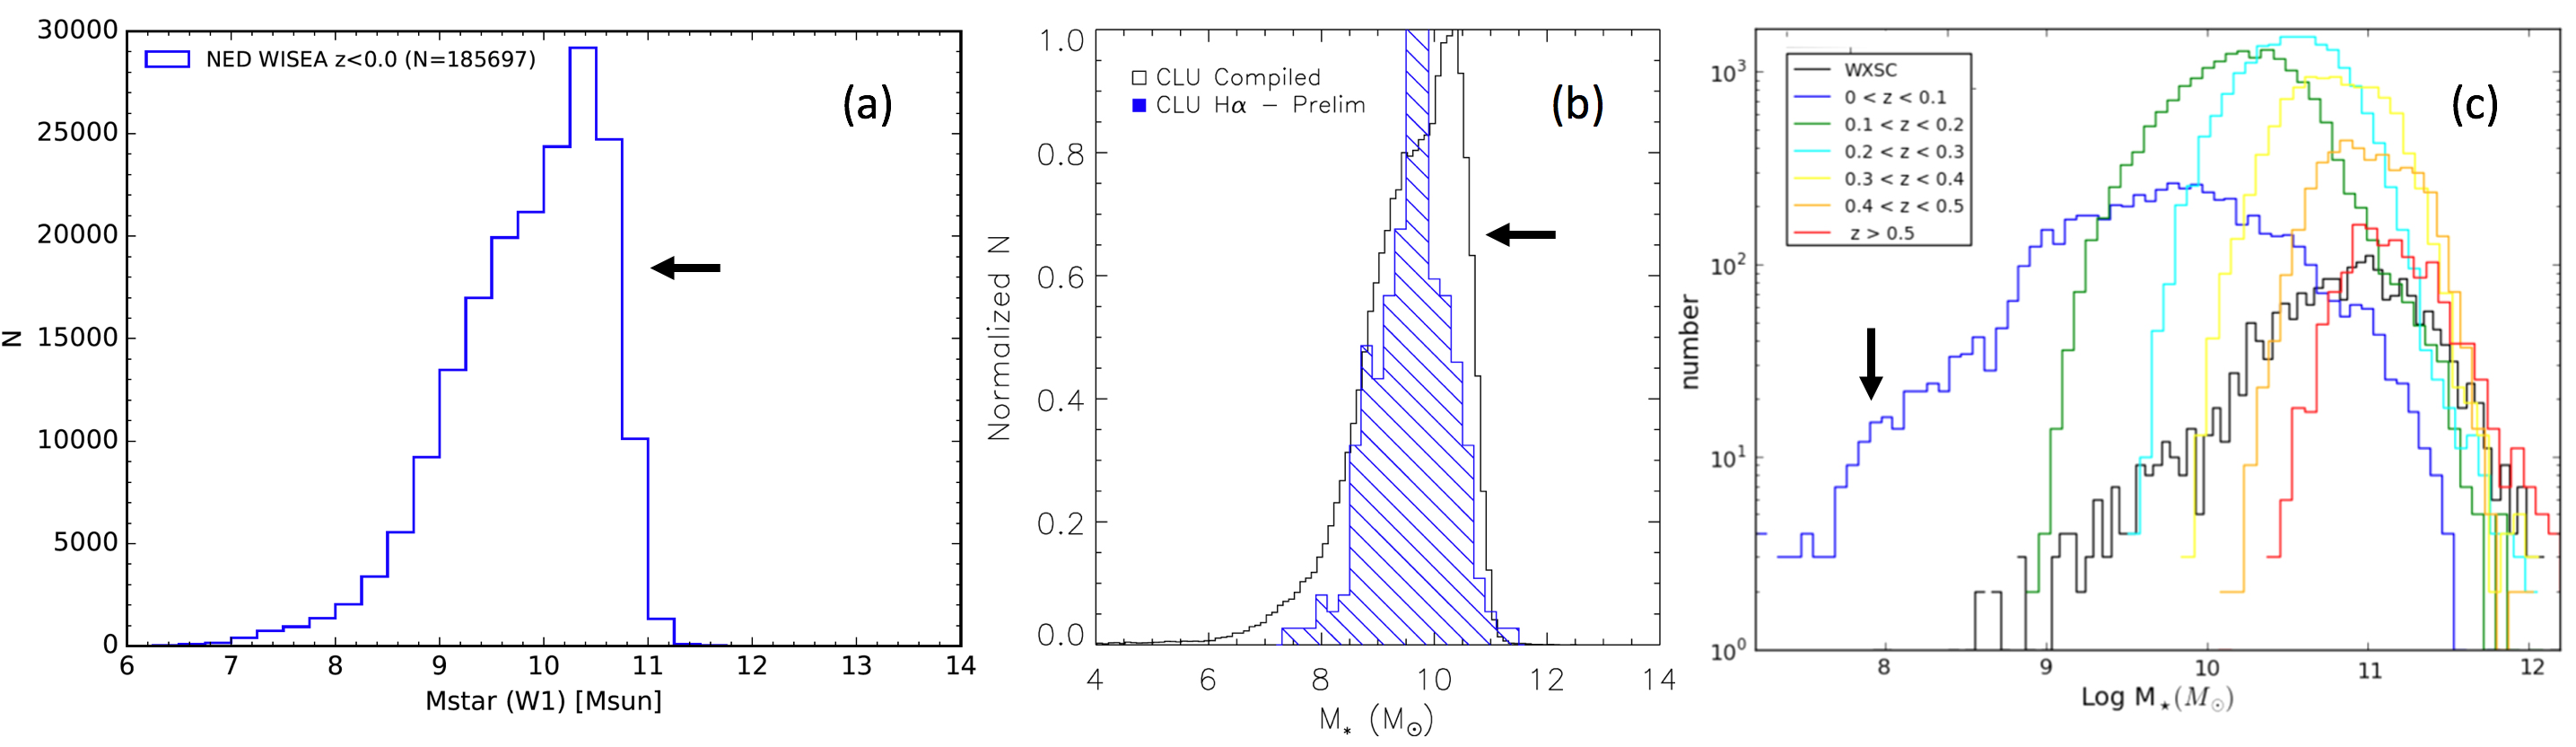
To further validate our NED-WISEA cross-matching we have computed derived quantities (e.g., stellar masses) for a sample of objects in the Local Universe (D < 200 Mpc) and compared them to published distributions. Panel (a) shows the stellar mass (Mstar) histogram for ~200,000 objects in NED with WISEA photometry, where the distribution is peaked near a Log(Mstar) = ~10.4 and range from Log(Mstar) = ~7 to ~11. Panels (b) and (c) are stellar mass histograms from the literature for similar nearby galaxy samples in the CLU catalog (Cook et al. 2019) and for galaxies at various redshifts in the GAMA survey (Jarrett et al. 2017). Both distributions from CLU and the GAMA sample at a similar redshift show similar Mstar peaks and ranges.
False Positive Rate and False Negative Rate
Before cross-matching the entire AllWISE source cagalog with the NED objects, 5 test patches were selected to estimate the false positive rate (Fp) and false negative rate (Fn), and to help select matching criteria including search radius, Poisson probability threshold, normalized source-object separation threshold, etc.
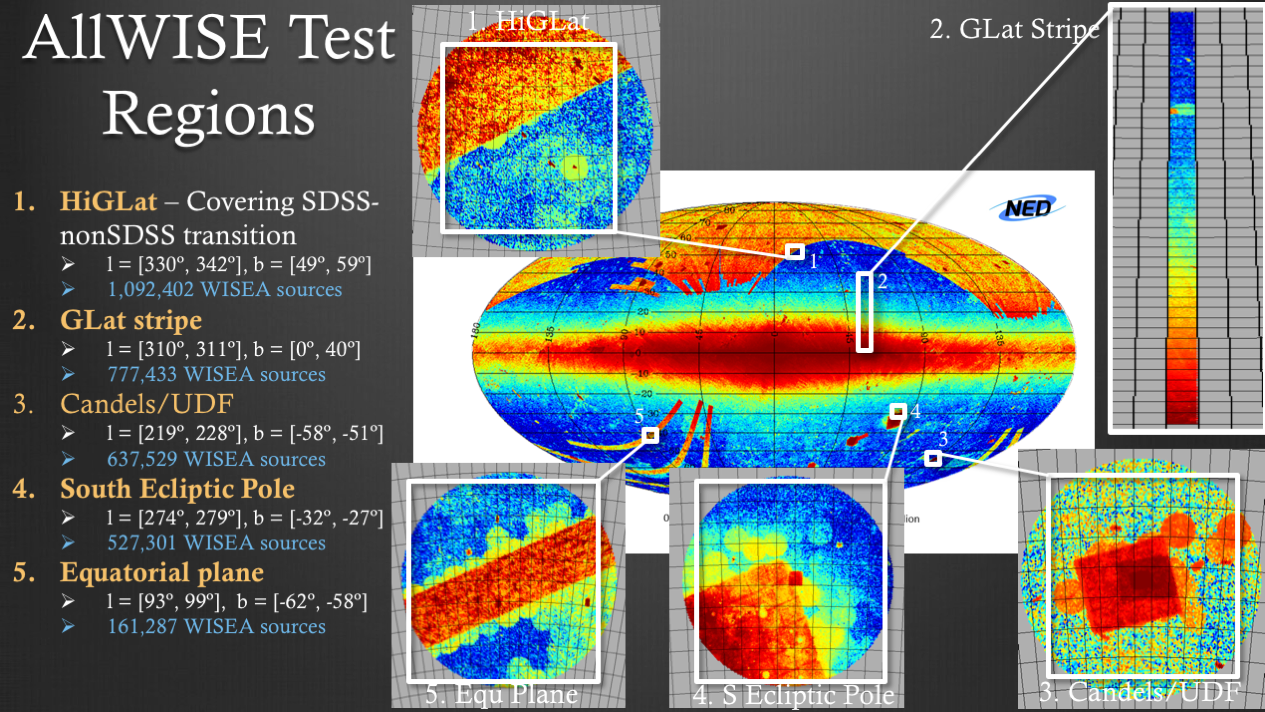
Based on the statistical results on these 5 test patches, a search radius of 6", a Poisson probability threshold of 0.9, and a normalized source-object separation threshold of 3.1 were chosen. The estimated Fp is 0.3% while the estimated Fn is 16%.
After integrating the AllWISE source catalog into NED, two more test patches were selected to estimate the Fp and Fn, one in a high density region, the other in a low density region.
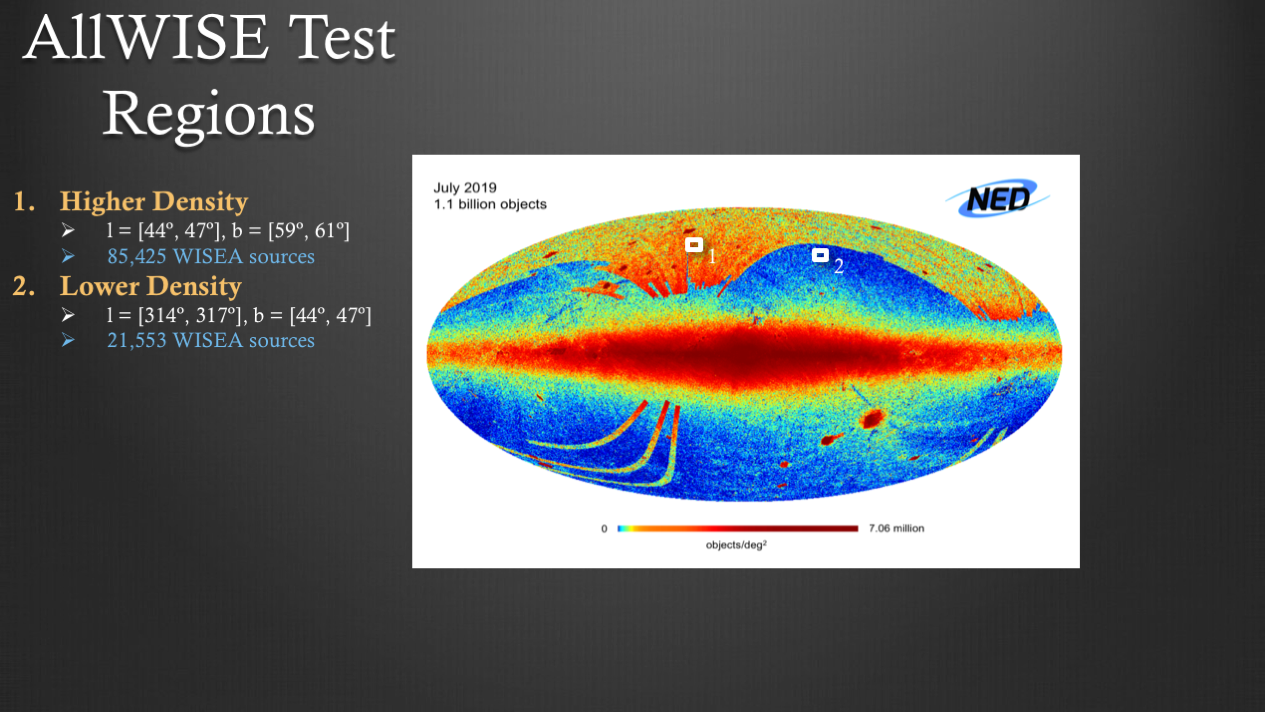
The calculated Fp and Fn are 0.2% and 18% respectively for the high density region, which is consistent with the prior estimates. In the low density region, the Fp and Fn are both significantly lower, at 0.04% and 9% individually.