


Total mass budgets by themselves do not fully reveal the flows that govern galaxy evolution. However, there is a ready means of distinguishing inflows from outflows: stars produce heavy elements sending passively-advecting “tracer particles” out into the ISM, CGM, and IGM from stellar winds and supernovae. The metal content of galactic flows can help identify their origins and determine their fate, and break degeneracies between models matched to the four galaxy problems. The galactic metals census (Section 2) requires that we compute the total budget of “available metals” produced by the galaxy by z = 0. This census was performed by Peeples et al. (2014) by compiling measurements on stars, ISM and CGM gas, and dust. As shown in Figure 9, the contributions bound in stars (red), interstellar gas (blue), and interstellar dust (orange) — the metals inside galaxies — add up to only consistently 20–30% over a factor of ∼ 1000 in stellar mass. 1 Ideally, this census would be done for each element individually, with the CGM divided into each ionization state of that element, e.g., oxygen (Oppenheimer et al., 2016b), but as that is observationally not yet generally feasible, the ionization corrections discussed in earlier sections must instead be done to account for unobservable ionization states. Qualitatively similar results are seen in simulations that have addressed this problem in particular (Muratov et al., 2016). This striking invariance must offer some important clues to the operation of galactic outflows and inflows, with potentially large implications for the processes of galaxy fueling, feedback, and recycling.
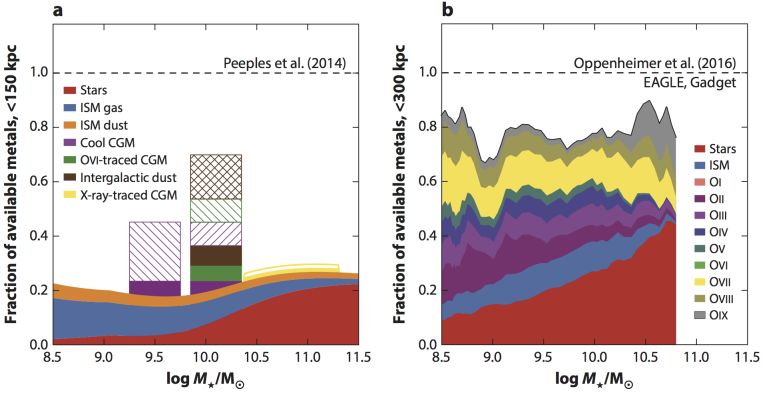 |
Figure 9. Left: A metals census of the CGM around star-forming z∼ 0 galaxies following Peeples et al. (2014), including a sub-L* budget from Bordoloi et al. (2014b). As in Figure 7, stars are red, ISM gas is blue, ISM dust is orange the cool CGM is purple, the O vi-traced CGM is green, the X-ray traced CGM is yellow, and intergalactic dust is in brown. Right: A simulated budget from 55 relatively isolated log M⋆ ≥ 8.5 star-forming EAGLE halos, with a moving average smoothing (Oppenheimer et al., 2016b). In both panels, the denominator is the total mass of metals ever produced by the central galaxy; the CGM may have contributions from, e.g., satellites. |
Even Lyman Spitzer might have recognized that the heavy elements observed in the CGM are in some sense the cause of, and solution to, all our problems. Apart from the (problematic) series of Lyman lines in the rest-frame FUV, virtually all our knowledge of the physical state, mass, kinematics, and evolution of the CGM gas come from lines of C, N, O, Si, Fe, Mg, Ca, and so on, whether they appear in the UV or X-ray. Yet, as described in Section 4, these critical diagnostics also present many problems of analysis and interpretation. To work through this, it helps to distinguish between measurements of metal content or metal mass on the one hand and metallicity on the other. This distinction hinges on whether or not the hydrogen content can be measured, which is notoriously difficult. Measurements of hydrogen suffer severe H i saturation effects, and juggling both metals and hydrogen compounds the difficulties of ionization corrections. When considering metal mass, we can often tolerate simpler ionization corrections or even direct sums of metal ion surface densities, sidestepping the large ionization corrections for H i (Section 4.4).
The COS-Halos survey (Tumlinson et al., 2011) used the O vi line observed with COS in a way that typifies measurements of metal content rather than metallicity. Their basic empirical finding is that O vi appears at column densities of logNOVI ≃ 14–14.5 out to the 150 kpc limits of the survey. Since O vi does not reach more than 20% of the total oxygen in most ionization conditions, they were able to place a robust lower limit of > 107M⊙ of total oxygen for star forming galaxies. As it comes from direct integration of surface densities for a heavy element, does not refer to H, and uses a limiting ionization correction, this estimate avoids some of the trickiest aspects of metallicity measurements, and yet has significant implications for the budgets of galactic metals (Peeples et al., 2014). The O vi traces a high ionization component of the CGM gas; adding lower ionization gas to the budget requires the more complex ionization corrections and assumed relative abundances of oxygen and, e.g. Mg and Si, though it does not require the H i-dependent metallicity corrections that plague the baryon census. Altogether, 20–30% of available metals have been located in the R < 150 kpc CGM around ∼ L* galaxies.
By contrast with the measurements of total metal mass, bona fide metallicities require robust measurements of the hydrogen surface density, which entails accurate measurements of NHI and reliable ionization corrections. For most strong CGM absorbers at z ≲ 0.2, the Lyman series lines are saturated and do not yield reliable H i column densities. However, beyond this redshift, and at log NHI > 16.2, Lyman limit systems enable adequately precise (± 0.2−0.3) measurements of NHI and the ionization corrections are manageable.
By building a sample of LLSs from high-quality COS sightlines, Lehner et al. (2013) and Wotta et al. (2016) found that the distribution of metals in LLS clearly exhibits two peaks near 4% solar and 50% solar metallicity (Figure 10a). The metallicities are constrained by detections of low-intermediate ions such as C II-IV, Si II-IV, OII-IV, and Mg ii. This bimodal distribution qualitatively matches with expectations that accretion from the IGM into halos will have low metallicity, while accretion of gas previously ejected will have higher metallicity. The relative absence of intermediate values challenges our intuition that gas should naturally mix over time into a continuous distribution, and has posed a challenge to simulations (Hafen et al., 2016, etc.). But most of these systems have not yet been identified with galaxies. In contrast to the Lehner bimodality, Prochaska et al. (2017) find a unimodal distribution of metallicities within 160 kpc of L* galaxies with a median of ∼ 30% solar. These metallicities derive from tight constraints on NHI around L* COS-Halos galaxies with well-defined masses and distance to the absorber. The contrast between the absorber-selected Lehner et al. sample and the galaxy-selected COS-Halos sample may indicate that they arise in other selection effects, but it may also indicate variation in CGM metallicity in different subsets of the galaxy population.
By mining the Keck database of high-z QSO absorbers, the KODIAQ survey studied a sample of LLSs at z > 2 (Lehner et al., 2016). This sample is shown in the left panel of Figure 10 compared to the expanded low-z sample of Wotta et al. (2016). The z > 2 distribution is unimodal and centered at [X/H] ∼ −2. A similar result was obtained for two samples of LLSs at still higher redshift, z = 3.5−4, with unimodal distributions centered at [X/H] ∼ −2.5 (Glidden et al., 2016, Cooper et al., 2015). This is near the bottom edge of the low-metallicity peak at z < 1, indicating evolution in the average metallicity of high-column CGM over the few Gyr interval. Somehow, the bimodality emerges long after the initial buildup of metals, and is noticeable only in the z < 1 sample. Note that neither of these samples has specific galaxies attached — both are selected based on HI alone and the galaxies will have to be identified later. It is also possible that the column density range used for selection traces different galaxy masses, radii, and total column densities at the different redshifts, and so the apparent evolution does not occur in the same type of physical system (owing to a higher mean cosmic density). Nevertheless, it is now possible to compare the distribution of CGM metallicities over ∼ 6–10 Gyr of cosmic time.
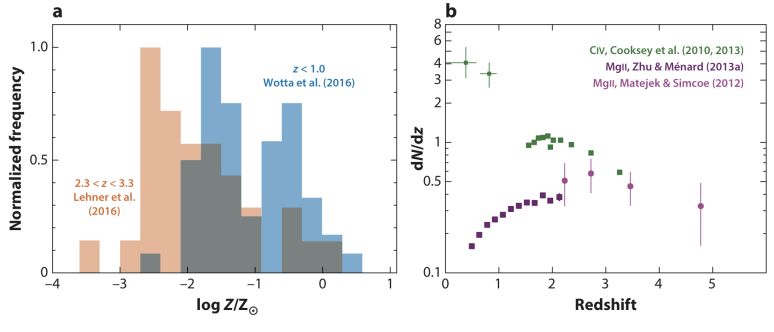 |
Figure 10. Two views of CGM metallicity: (a) Two LLS distributions from Lehner et al. (2013) and Wotta et al. (2016). This comparison clearly shows evolution in the LLS metallicities over time. (b) Trends in Mg ii and C iv line density per unit redshift: the low-ion Mg ii traces the cosmic star formation history, while C iv continually becomes more abundant. |
In particular, there are ever-increasing samples of z > 2 absorbers that do have associated galaxy information, allowing for a more direct comparison to the low-z COS studies (Figure 4). The Keck Baryonic Structure Survey (KBSS; Rudie et al., 2012) has engaged in a long campaign to characterize the CGM of star-forming galaxies at z ∼ 2.2, going back to pioneering studies of absorption associated with Lyman-break galaxies (Adelberger et al., 2003). These data show ion sets that overlap strongly with the low-z studies. Both H i and metals (O iv, N v, C iii, C iv, and O vi) show strong statistical correlations with galaxies out to 100-300 kpc. Using stacking, Steidel et al. (2010) and Turner et al. (2015) examined the relative kinematics of metals and galaxies, finding essentially all outflow kinematics and little sign of inflow; there must be gas flowing in to mainain the observed star formation rates, but it may be occuring in thin filaments with low covering fraction.
These results across redshift can be viewed a different way, by examining the redshift evolution of strong lines that are likely to trace CGM gas. Figure 10b shows the comoving sightline density of Mg ii (Wrest ≥ 1 Å) and C iv (Wrest ≥ 100 mÅ), which follow different trends at z < 2. The number density of strong Mg ii absorbers rises and then declines again toward z = 0. Absorbers above this limit occur within ∼ 100 kpc of galaxies (see Figure 4), so the resemblance of this curve to the cosmic SFR density (Hopkins et al., 2006) suggests that the strong Mg ii absorbers are linked to the fueling or feedback of star formation. Indeed, other evidence suggests that we are seeing the rise and decline of galactic superwinds (See 7.3). In contrast to the Mg ii, strong C iv absorbers continue their march upwards at low redshift. This trend in moderate-to-high ionization gas may indicate that ionized gas in occupying the bulk of the CGM volume becomes more common even as strong winds creating Mg ii absorbers decline with the cosmic SFR density.
The interstellar medium is a mixture of gas and dust; this is no less true of the CGM. In a pioneering study, York et al. (2006) stacked a sample of 800 strong Mg II absorbers to find evidence of SMC-like dust reddening. Ménard et al. (2010) added the SDSS photometric galaxy catalogs to this style of analysis and found that the reddening extends over angular scales consistent with distances hundreds of kpc away from the luminous galaxies (Figure 7). To tie dust to specific galaxies and precise physical scales, Peek, Ménard & Corrales (2015) used passively evolving galaxies from SDSS as “standard crayons” to examine the reddening imposed by foreground SDSS spectroscopic galaxies. They found a strong reddening effect out to 150 kpc in the bluest bands and a steeper drop past that radius than in the angular correlations of Ménard et al. (2010). The correlations with physical radius allow Peek, Ménard & Corrales (2015) to further estimate the typical total mass of dust for galaxies between 0.1–1L* of Mdust ≃ 6 ± 2 × 10⁷ M⊙. They found only a weak trends with stellar mass, Mdust ∝ M⋆0.2 and no discernible trend with the galaxies’ specific star formation rates. Thus the presence of dust in the CGM out to 100 kpc scales provides unambiguous evidence that the CGM is fed by galactic outflows, accounting for approximately 10% of the metals budget near L* (Figure 9). This degree of reddening can be explained by outflows from normal star forming galaxies in simulations, provided the dust-to-gas ratio is similar to the Galactic value and the dust survives the trip (Zu et al., 2011). It is not yet clear why the dust properties show so little dependence on galaxy stellar mass, resembling the CGM H i and low ions more than the CGM high-ionization gas. It might be that the increasing reddening at low redshift indicate a steady buildup of metals in the CGM and a relative lack of recycling into future star formation. Dust observations could also be used to test the physical models of galactic outflows that employ radiation pressure on dust to drag gas out of galaxies (Murray, Quataert & Thompson, 2005, Murray, Ménard & Thompson, 2011). Further explorations of CGM dust promise to constrain galactic outflows and recycling in ways that complement studies of gas.
1 While the overall level of the fraction of metals retained in galaxies is uncertain, primarily owing to uncertainties in nucleosynthetic yields, the flatness of this relation is fairly robust; see Peeples et al. (2014) for a thorough discussion of the uncertainties in this calculation. Back.