


3.2. The Hubble diagram with SNIa
As we have already discussed in section 2.3, the Hubble diagram of supernovae SNIa can be used not only to determine the Hubble constant (at relatively low redshifts) but also to trace the curvature of the Hubble relation at high redshifts (see [136] and references therein).
The two groups working laboriously on this subject (SCP and HZT)
have found consistent results, by which the distant SNIa's are dimmer on
average by 0.2 mag than what expected in a flat EdS model, which
translates in them being ~ 10% further away than expected
([119],
[135]).
This implies that we live in an accelerating phase of the expansion
of the Universe, a fact that supports a non-zero cosmological constant.
The confidence intervals that their results put in the
 m -
m -
 plane are
shown in Fig.8.
plane are
shown in Fig.8.

|
Figure 8. Confidence intervals for
( |
These results can be quantified by the following expression [119]:

|
Together with the CMB fluctuation spectrum results we obtain:

|
However, since our understanding of the physics of SNIa'a is not
complete (cf. [92],
[91])
there could be some systematic effect, correlated
with distance (eg. evolution), which could explain the dimming of the
distant SNIa's and thus alleviate the
> 0
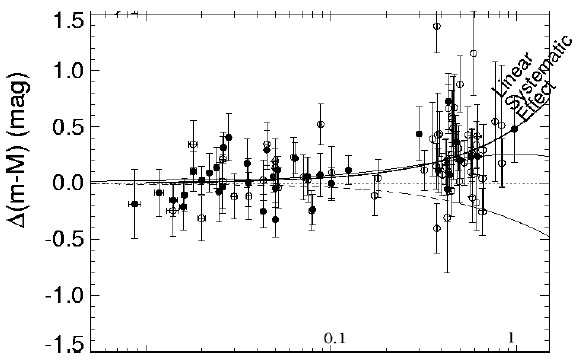
interpretation. In
Fig.9 we show the distance modulus residuals
after subtracting an
open m
= 0.3 Hubble relation. The systematic distant-dependent
effect mimics the accelerated expansion Hubble relation out to
z ~ 0.8 -1. Beyond z ~ 1 the two relations depart due to
the fact that
the accelerated phase has to first pass from a decelerating one
(see discussion in section 1.3) and this
could provide a strong
test for the possible distant dependent systematics. In fact, the
recent discovery of the furthest known supernova (SN 1997ff) at a
redshift of z ~ 1.7
[137],
has provided evidence of the decelerating
phase of the presently accelerating Universe (however, more very
high-z supernovae are necessary to confirm this extraordinary
result).
|
Figure 9. Distance modulus residuals
after subtracting an open
|