


4.3.2. Line features-the 7 keV iron line
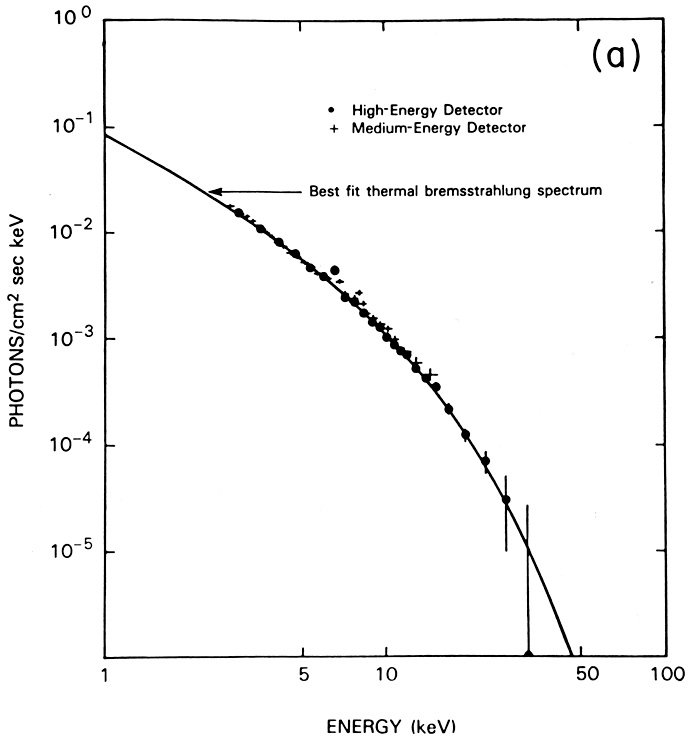
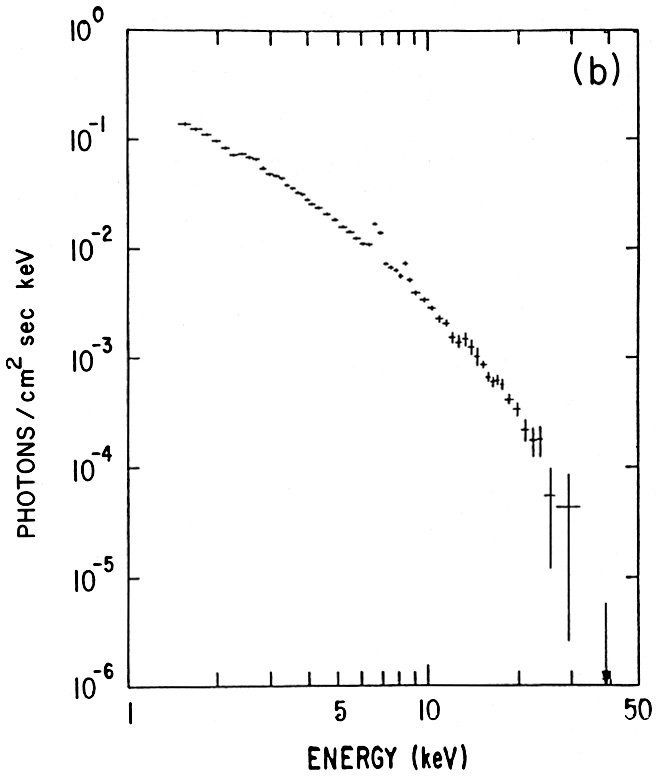
In many ways, the most significant observational discovery concerning X-ray clusters (following their identification as X-ray sources) was the detection of line emission due to highly ionized iron as a strong feature in their X-ray spectra. Immediately, this discovery established that the primary emission mechanism in X-ray clusters was thermal, and that the hot intracluster gas contained at least a significant portion of processed gas, which had at some point been ejected from stars. This line feature was first detected in the spectrum of the Perseus cluster by Mitchell et al. (1976) and shortly thereafter in the spectra of the Coma, Perseus, and Virgo clusters by Serlemitsos et al. (1977). It has subsequently been detected in the spectra of a total of about thirty clusters (Mitchell and Culhane, 1977; Mushotzky et al., 1978; Malina et al., 1978; Berthelsdorf and Culhane, 1979; Mitchell et al., 1979; Mushotzky, 1980, 1984, 1985; Henriksen, 1985; Henriksen and Mushotzky, 1985, 1986). Figure 12 gives the HEAO-1 A-2 spectra of the Coma and Perseus clusters, showing these line features.
|
|
Figure 12. HEAO-1 A-2 low resolution X-ray spectra of clusters, showing the Fe K line at about 7 keV. The plots give the number flux of X-ray photons per cm2-sec-keV versus photon energy in keV, for the (a) Coma (Henriksen and Mushotzky, 1986) and (b) Perseus (Henriksen, 1985) clusters. |
The line feature that was detected is actually a blend of lines from
iron ions
(mainly Fe+24 and Fe+25) and weaker lines from
nickel ions (see Section 5.2.3).
These lines are mainly at photon energies between 6.5 and 7.0 keV; for
convenience, this blend will be referred to as the '7 keV Fe line'. The
resolution of this component structure and the measurement of the relative
intensities of the various components can provide a wealth of diagnostic
information on the physical state and environment of the X-ray emitting gas
(Sarazin and Bahcall,
1977;
Bahcall and Sarazin,
1978).
Unfortunately,
while the Einstein observatory contained a number of high resolution
spectrometers, none were sensitive to the 7 keV Fe lines because the
mirror in Einstein was ineffective for photon energies greater
than about 4 keV.
The application of the Einstein spectrometers to lower energy
lines is
discussed below. However, the proportional counters on the HEAO-1
A-2 experiment had sufficient spectral resolution to resolve the
K line
(3) of
Fe+24 from the
K
line
(3) of
Fe+24 from the
K line in the Centaurus
and Perseus clusters
(Mitchell and Mushotzky,
1980;
Mushotzky, 1980;
see Figure 12). The observation of this line
proves that the emission is thermal in nature, and not the result of the
fluorescence of cold gas through photoionization by an X-ray continuum,
because the fluorescent yield for the
K line is
rather small. In fact, the
observed K
lines are so strong that they require that the X-ray emission
arise from a non-isothermal gas, with both cool and hot temperature
components.
line in the Centaurus
and Perseus clusters
(Mitchell and Mushotzky,
1980;
Mushotzky, 1980;
see Figure 12). The observation of this line
proves that the emission is thermal in nature, and not the result of the
fluorescence of cold gas through photoionization by an X-ray continuum,
because the fluorescent yield for the
K line is
rather small. In fact, the
observed K
lines are so strong that they require that the X-ray emission
arise from a non-isothermal gas, with both cool and hot temperature
components.
The line strengths are often given as 'equivalent widths' or EW. The equivalent width of any line feature is defined as
| (4.4) |
where I is
the observed intensity including the line as a function of
frequency and
Io
is the continuum intensity without the line. The details of
the emission processes for this feature are discussed in
Section 5.2; here we note
that the emissivity of the line is proportional to the square of the
density and to the abundance of iron, and depends significantly on the
electron temperature.
Because the thermal bremsstrahlung emissivity also is proportional to
the square of the density
(Section 5.1.3), the equivalent width
EW of the line is independent
of density as long as the iron is well mixed in the gas (see
Section 5.4.5 for a
discussion of this point). If the shape of the X-ray continuum spectrum of a
cluster is used to derive a temperature or a range of temperatures for
the gas in
the cluster, then the equivalent width of the 7 keV Fe line gives a
measure of the abundance of iron in the gas
(Section 5.2.3;
Figure 35 below). The
abundances by number of atoms determined from the observations of
clusters are all roughly Fe / H
is
the observed intensity including the line as a function of
frequency and
Io
is the continuum intensity without the line. The details of
the emission processes for this feature are discussed in
Section 5.2; here we note
that the emissivity of the line is proportional to the square of the
density and to the abundance of iron, and depends significantly on the
electron temperature.
Because the thermal bremsstrahlung emissivity also is proportional to
the square of the density
(Section 5.1.3), the equivalent width
EW of the line is independent
of density as long as the iron is well mixed in the gas (see
Section 5.4.5 for a
discussion of this point). If the shape of the X-ray continuum spectrum of a
cluster is used to derive a temperature or a range of temperatures for
the gas in
the cluster, then the equivalent width of the 7 keV Fe line gives a
measure of the abundance of iron in the gas
(Section 5.2.3;
Figure 35 below). The
abundances by number of atoms determined from the observations of
clusters are all roughly Fe / H
 2 ×
10-5, which is about one-half of the
solar value (see the detection references above, as well as
Bahcall and Sarazin,
1977).
The upper limits on iron abundances in clusters without line
detections are also generally consistent with this value.
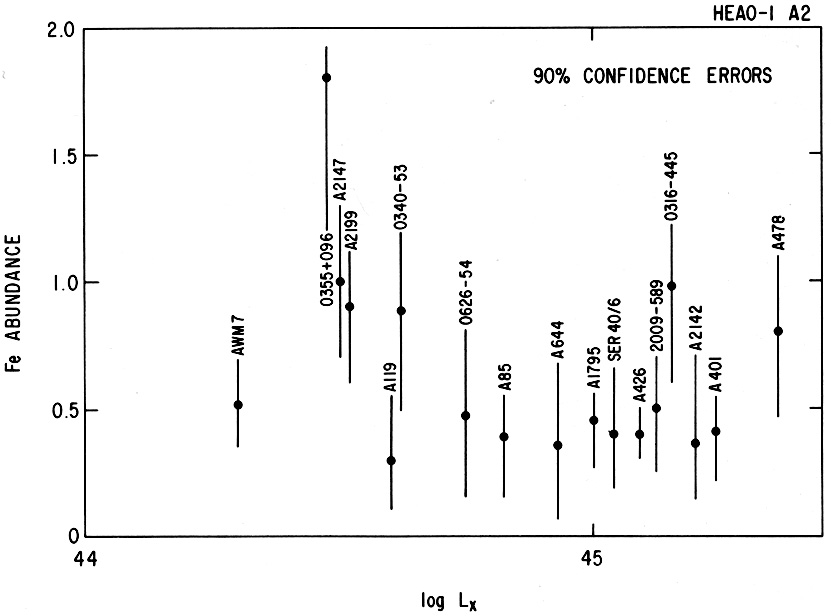
Figure 13 gives
the derived iron abundances for clusters from the HEAO-1 A-2 sample,
plotted as a function of the cluster X-ray luminosity. The uniformity of
the iron abundance suggests that the intracluster gas in clusters has a
similar origin in all clusters, regardless of the dynamical state of the
cluster.
2 ×
10-5, which is about one-half of the
solar value (see the detection references above, as well as
Bahcall and Sarazin,
1977).
The upper limits on iron abundances in clusters without line
detections are also generally consistent with this value.
Figure 13 gives
the derived iron abundances for clusters from the HEAO-1 A-2 sample,
plotted as a function of the cluster X-ray luminosity. The uniformity of
the iron abundance suggests that the intracluster gas in clusters has a
similar origin in all clusters, regardless of the dynamical state of the
cluster.
|
Figure 13. The iron abundance of the gas in clusters as derived from their X-ray spectra, plotted versus their X-ray luminosity, from Mushotzky (1984). The iron abundance is relative to solar, and the X-ray luminosity is in erg/s. |
The strong 7 keV Fe line emission observed from clusters is very difficult to reconcile with any model for the origin of the X-ray emission except the thermal intracluster gas model (Section 5.1.3; a href="Sarazin_refs.html#535" target="ads_dw">Mitchell et al., 1976; Serlemitsos et al., 1977; Bahcall and Sarazin, 1977). This line emission occurs naturally in the intracluster gas model if the abundances of heavy elements are roughly solar (Section 5.2.2). However, it is not at all expected in the IC model (Section 5.1.1) and unlikely in the individual stellar source model because such sources are generally optically thick (Section 5.1.2). Only a small portion of the X-ray luminosity of a typical cluster is emitted in these lines, so it is possible, in principal, that the lines might come from a different source than the majority of the X-ray emission. Several considerations show that this is extremely unlikely. First of all, the required abundances in the intracluster gas are nearly solar, and thus very high abundances would be needed if the lines were to come from gas that provided only a small fraction of the continuum X-ray emission. Second, the abundances derived for all the observed clusters are essentially the same within the errors (Section 4.3.2), although the clusters span a wide range in optical and X-ray properties. A very odd coincidence would be required to produce the appearance of constant abundances in such varied clusters, if the X-ray lines and continuum came from two distinct sources.
As discussed in Sections 5.1.3 and 5.10, the nearly solar iron abundance in the intracluster gas suggests that a significant portion of this gas has been processed in and ejected from stars.
The 7 keV Fe line can be used to determine the redshift of a cluster with moderate accuracy from even low resolution X-ray spectra (Boldt, 1976; Bahcall and Sarazin, 1978). Over a wide range of temperatures, the equivalent width of the 7 keV Fe line is at least an order of magnitude larger than that of any other feature in the spectrum of a hot plasma. Thus the detection of a strong feature at photon energies below 7 keV, coupled with the failure to detect a feature at higher energies up to 7 keV, permits the immediate identification of the feature with the 7 keV Fe line and the determination of a single-line redshift. This application of the 7 keV line has not been useful thus far because the Einstein X-ray observatory could not detect hard X-rays and had too little sensitivity to measure spectra from high redshift clusters. However, it promises to be of great importance in the future (see Chapter 6).
3 This notation gives the principal
quantum number n of the
lower level of the transition and the change in the principal quantum number
 n
n
 n' - n, where
n' is the principal quantum number of
the upper level of the transition.
K indicates that the lower level is in the K-shell (n = 1), L
indicates the
lower level is in the L-shell (n = 2), and so on, while
indicates that
n = 1,
indicates that
n = 2, etc.
Back.
n' - n, where
n' is the principal quantum number of
the upper level of the transition.
K indicates that the lower level is in the K-shell (n = 1), L
indicates the
lower level is in the L-shell (n = 2), and so on, while
indicates that
n = 1,
indicates that
n = 2, etc.
Back.