


4.4. The spatial distribution of X-ray emission
4.4.1. X-ray centers, sizes, and masses
Early Uhuru observations indicated that the X-ray sources were centered on the cluster center, as determined from the galaxy distribution, or on an active galaxy in the cluster (Bahcall, 1977a). In many of the X-ray clusters, the cluster center also corresponds with the position of a cD or other central dominant galaxy.
The earliest X-ray observations showed that the X-ray sources in clusters
were extended. With the nonimaging proportional counters used in these
observations, the spatial resolution of the detectors was usually
determined by
mechanical collimators in front of the detectors and was therefore
relatively crude
(generally an angular resolution of
 1°). Since this
is comparable to the sizes of
the X-ray emission regions in the nearest clusters, the distribution of
emission
could not generally be observed in any detail. Only estimates of the size
could be determined by convolving a model for the distribution of the
emission with the resolution of the detector and comparing the result to the
observations.
1°). Since this
is comparable to the sizes of
the X-ray emission regions in the nearest clusters, the distribution of
emission
could not generally be observed in any detail. Only estimates of the size
could be determined by convolving a model for the distribution of the
emission with the resolution of the detector and comparing the result to the
observations.
Lea et al. (1973), Kellogg and Murray (1974), and Abramopoulos and Ku (1983) derived sizes for cluster X-ray sources, assuming that the gas had the density distribution given by the King approximation to a self-gravitating isothermal sphere (equations 2.9, 2.13)
| (4.5) |
Here,
 g
is the gas density and rx is the X-ray core
radius. While this model is not physically consistent (see
Section 5.5.1), it does provide a
convenient fitting
form for comparison to the galaxy distribution, which is often fit by
the same function. Values of rx were derived from the
X-ray distribution in nine clusters by
Lea et al.
(1973) and
Kellogg and Murray
(1974).
More recently,
equation (4.5) has been fit to the distribution of X-ray emission from 53
clusters detected in an extensive survey of clusters with the
Einstein X-ray observatory
(Abramopoulos and Ku,
1983;
Table 2). In general,
these studies found that the X-ray core radii were significantly larger
than the core radii of the galaxies
(Section 2.7).
These results were fairly
uncertain because of the difficulties in determining either of these radii
accurately.
g
is the gas density and rx is the X-ray core
radius. While this model is not physically consistent (see
Section 5.5.1), it does provide a
convenient fitting
form for comparison to the galaxy distribution, which is often fit by
the same function. Values of rx were derived from the
X-ray distribution in nine clusters by
Lea et al.
(1973) and
Kellogg and Murray
(1974).
More recently,
equation (4.5) has been fit to the distribution of X-ray emission from 53
clusters detected in an extensive survey of clusters with the
Einstein X-ray observatory
(Abramopoulos and Ku,
1983;
Table 2). In general,
these studies found that the X-ray core radii were significantly larger
than the core radii of the galaxies
(Section 2.7).
These results were fairly
uncertain because of the difficulties in determining either of these radii
accurately.
More physically consistent hydrostatic models for the intracluster gas have also been used to fit the observed X-ray distributions (Lea, 1975; Gull and Northover, 1975; Cavaliere and Fusco-Femiano, 1976; Bahcall and Sarazin, 1977; Cavaliere, 1980). One model that has been used extensively is the hydrostatic isothermal model for the intracluster gas (Cavaliere and Fusco-Femiano, 1976, 1981; Bahcall and Sarazin 1977, 1978; Sarazin and Bahcall, 1977; Gorenstein et al., 1978; Jones and Forman, 1984; Section 5.5.1). In this model, both the galaxies and the intracluster gas are assumed to be isothermal, bound to the cluster, and in equilibrium. The galaxies are assumed to have an isotropic velocity dispersion. However, the gas and galaxies are not assumed to have the same velocity dispersion; the square of the ratio of the galaxy-to-gas velocity dispersions is

| (4.6) |
where µ is the mean molecular weight in amu,
mp is the mass of the proton,
 r is the
one-dimensional velocity dispersion, and Tg is the gas
temperature. Then, the gas and galaxy densities vary as
g
r is the
one-dimensional velocity dispersion, and Tg is the gas
temperature. Then, the gas and galaxy densities vary as
g
 gal
gal . If the galaxy distribution
is taken to be a King analytical form for the isothermal sphere
(equation 2.13),
then the X-ray surface brightness Ix(b) at a
projected radius b varies as
. If the galaxy distribution
is taken to be a King analytical form for the isothermal sphere
(equation 2.13),
then the X-ray surface brightness Ix(b) at a
projected radius b varies as
| (4.7) |
where rc is the galaxy core radius
(Section 2.7). The self-gravitating
isothermal model (equation 4.5) has the same surface brightness
distribution if one makes the replacements
= 1 and
rc = rx. These and other models for
the distribution of the intracluster gas will be discussed in detail in
Section 5.5.
The earlest determinations of the extent of the intracluster gas used low
spatial resolution proportional counters. Observations with somewhat higher
spatial resolution were made using detectors with modulation collimators
(Schwarz et al.,
1979)
or one-dimensional imaging detectors
(Gorenstein et
al., 1973).
Some clusters were found to contain compact X-ray sources associated
with the central dominant galaxies in the cluster
(Schnopper et
al., 1977),
such as NGC1275 in the Perseus cluster
(Wolff et al.,
1974,
1975,
1976;
Cash et al.,
1976;
Malina et al.,
1976;
Helmken et al.,
1978).
In Perseus, this point source contributes
20-25% of the X-ray
luminosity at moderate
photon energies (
keV); at very high energies
 20 keV the point
source is dominant
(Primini et al.,
1981;
Rothschild et
al., 1981).
The X-ray
surface brightness of the Perseus cluster was shown to be extended in the
east-west direction
(Wolff et al.,
1974,
1975,
1976;
Malina et al.,
1976;
Cash et al.,
1976);
this is the same direction as the line of bright galaxies
seen optically in this L cluster. Later high resolution observations of the
center of the cluster by
Branduardi-Raymont et
al. (1981)
show a smaller
elongation. A similar but smaller elongation was observed in the X-ray
emission from the Coma cluster
(Johnson et al.,
1979;
Gorenstein et
al., 1979).
20 keV the point
source is dominant
(Primini et al.,
1981;
Rothschild et
al., 1981).
The X-ray
surface brightness of the Perseus cluster was shown to be extended in the
east-west direction
(Wolff et al.,
1974,
1975,
1976;
Malina et al.,
1976;
Cash et al.,
1976);
this is the same direction as the line of bright galaxies
seen optically in this L cluster. Later high resolution observations of the
center of the cluster by
Branduardi-Raymont et
al. (1981)
show a smaller
elongation. A similar but smaller elongation was observed in the X-ray
emission from the Coma cluster
(Johnson et al.,
1979;
Gorenstein et
al., 1979).
The Einstein X-ray telescope has allowed much more accurate
determinations of
the distribution of the X-ray emitting gas in clusters, using the moderate
resolution ( 1 arc
min) Imaging Proportional Counter (IPC) or the High
Resolution Imager (HRI,
8 arc sec). Moderate resolution Einstein IPC images
of the X-ray emission in 46 clusters have been fit by equation (4.7)
(Jones and Forman,
1984).
Because galaxy core radii, velocity dispersions, and
X-ray temperatures are poorly determined for most of these clusters,
both the core radius and
were derived
from the observed X-ray surface
brightness. Table 2 gives the X-ray
luminosities
(Lx), X-ray core radii rx, and
temperature parameters
derived by
Jones and Forman (the entries without an *). Note that the X-ray
luminosity is only for gas within a
projected radius of 0.5 Mpc of the cluster center.
Abramopoulos and Ku
(1983)
fit IPC observations of 53 clusters to equation (4.5); that is,
they assumed
= 1. Table 2 also contains the
results of their fits (the
entries marked with an *) for the clusters with X-ray detections which
were not studied by Jones and Forman. The values of the total X-ray
luminosities of Abramopoulos and Ku were converted to luminosities
within 0.5 Mpc using their best fit X-ray distribution. Of course, the value
of
for all the Abramopoulos and Ku fits is listed as one. It is worth
noting that in nearly every case where both Abramopoulos and Ku, and
Jones and Forman studied the same cluster, Jones and Forman found
best fit values of
which were
much smaller than the
= 1 assumed
by Abramopoulos and Ku, and Jones and Forman could rule out the
value = 1
with high statistical confidence. Thus the validity of the
results of Abramopoulos and Ku is questionable because of the value of
assumed.
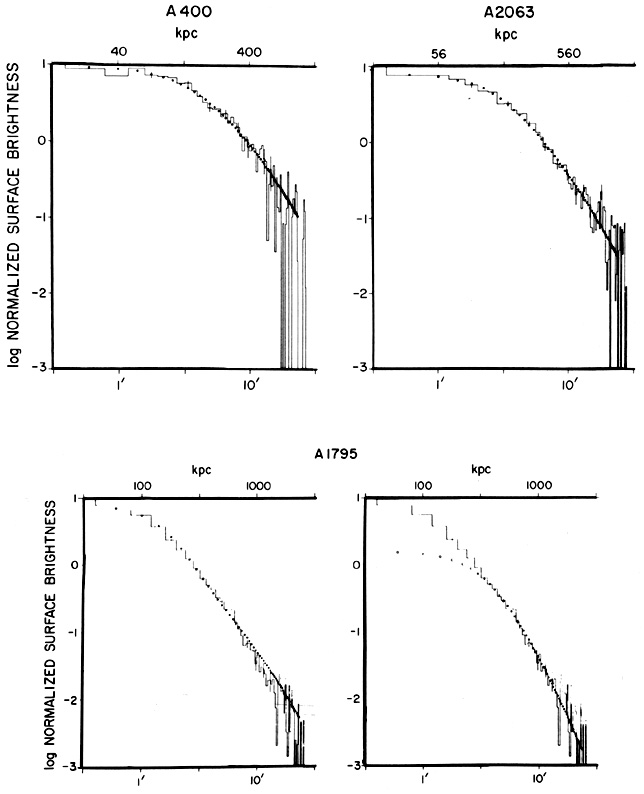
Figure 16 shows the X-ray surface brightness as a function of radius from the center of the X-ray emission (in minutes of arc) for A400, A2063, and A1795 from Jones and Forman (1984). The solid histogram is the data; the dots are the best fit using equation (4.6). About two-thirds of the clusters were fit quite well with this formula; however, one-third appeared to have an excess of emission near the cluster center. For those clusters with a central excess, the central surface brightness points were excluded for the fits given in Table 2. In Figure 16, A400 and A2063 were reasonably fit by equation (4.6), while A1795 was not. The second panel on A1795 shows the fit to equation (4.6) if the central several minutes of arc are ignored. Jones and Forman suggest that this excess central X-ray emission correlates with the radio luminosity of the cluster, and that the excess emission may be due to a cooling flow in the cluster core (Section 5.7). A1795 does in fact have a very large cooling flow (Table 4 below).
|
Figure 16. The X-ray surface brightness of several clusters, as determined by the IPC on the Einstein satellite by Jones and Forman (1984). The surface brightness is normalized to its central value and is given as a function of the angular distance from the cluster center. The solid curves give the observed surface brightness, and the dots are the best fit using equation (4.7). The bottom two panels show the A1795 cluster with the inner eight data points either included in the fit (left) or removed (right). The improvement in the fit in the outer points when the inner regions are removed suggests excess emission in the center, due to a cooling flow. |
A wide range of core radii (0.07 - 0.9h50-1
Mpc) were derived by Jones and
Forman. They found a strong anticorrelation between the presence of
a dominant cluster galaxy in the core and the size of the X-ray core
radius. (Unfortunately,
Abramopoulos and Ku
(1983)
found the opposite effect with their sample of clusters observed with
Einstein.) The average
value of
found by Jones and Forman from the X-ray distributions is
= 0.65,
which implies that the gas is considerably more extensively
distributed than the mass in the cluster. Unfortunately, the average
value of
determined by applying equation (4.6) to those clusters with measured
velocity dispersions and X-ray temperatures is
= 1.1. It is
not clear whether
this discrepancy results from errors in the measured cluster properties,
velocity anisotropies, or a failure of the isothermal model (see
Section 5.5.1).
| References | |||
 |
|||
| Cluster | (M / yr)
/ yr) |
X-ray | Optical |
| A85 | 120 | 25 | 13,4 |
| A262 | 28 | 25 | 14 |
| A400 | 2 | 25 | |
| A426 Perseus | 300 | 15,4 | |
| A496 | 200 | 22,20 | 13,7,4 |
| A576 | 40 | 26,23 | |
| A978 | 500 | 13 | |
| A1060 | 6 | 25 | |
| A1126 | 500 | 13,14 | |
| A1795 | 400 | 25,20 | 13,4 |
| A1983 | 7 | 25 | |
| A1991 | 115 | 25 | |
| A2029 | 250 | 25,20 | 4 |
| A2052 | 120 | 13,14,5 | |
| A2063 | 26 | 25 | |
| A2107 | 18 | 25 | |
| A2142 | 28 | 16 | 4 |
| A2199 | 110 | 25,20 | 4 |
| A2319 | 75 | 25,26 | 4 |
| A2415 | 15 | 25 | |
| A2626 | 10 | 25 | |
| A2657 | 36 | 25 | |
| A2670 | 78 | 25 | |
| SC0107-46 | 4 | 25 | |
| AWM7 | 40 | 3 | |
| 3A0335+096 | 280 | 24,20 | |
| MKW4 | 7 | 18,3 | |
| SC0745-191 | 1000 | 9 | 9 |
| M87/Virgo | 3-20 | 10,11,2,17,20 | 12 |
| Centaurus | 22 | 19 | 8 |
| MKW3s | 100 | 3 | |
| AWM4 | 25 | 3 | |
| SC1842-63 | 3 | 25 | |
| SC2059-247 | 500 | 27 | |
| References | |||
| 1 | Canizares (1981) | 2 | Canizares et al. (1979,1982) |
| 3 | Canizares et al. (1983) | 4 | Cowie et al. (1983) |
| 5 | Demoulin-Ulrich et al. (1984) | 6 | Fabian et al. (1981a) |
| 7 | Fabian et al. (1981b) | 8 | Fabian et al. (1982a) |
| 9 | Fabian et al. (1985) | 10 | Fabricant et al. (1980) |
| 11 | Fabricant and Gorenstein (1983) | 12 | Ford and Butcher (1979) |
| 13 | Heckman (1981) | 14 | Hu et al. (1985) |
| 15 | Kent and Sargent (1979) | 16 | Lea et al. (1981) |
| 17 | Lea et al. (1982) | 18 | Malumuth and Kriss (1986) |
| 19 | Matilsky et al. (1985) | 20 | Mushotzky (1984) |
| 21 | Mushotzky et al. (1981) | 22 | Nulsen et al. (1982) |
| 23 | Rothenflug et al. (1984) | 24 | Schwartz et al. (1980b) |
| 25 | Stewart et al. (1984b) | 26 | White and Silk (1980) |
| 27 | White et al. (1981a) | ||
While in most clusters the X-ray emission was found to be as broadly distributed as the galaxy distribution, an exception was Virgo/M87. Here the soft X-ray emission comes from a small region around M87, while the galaxy core radius of this irregular cluster, although hard to define, is certainly much larger. While early observations suggested the existence of weaker hard X-ray emission originating from a larger region of the cluster (Davison, 1978; Lawrence, 1978), recent observations indicate that this emission actually is due to the nucleus of M87 (Lea et al., 1981, 1982).
The thermal X-ray emission from intracluster gas is proportional to the
emission integral EI (equation 4.3), while the mass of
intracluster gas is
proportional to  npdV. All other things being equal, the mass of
the intracluster gas is then Mg
(Lx
rx3)1/2. Thus, if the size and
distribution of the X-ray
emitting gas can be determined from the X-ray surface brightness, the
mass in
intracluster gas can be estimated. Unfortunately, the estimate is very
uncertain
because the X-ray emission falls off rapidly as the density decreases in
the outer
parts of the cluster, where a large fraction of the mass of the
intracluster gas may
be located. Early estimates of the mass of the intracluster gas based on the
self-gravitating isothermal model (equation 4.7) were given in
Lea et al.
(1973) and
Kellogg and Murray
(1974).
They found that the total mass of
intracluster gas determined from the X-ray observations is similar to
or somewhat larger than the total mass of the galaxies in the cluster
estimated from their total luminosity and a typical galaxy mass-to-light
ratio. However, based on these mass estimates, the intracluster gas is still
only 5-15% of the total virial mass of the cluster, and thus the discovery
of the intracluster gas has not resolved the missing mass problem in
clusters (Section 2.8).
Table 2 gives the intracluster gas
masses (here within 3.0 Mpc radius of the cluster center) from the
Einstein observations of
Abramopoulos and Ku
(1983),
and Jones and Forman
(1984).
Recall that Abramopoulos and Ku assumed that
= 1, which
is generally larger
than the best fit values from Jones and Forman. Reducing the values
of greatly
increases the gas mass for a fixed X-ray luminosity, and
the gas mass actually diverges at large radii for
npdV. All other things being equal, the mass of
the intracluster gas is then Mg
(Lx
rx3)1/2. Thus, if the size and
distribution of the X-ray
emitting gas can be determined from the X-ray surface brightness, the
mass in
intracluster gas can be estimated. Unfortunately, the estimate is very
uncertain
because the X-ray emission falls off rapidly as the density decreases in
the outer
parts of the cluster, where a large fraction of the mass of the
intracluster gas may
be located. Early estimates of the mass of the intracluster gas based on the
self-gravitating isothermal model (equation 4.7) were given in
Lea et al.
(1973) and
Kellogg and Murray
(1974).
They found that the total mass of
intracluster gas determined from the X-ray observations is similar to
or somewhat larger than the total mass of the galaxies in the cluster
estimated from their total luminosity and a typical galaxy mass-to-light
ratio. However, based on these mass estimates, the intracluster gas is still
only 5-15% of the total virial mass of the cluster, and thus the discovery
of the intracluster gas has not resolved the missing mass problem in
clusters (Section 2.8).
Table 2 gives the intracluster gas
masses (here within 3.0 Mpc radius of the cluster center) from the
Einstein observations of
Abramopoulos and Ku
(1983),
and Jones and Forman
(1984).
Recall that Abramopoulos and Ku assumed that
= 1, which
is generally larger
than the best fit values from Jones and Forman. Reducing the values
of greatly
increases the gas mass for a fixed X-ray luminosity, and
the gas mass actually diverges at large radii for
 1. Thus the gas
masses found by Jones and Forman are generally considerably larger than
those found by Abramopoulos and Ku or the earlier studies. As similar
result, using the HEAO-1 A-2 X-ray spectra as well as the Einstein
X-ray images, was found by
Henriksen and Mushotzky
(1985).
Because of uncertainities in the gas and virial mass densities at large
radii, it is difficult to
give an accurate determination of the mass fraction of the intracluster
gas. It does appear likely that, on average, at least 10% of the virial
mass must be in the form of intracluster gas. The fraction of the total
mass in intracluster gas could in some cases be as high as 30-60%, if the
intracluster gas is as extended as the results of Henriksen and Mushotzky
suggest.
1. Thus the gas
masses found by Jones and Forman are generally considerably larger than
those found by Abramopoulos and Ku or the earlier studies. As similar
result, using the HEAO-1 A-2 X-ray spectra as well as the Einstein
X-ray images, was found by
Henriksen and Mushotzky
(1985).
Because of uncertainities in the gas and virial mass densities at large
radii, it is difficult to
give an accurate determination of the mass fraction of the intracluster
gas. It does appear likely that, on average, at least 10% of the virial
mass must be in the form of intracluster gas. The fraction of the total
mass in intracluster gas could in some cases be as high as 30-60%, if the
intracluster gas is as extended as the results of Henriksen and Mushotzky
suggest.