


There are now 82 candidates for multiple image lenses besides those found in rich clusters. Of these candidates, there is little doubt about 74 of them. The ambiguous candidates consist of faint galaxies with nearby arcs and no spectroscopic data. Indeed, the absence of complete spectroscopic information is the bane of most astrophysical applications of lenses. Less than half (38) of the good candidates have both source and lens redshifts - 43 have lens redshifts, 64 have source redshifts, and 5 have neither redshift. Much of this problem could be eliminated in about 5 clear nights of 8m time, but no TAC seems willing to devote the effort even though lens redshifts probably provide more cosmological information per redshift than any other sparsely distributed source. Of these 74 lenses, 10 have had their central velocity dispersions measured and 10 have measured time delays. A reasonably complete summary of the lens data is available at the CASTLES WWW site http://cfa-www.harvard.edu/castles/, although lack of manpower means that it is updated only episodically.
Fig. B.1 shows the distribution of the lenses in
image separation and source redshift.
The separations of the images range from 0."35 to 15."9 (using
either half
the image separations or the mean distance of the images from the lens). The
observed distribution combines both the true separation distribution
and selection effects. For example, in simple statistical models using
standard models for galaxy properties we would expect to find that
the logarithmic separation distribution dN / d
ln
 is nearly constant
at small separations (i.e. dN / d
is nearly constant
at small separations (i.e. dN / d
 ,
Section B.6), while the
raw, observed distribution shows a cutoff due to the finite resolution
of lens surveys (typically 0."25 to 1."0 depending on the
survey). The cutoff
at larger separations is real, and it is a consequence of the vastly higher
lensing efficiency of galaxies relative to clusters created by the
cooling of the
baryons in galaxies (see Section B.7).
,
Section B.6), while the
raw, observed distribution shows a cutoff due to the finite resolution
of lens surveys (typically 0."25 to 1."0 depending on the
survey). The cutoff
at larger separations is real, and it is a consequence of the vastly higher
lensing efficiency of galaxies relative to clusters created by the
cooling of the
baryons in galaxies (see Section B.7).
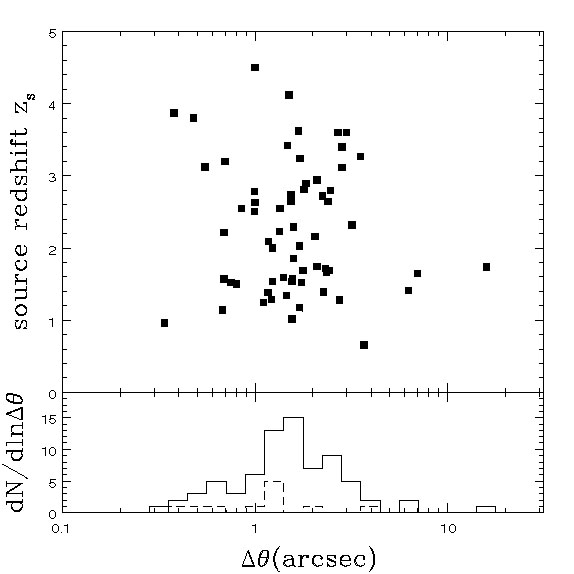 |
Figure B.1. The distribution of lens galaxies
in separation |
Fig. B.2 shows the distribution in image separation and lens galaxy redshift. There is no obvious trend in the typical separation with redshift, as might be expected if there were rapid evolution in the typical masses of galaxies. Unfortunately, there is also an observational bias to measure the redshifts of large separation lenses, where the lens galaxies tend to be brighter and less confused with the images, which makes quantitative interpretation of any trends in separation with redshift difficult. There is probably also a bias against finding large separation, low lens redshift systems because the flux from the lens galaxy will more easily mask the flux from the source. We examine the correlations between image separations and lens magnitudes in Section B.9.
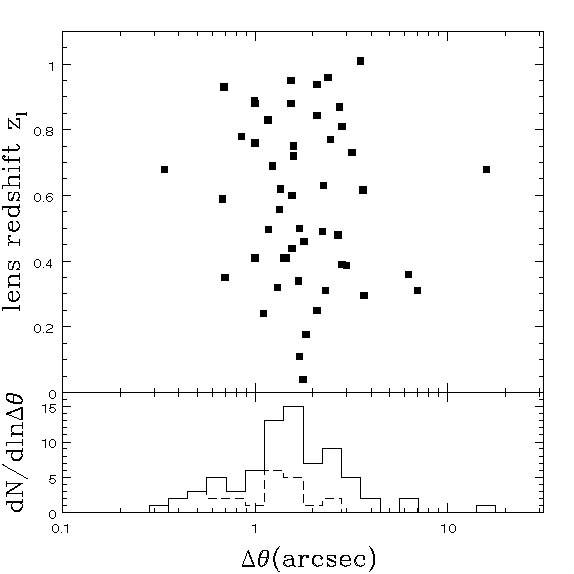 |
Figure B.2. The distribution of lens galaxies
in separation |
In almost all cases the lenses have geometries that are "standard" for models in which the angular structure of the gravitational potential is dominated by the quadrupole moments of the density distribution, either because the lens is ellipsoidal or because the lens sits in a strong external (tidal) shear field. Of the 60 lenses where a compact component (quasar or radio core) is clearly identifiable, 36 are doubles, 2 are triples, 20 are quads, 1 has five images and 1 has six images. The doubles and quads are the standard geometries produced by standard lenses with nearly singular central surface densities. Examples of these basic patterns are shown in Figs. B.3 and B.4.
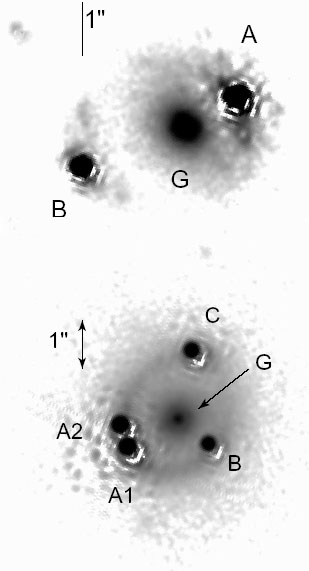 |
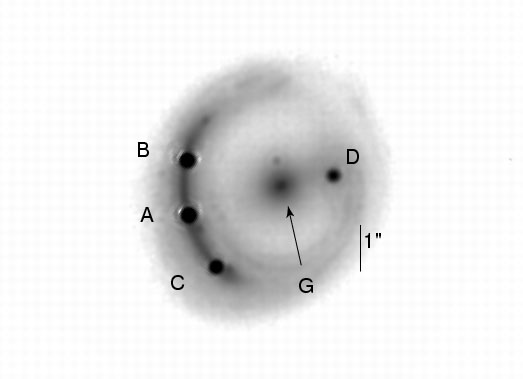
Figure B.3. Standard image geometries. (Top) The two-image lens HE1104-1805. G is the lens galaxy and A and B are the quasar images. We also see arc images of the quasar host galaxy underneath the quasar images. (Bottom) The four-image lens PG1115+080 showing the bright A1 and A2 images created by a fold caustic. (Top, next page) The four-image lens RXJ1131-1231 showing the bright A, B and C images created by a cusp caustic. (Bottom, next page) The four-image lens HE0435-1223, showing the cruciform geometry created by a source near the center of the lens. For each lens we took the CASTLES H-band image, subtracted the bright quasars and then added them back as Gaussians with roughly the same FWHM as the real PSF. This removes the complex diffraction pattern of the HST PSF and makes it easier to see low surface brightness features. |
 |
 |
Figure 4. Standard image geometries continued. See the caption for Fig. B.3. |
In a two-image lens like HE1104-1805 (Wisotzki et al. [1993]), the images usually lie at markedly different distances from the lens galaxy because the source must be offset from the lens center to avoid producing four images. The quads show three generic patterns depending on the location of the source relative to the lens center and the caustics. There are cruciform quads like HE0435-1223 (Wisotzki et al. [2002]), where the images form a cross pattern bracketing the lens. These are created when the source lies almost directly behind the lens. There are fold-dominated quads like PG1115+080 (Weymann et al. [1980]), where the source is close to a fold caustic and we observe a close pair of highly magnified images. Finally, there are cusp-dominated quads like RXJ1131-1231 (Sluse et al. [2003]), where the source is close to a cusp caustic and we observe a close triple of highly magnified images. These are all generic patterns expected from caustic theory, as we discuss in Part 1 and Section B.3. We will discuss the relative numbers of doubles and quads in Section B.6.
The lenses with non-standard geometries all have differing origins. One triple, APM08279+5255 (Irwin et al. [1998], Ibata et al. [1999], Muñoz, Kochanek & Keeton [2001]), is probably an example of a disk or exposed cusp lens (see Section B.3), while the other, PMNJ1632-0033 (Winn et al. [2002a], Winn, Rusin & Kochanek [2004]), appears to be a classical three image lens with the third image in the core of the lens (Fig. B.5). The system with five images, PMNJ0134-0931 (Winn et al. [2002c], Keeton & Winn [2003], Winn et al. [2003]), is due to having two lens galaxies, while the system with six images, B1359+154 (Myers et al. [1999], Rusin et al. [2001]), is a consequence of having three lens galaxies inside the Einstein ring. Many lenses have luminous satellites that are required in any successful lens model, such as the satellites known as "Object X" in MG0414+0534 (Hewitt et al. [1992], Schechter & Moore [1993]) and object D in MG2016+112 (Lawrence et al. [1984] ) shown in Fig. B.6. These satellite galaxies can be crucial parts of lens models, although there has been no systematic study of their properties in the lens sample.
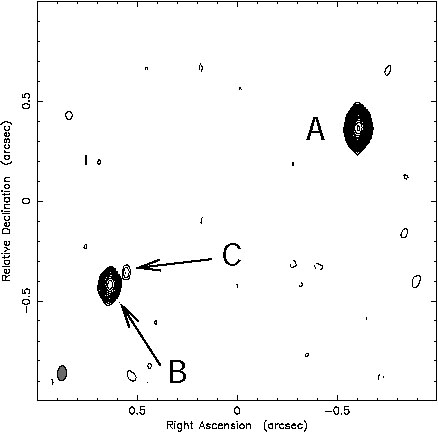 |
Figure B.5. PMN1632-0033 is the only known lens with a "classical" third image in the core of the lens galaxy. The center of the lens galaxy is close to the faint C image. Images A, B and C have identical radio spectra except for the longest wavelength flux of C, which can be explained by absorption in the core of the lens galaxy. Time delay measurements would be required to make the case absolutely secure. A central black hole in the lens galaxy might produce an additional image with a flux about 10% that of image C. (Winn et al. [2004]). |
 |
Figure B.6. H-band images of two lenses with small companions that are crucial for successful models. The upper image shows "Object X" in MG0414+0534, and the lower image shows component D of MG2016+112. MG2016+112 has the additional confusion that only A and B are images of the quasar (Koopmans et al. [2002]). Image C is some combination of emission from the quasar jet (it is an extended X-ray source, Chartas et al. [2001]) and the quasar host galaxy. Object D is known to be at the same redshift as the primary lens galaxy G (Koopmans & Treu [2002]). |
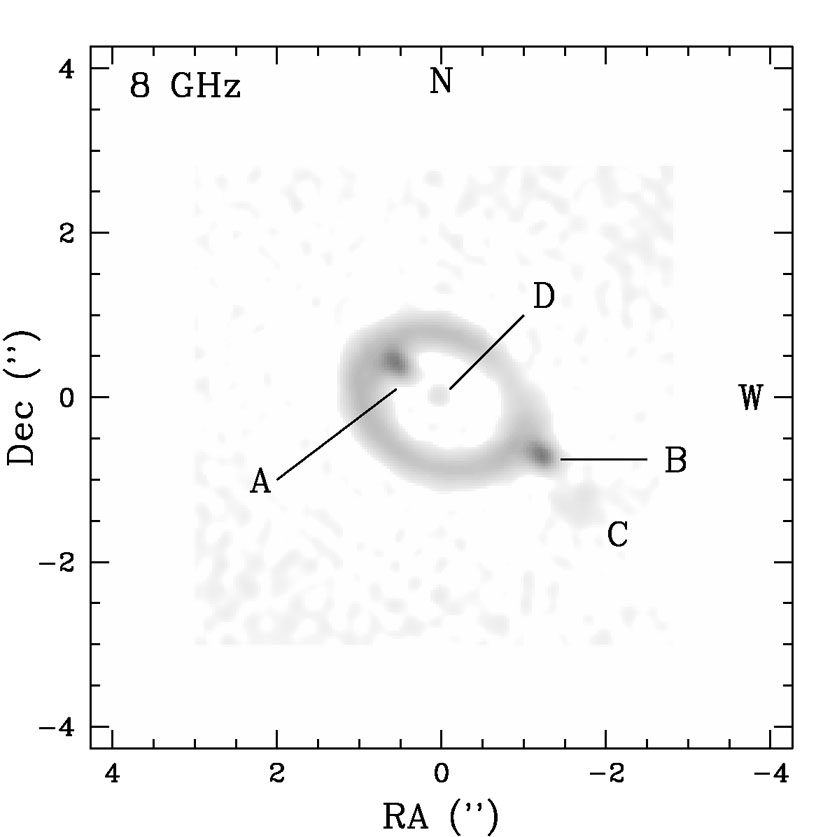
If the structure of the source is more complicated, then the resulting image geometries become more complicated. For example, the source of the radio lens B1933+503 (Sykes et al. [1998]) consists of a radio core and two radio lobes, leading to 10 observable images because the core and one lobe are quadruply imaged and the other lobe is doubly imaged (Fig. B.7). If instead of discrete emission peaks there is a continuous surface brightness distribution, then we observe arcs or rings surrounding the lens galaxy. Fig. B.8 shows examples of Einstein rings for the case of MG1131+0456 (Hewitt et al. [1988]) in both the radio (Chen & Hewitt [1993]) and the infrared (Kochanek et al. [2000]). The radio ring is formed from an extended radio jet, while the infared ring is formed from the host galaxy of the radio source. We also chose most of the examples in Figs. B.3 and B.4 to show prominent arcs and rings formed by lensing the host galaxy of the source quasar. We discuss arcs and rings in Section B.10.
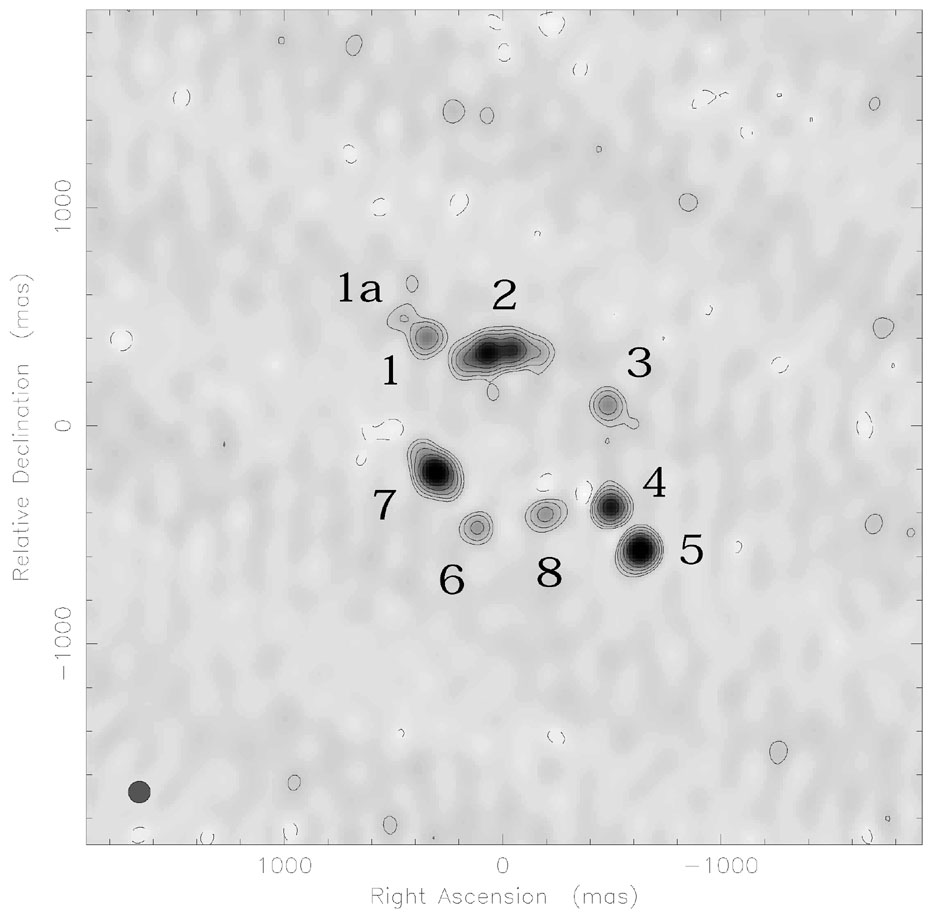 |
Figure B.7. A Merlin map of B1933+503 showing the 10 observed images of the three component source (Marlow et al. [1999]). The flat radio spectrum core is lensed into images 1, 3, 4 and 6. One radio lobe is lensed into images 1a and 8, while the other is lensed into images 2, 7 and 5. Image 2 is really two images merging on a fold. |
 |
 |
Figure B.8. The radio (top) and H-band (bottom) rings in MG11131+0456. The radio map was made at 8 GHz by Chen & Hewitt ([1993]), while the H-band image is from Kochanek et al. ([2000]). The radio source D is probably another example of a central odd image, but the evidence is not as firm as that for PMN1632-0033. Note the perturbing satellite galaxies (G9 and G15) in the H-band image. |