One would think from the number of conference proceeding covers featuring HST images of cluster arcs that these are by far the most common type of lens. In fact, this is an optical delusion created by the ease of finding the rich clusters even though they are exponentially rare. The most common kind of lens is the one produced by a typical massive galaxy - as we saw in in Fig. B.50. For a comparison, Fig. B.51 shows several estimates of the velocity function based on standard CDM mass functions and halo models (from Kochanek & White [2001] and Kochanek [2003c], using the Sheth & Tormen [1999] mass function combined with the NFW halo model from Section B.4.1). We see for high masses or circular velocities that the predicted distribution of halos agrees with the observed distribution of clusters. At the velocities typical of galaxies, the observed density of galaxies is nearly an order of magnitude higher than expected for a CDM halo mass function. At very low velocities we expect many more halos than we observe galaxies. The velocity function estimated from the observed image separations matches that of galaxies with the beginnings of a tail extending onto the distribution of clusters at the high velocity end (Fig. B.51). At low velocities the limited resolution of the present surveys means that the current lens data does not probe the low velocity end very well. In this section we discuss the difference between cluster and galaxy lenses and explain the origin of the break between galaxies and clusters. In Section B.8 on CDM substructure we will discuss the divergence at low circular velocities.
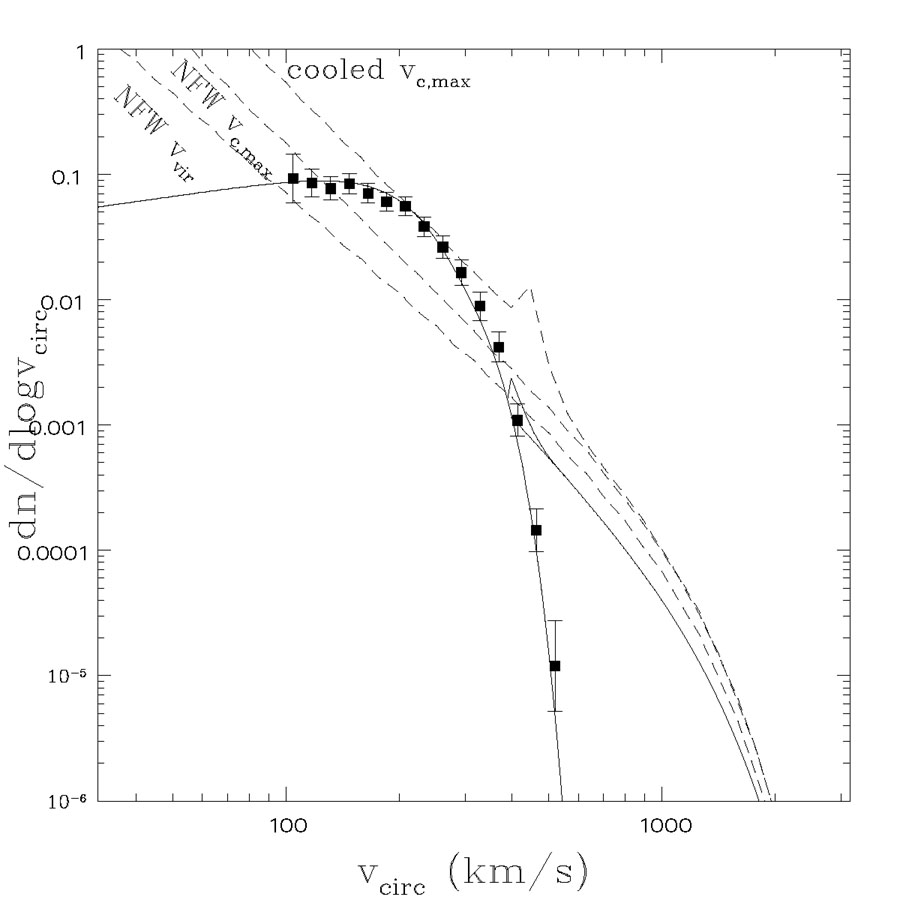 |
Figure B.51. The expected circular velocity
function dn / d log vc of CDM halos
The lowest dashed curve labeled NFW vvir shows the
velocity function using the NFW halo virial
velocity vvir for the circular velocity (see
Section B.4.1). The middle
dashed curve labeled NFW vc, max shows the velocity
function if the peak circular velocity of the halo is used rather than
the virial velocity. The upper dashed curve
is a model in which the baryons of halos with M
|
The standard halo mass function is roughly a power law with dn / dM ~ M-1.8 combined with an exponential cutoff at the mass scale corresponding to the largest clusters that could have formed at any epoch (e.g. the Sheth & Tormen [1999] halo mass function). Typically these rich clusters have internal velocity dispersions above 1000 km/s and can produce image splittings of ~ 30 arcsec. If halo structure was independent of mass, then we would expect the separation distribution of gravitational lenses to show a similar structure - a power law out to the mass scale of rich clusters followed by an exponential cutoff. In Fig. B.52 we compare the observed distribution of radio lenses to that expected from the halo mass function assuming either NFW halos or NFW halos in which the baryons, representing 5% of the halo mass, have cooled and condensed into the centers of the halos (Kochanek & White [2001]). We would find similar curves if we used simple SIS models rather than these more complex CDM-based models (Keeton 1998, Porciani & Madau [2000]). In practice, the most complete survey for multiply imaged sources, the CLASS survey, found a largest separation of 4."5 (B2108+213) despite checking candidates out to separations of 15."0 (Phillips et al. [2001]). The largest lens found in a search for multiply imaged sources has an image separation of roughly 15 arcsec (SDSS1004+4112, Inada et al. [2003]). The overall separation distribution (see Fig. B.52) has a sharp cutoff on scales of 3 arcsec corresponding to galaxies with velocity dispersions of ~ 250 km/s. The principal searches for wide separation lenses are Maoz et al. ([1997]), Ofek et al. ([2001]) and Phillips et al. ([2001]), although most surveys searched for image separations of at least 6."0. A large number of studies focused only on the properties of lenses produced by CDM mass functions (e.g. Narayan & White [1988], Wambsganss et al. [1995], [1998], Kochanek [1995b], Maoz et al. [1997], Flores & Primack [1996], Mortlock & Webster [2000b], Li & Ostriker [2002], Keeton & Madau [2001], Wyithe, Turner & Spergel [2001]). We will not discuss these in detail because such models cannot reproduce the observed separation distributions of lenses. Most recent analyses allow for changes in the density distributions between galaxies and clusters.
 |
Figure B.52. Predicted image separation distributions assuming the structure of halos does not change with halo mass. The heavy solid line shows the prediction for pure NFW models while the light solid (dashed) curves shows the predictions after 5% of the baryons have cooled into a disk (a disk plus a bulge with 10% of the baryonic mass in the bulge). The curves labeled CLASS (for the CLASS survey lenses) and all radio (for all radio selected lenses) show the observed distributions. |
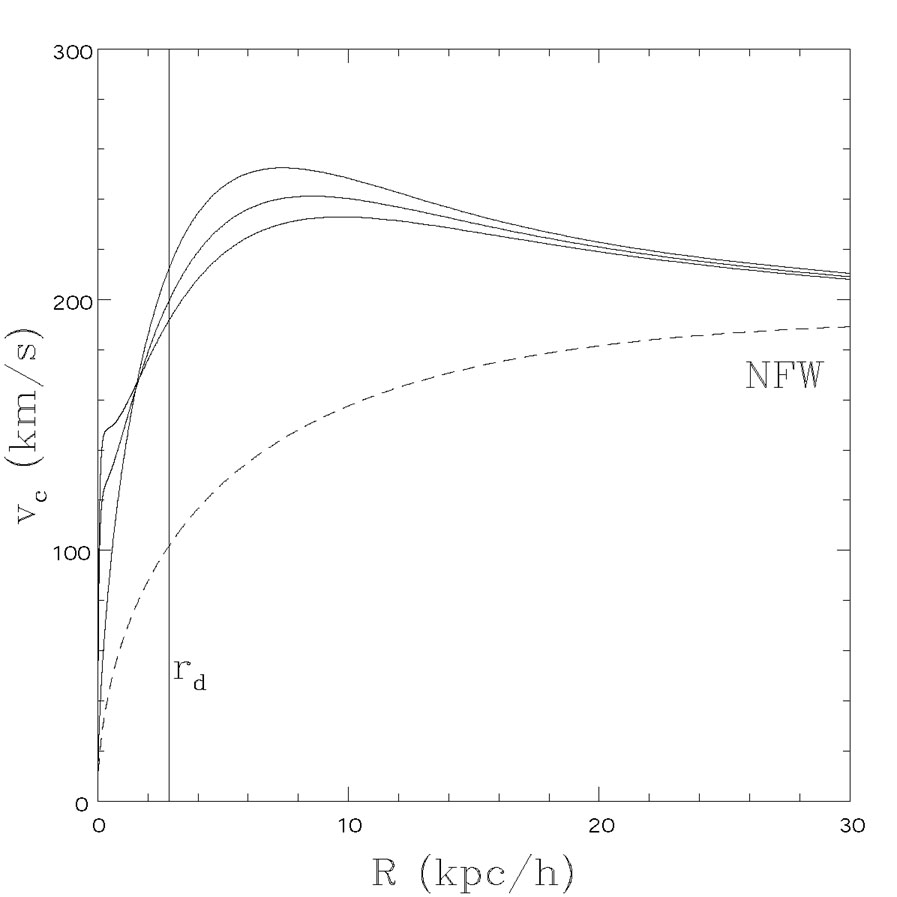
Physically the important difference between galaxies and clusters is
that the baryons in the galaxies have cooled and condensed into the
center of the halo
to form the visible galaxy. As the baryons cool, they also drag some of the
dark matter inward through a process known as adiabatic compression
(Blumenthal et al.
[1986]),
although this is less important than the cooling. As we show in
Fig. B.53, standard dark matter halos are
terrible lenses because their central cusps
(
 r-
r- and
1.5
and
1.5  1) are too shallow. In this
case, a standard NFW halo with a total mass of 1012
M
1) are too shallow. In this
case, a standard NFW halo with a total mass of 1012
M and a
concentration of c = 8 (see Eqns. B.60-B.62) at a redshift of
zl = 0.5 is unable to produce
multiple images of a source at redshift zs = 2 despite
having an asymptotic circular velocity of nearly 200 km/s. If we now
assume that 5% of the mass is in baryons starting with a typical halo
angular momentum and then cooling into a disk of radius
rd while conserving
angular momentum we see that the rotation curve becomes flatter and the
galaxy is now able to produce multiple images. Putting some fraction of
the mass into a still more compact, central bulge make the lens even
more supercritical and the bending angle diagram begins to resemble that
of an SIS lens (see Fig. B.11).
Thus, the cooling of the baryons converts a sub-critical dark matter
halo into one capable of producing multiple images.
and a
concentration of c = 8 (see Eqns. B.60-B.62) at a redshift of
zl = 0.5 is unable to produce
multiple images of a source at redshift zs = 2 despite
having an asymptotic circular velocity of nearly 200 km/s. If we now
assume that 5% of the mass is in baryons starting with a typical halo
angular momentum and then cooling into a disk of radius
rd while conserving
angular momentum we see that the rotation curve becomes flatter and the
galaxy is now able to produce multiple images. Putting some fraction of
the mass into a still more compact, central bulge make the lens even
more supercritical and the bending angle diagram begins to resemble that
of an SIS lens (see Fig. B.11).
Thus, the cooling of the baryons converts a sub-critical dark matter
halo into one capable of producing multiple images.
 |
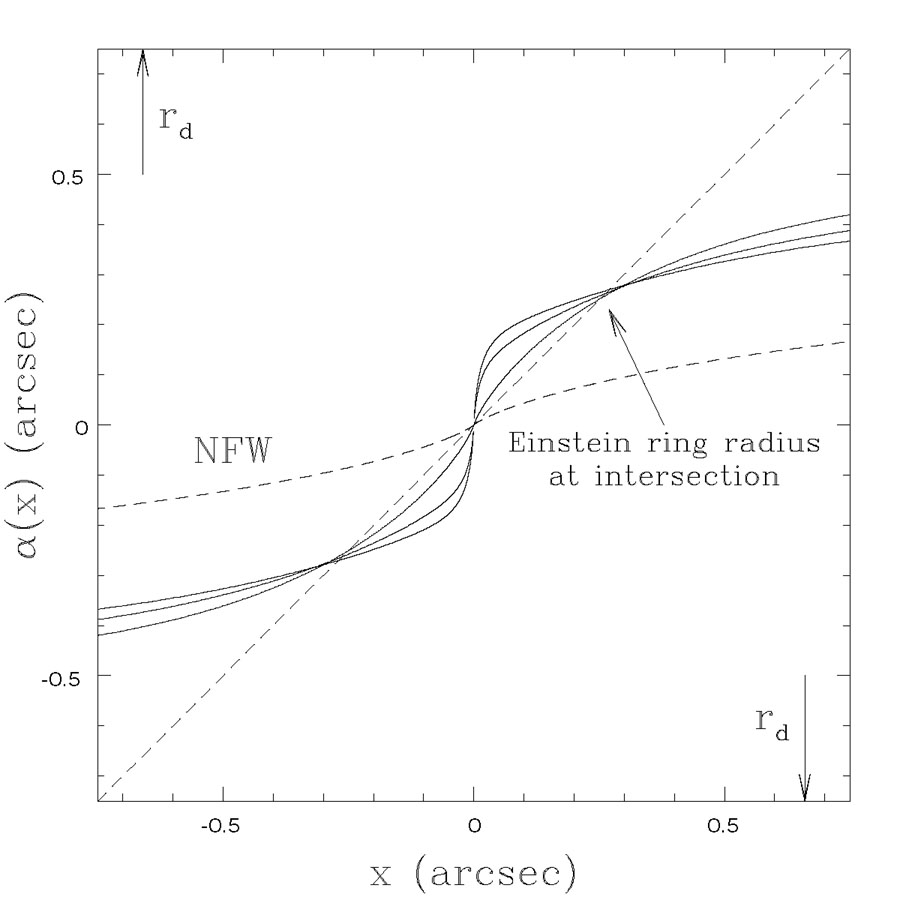 |
Figure B.53. (Top) The rotation curve and
(Bottom) the bending angle
|
The key point is that only intermediate mass halos contain baryons which have cooled. High mass halos (groups and clusters) have cooling times longer than the Hubble time so they have not had time too cool (e.g. Rees & Ostriker [1977]). Most low mass halos also probably resemble dark matter halos more than galaxies with large quantities of cold baryons because they lost their baryons due to heating from the UV background during the initial period of star formation (e.g. Klypin et al. [1999] Bullock, Kravtsov & Weinberg [2000], see Section B.8). Here we ignore the very low mass halos and consider only the distinction between galaxies and groups/clusters. The fundamental realization in recent studies (e.g. Porciani & Madau [2000], Kochanek & White [2001], Kuhlen, Keeton & Madau [2004], Li & Ostriker [2003]) is that introducing a cooling mass scale Mc below which the baryons cool to form galaxies and above which they do not supplies the explanation for the difference between the observed separation distribution of lenses and naive estimates from halo mass functions.
Once we recognize the necessity of introducing a distinction between cluster
and galaxy mass halos, we can use the observed distribution of lens
separations
to constrain the mass scale of the break and the physics of cooling.
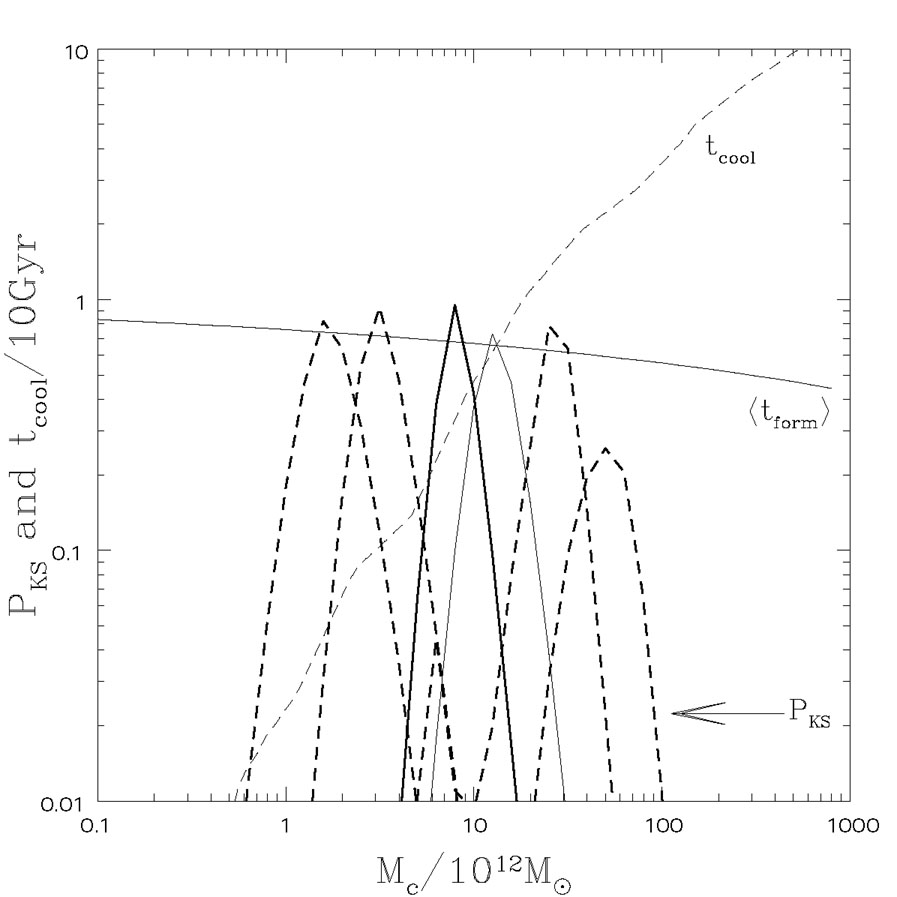
Fig. B.54 shows the most common version of
these studies,
where separation distributions are computed as a function of the cooling
mass scale Mc. We show the separation distributions
for various
cooling mass scales assuming that 5% of the mass cools into a disk
plus a bulge with 10% of the baryonic mass in the bulge for all halos
with M < Mc. If the
cooling mass is either too low or too high we return to the models
of Fig. B.52, while at some intermediate mass
scale we
get the break in the separation distribution to match the observed
angular scale. For these parameters, the optimal cooling mass scale
is Mc  1013
M
(Fig. B.55). This agrees
reasonably well with Porciani & Madau
([2000])
and Kuhlen, Keeton & Madau
([2004])
who found a somewhat higher mass scale
Mc
3 × 10¹³
M using
SIS models
for galaxies. Cosmological hydrodynamic simulations by Pearce et al.
([1999])
also found that approximately 50% of the baryons had cooled
on mass scales near 1013
M. Note,
however, that the mass
scale needed to fit the data depends on the assumed fraction of the mass
in cold baryons.
With fewer cold baryons a halo becomes a less efficient lens producing
smaller image separations so Mc must increase to keep
the break at the observed scale. If the cold baryon fraction is too low
(
1013
M
(Fig. B.55). This agrees
reasonably well with Porciani & Madau
([2000])
and Kuhlen, Keeton & Madau
([2004])
who found a somewhat higher mass scale
Mc
3 × 10¹³
M using
SIS models
for galaxies. Cosmological hydrodynamic simulations by Pearce et al.
([1999])
also found that approximately 50% of the baryons had cooled
on mass scales near 1013
M. Note,
however, that the mass
scale needed to fit the data depends on the assumed fraction of the mass
in cold baryons.
With fewer cold baryons a halo becomes a less efficient lens producing
smaller image separations so Mc must increase to keep
the break at the observed scale. If the cold baryon fraction is too low
( 1%),
it becomes impossible to explain the data at all. Crudely, the
cooling mass scale depends exponentially on the cold baryon fraction with
log Mc /
M
13.6 - (cold
fraction) / 0.15.
1%),
it becomes impossible to explain the data at all. Crudely, the
cooling mass scale depends exponentially on the cold baryon fraction with
log Mc /
M
13.6 - (cold
fraction) / 0.15.
 |
Figure B.54. (Top) Predicted separation
distributions as a function of the
cooling mass scale Mc in which 5% of the mass cools
with 90% of the
cooled material in a disk and 10% in a bulge. The dashed curves show
the distributions for Mc = 1012
M |
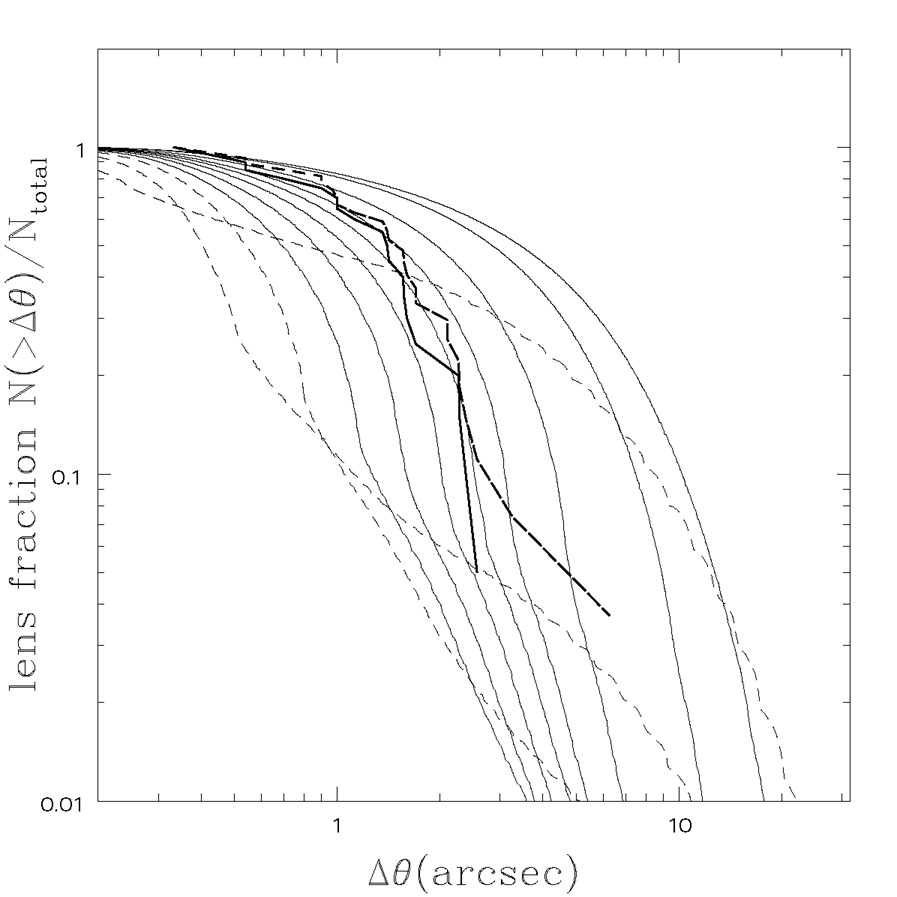 |
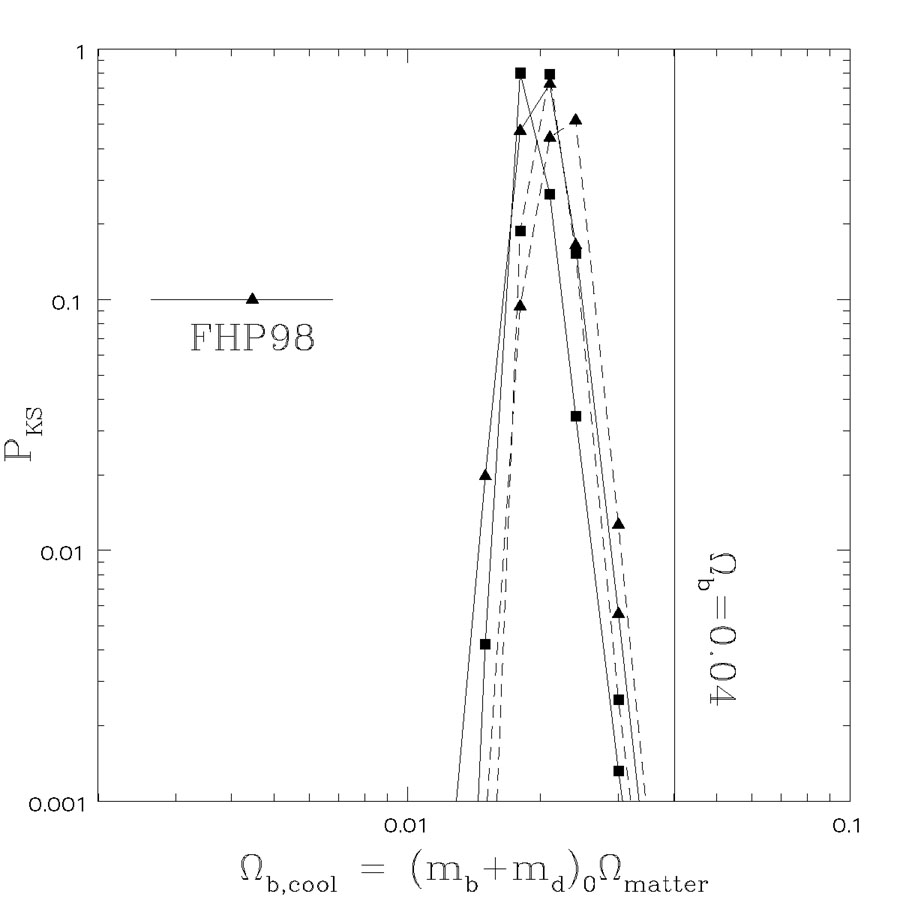
Figure B.56. (Top) Predicted separation
distributions as a function of the cosmological cold baryon density
|
The mass scale of the break and the cold baryon fraction are not independent
parameters and should be derivable from the physics of the cooling gas. In
its full details this must include not only the cooling of the gas but also
reheating of the gas in galaxies due to feedback from star formation.
Fig. B.55 also shows the dependence of the
cooling time scale and the formation time scale for halos of mass
Mc. For this
model (based on the semi-analytic models of Cole et al.
[2000]),
the cooling time
becomes shorter than the age of the halo very close to the mass scale
required to explain the distribution of image separations. These
semi-analytic models suggest an alternate approach in where the
cooling mass scale need not be added as an ad hoc parameter.
We could instead follow the semi-analytic models and use the cooling
function to determine the relative cooling rates of halos with different
masses. We leave as the free parameter, the final cosmological density
in cold baryons
 b,cool
 b
0.04 (i.e. some
baryons may never cool or cool and are reheated by feedback). Low
b,cool
models have difficulty cooling, making them equivalent
to models with a high cooling mass scale. High
b,cool models
cool easily, making them equivalent to models with a high cooling mass
scale. Models with
0.015
b,cool
0.025
agree with the observations. The result depends little on whether
we add a bulge, fit the CLASS sample or all radio lenses or adjust
the cooling curve by a factor of two. Thus, the characteristic scale
of the gravitational lens separation distribution is a probe of the
cosmological baryon density
b and the
fraction of those
baryons that cool in the typical massive galaxy. While it would be
premature to use this as a method for determining
b, it
is interesting to note that our estimate is significantly below
current cosmological estimates that
b
0.04 which
would be consistent with feedback from star formation and other processes
preventing all baryons from cooling, but well above the estimates
of the cold baryon fraction in local galaxies
(0.0045
b,cool
0.0068, Fukugita,
Hogan & Peebles
[1998]).
These are also the models
generating the velocity function estimate with baryonic cooling
in Fig. B.51. The cooling of the baryons shifts the
more numerous low velocity halos to higher circular velocities so
that the models match the observed density of
b
0.04 (i.e. some
baryons may never cool or cool and are reheated by feedback). Low
b,cool
models have difficulty cooling, making them equivalent
to models with a high cooling mass scale. High
b,cool models
cool easily, making them equivalent to models with a high cooling mass
scale. Models with
0.015
b,cool
0.025
agree with the observations. The result depends little on whether
we add a bulge, fit the CLASS sample or all radio lenses or adjust
the cooling curve by a factor of two. Thus, the characteristic scale
of the gravitational lens separation distribution is a probe of the
cosmological baryon density
b and the
fraction of those
baryons that cool in the typical massive galaxy. While it would be
premature to use this as a method for determining
b, it
is interesting to note that our estimate is significantly below
current cosmological estimates that
b
0.04 which
would be consistent with feedback from star formation and other processes
preventing all baryons from cooling, but well above the estimates
of the cold baryon fraction in local galaxies
(0.0045
b,cool
0.0068, Fukugita,
Hogan & Peebles
[1998]).
These are also the models
generating the velocity function estimate with baryonic cooling
in Fig. B.51. The cooling of the baryons shifts the
more numerous low velocity halos to higher circular velocities so
that the models match the observed density of
 v
*
galaxies.
The models do not correctly treat the break region because they allow
"over-cooled" massive groups, but then merge back onto the peak
circular velocity distribution of the CDM halos at higher velocities.
Since the models allow all low mass halos to cool, there is still
a divergence at low circular velocities which is closely related to
the problem of CDM substructure we discuss in
Section B.8.
v
*
galaxies.
The models do not correctly treat the break region because they allow
"over-cooled" massive groups, but then merge back onto the peak
circular velocity distribution of the CDM halos at higher velocities.
Since the models allow all low mass halos to cool, there is still
a divergence at low circular velocities which is closely related to
the problem of CDM substructure we discuss in
Section B.8.
 (x)
for a 1012
M
(x)
for a 1012
M = 0.04) and
adiabatically compressing the dark matter.
The three solid curves show the effect of putting 0%, 10% or 20%
of the baryonic mass into a central bulge. Higher bulge masses raise
the central circular velocity and steepen the central deflection profile.
The final disk scale length is rd. Compare these to
the bending angles of our simple models in
= 0.04) and
adiabatically compressing the dark matter.
The three solid curves show the effect of putting 0%, 10% or 20%
of the baryonic mass into a central bulge. Higher bulge masses raise
the central circular velocity and steepen the central deflection profile.
The final disk scale length is rd. Compare these to
the bending angles of our simple models in