


As described in Section 4, the phenomenon of
accelerated expansion is now well established, and the dark energy density
has been determined to a precision of a few percent. However, getting at
the nature of the dark energy—by measuring its
equation-of-state parameter—is more challenging.
To illustrate, consider that for fixed
 DE, a 1%
change in (constant) w translates to only a 3% (0.3%) change in
dark-energy (total) density at redshift z = 2 and only
a 0.2% change in distances to redshifts z = 1-2.
DE, a 1%
change in (constant) w translates to only a 3% (0.3%) change in
dark-energy (total) density at redshift z = 2 and only
a 0.2% change in distances to redshifts z = 1-2.
The primary effect of dark energy is on the expansion rate of the
Universe; in turn, this affects the redshift-distance relation and the
growth of structure. While dark energy has been important at recent
epochs, we expect that its effects at high redshift were very small,
since otherwise it would have been difficult for large-scale structure
to have formed (in most models). Since
 DE
/ M
DE
/ M
 (1 + z)3w ~ 1 / (1 + z)3, the
redshifts of highest leverage for probing dark energy are expected to be
between a few tenths and two
[Huterer &
Turner 2001].
Four methods hold particular promise in
probing dark energy in this redshift range: type Ia supernovae, clusters
of galaxies, baryon acoustic oscillations, and weak gravitational
lensing. In this section, we describe and compare these four probes,
highlighting their complementarity in terms of both dark energy
constraints and the systematic errors to which they are
susceptible. Because of this complementarity, a multi-pronged approach
will be most effective. The goals of the next generation of dark energy
experiments, described in Section 8, are to
constrain w0 at the few percent level and
wa at the 10% level.
(1 + z)3w ~ 1 / (1 + z)3, the
redshifts of highest leverage for probing dark energy are expected to be
between a few tenths and two
[Huterer &
Turner 2001].
Four methods hold particular promise in
probing dark energy in this redshift range: type Ia supernovae, clusters
of galaxies, baryon acoustic oscillations, and weak gravitational
lensing. In this section, we describe and compare these four probes,
highlighting their complementarity in terms of both dark energy
constraints and the systematic errors to which they are
susceptible. Because of this complementarity, a multi-pronged approach
will be most effective. The goals of the next generation of dark energy
experiments, described in Section 8, are to
constrain w0 at the few percent level and
wa at the 10% level.
While our focus is on these four techniques, we also briefly discuss other dark-energy probes, emphasizing the important supporting role of the CMB.
By providing bright, standardizable candles [Leibundgut 2001], type Ia supernovae constrain cosmic acceleration through the Hubble diagram, cf., Eq. (11). The first direct evidence for cosmic acceleration came from SNe Ia, and they have provided the strongest constraints on the dark energy equation-of-state parameter. At present, they are the most effective and mature probe of dark energy.
SN Ia light curves are powered by the radioactive decays of
56Ni (at
early times) and 56Co (after a few weeks), produced in the
thermonuclear explosion of a carbon-oxygen white dwarf accreting mass from a
companion star as it approaches the Chandrasekhar mass
[Hillebrandt
& Niemeyer 2000].
The peak luminosity is determined by the
mass of 56Ni produced in the explosion
[Arnett 1982]:
if the white dwarf is fully burned, one expects ~ 0.6
M of
56Ni to be
produced. As a result, although the detailed mechanism of SN Ia explosions
remains uncertain (e.g.,
[Hoeflich 2004,
Plewa, Calder &
Lamb 2004]),
SNe Ia are expected to have similar peak luminosities. Since they are
about as bright as a typical galaxy when they peak, SNe Ia can be
observed to large distances, recommending their utility as standard
candles for cosmology.
of
56Ni to be
produced. As a result, although the detailed mechanism of SN Ia explosions
remains uncertain (e.g.,
[Hoeflich 2004,
Plewa, Calder &
Lamb 2004]),
SNe Ia are expected to have similar peak luminosities. Since they are
about as bright as a typical galaxy when they peak, SNe Ia can be
observed to large distances, recommending their utility as standard
candles for cosmology.
In fact, as Fig. 12 shows, SNe Ia are not
intrinsically standard candles, with a
1 spread of order 0.3 mag
in peak B-band luminosity which would limit their
utility. However, work in the early 1990's
[1Phillips 1993]
established an
empirical correlation between SN Ia peak brightness and the rate at
which the luminosity declines with time after peak: intrinsically
brighter SNe Ia decline more slowly. After correcting for this
correlation, SNe Ia turn out to be excellent
"standardizable" candles, with a dispersion of about 15% in
peak brightness.
spread of order 0.3 mag
in peak B-band luminosity which would limit their
utility. However, work in the early 1990's
[1Phillips 1993]
established an
empirical correlation between SN Ia peak brightness and the rate at
which the luminosity declines with time after peak: intrinsically
brighter SNe Ia decline more slowly. After correcting for this
correlation, SNe Ia turn out to be excellent
"standardizable" candles, with a dispersion of about 15% in
peak brightness.
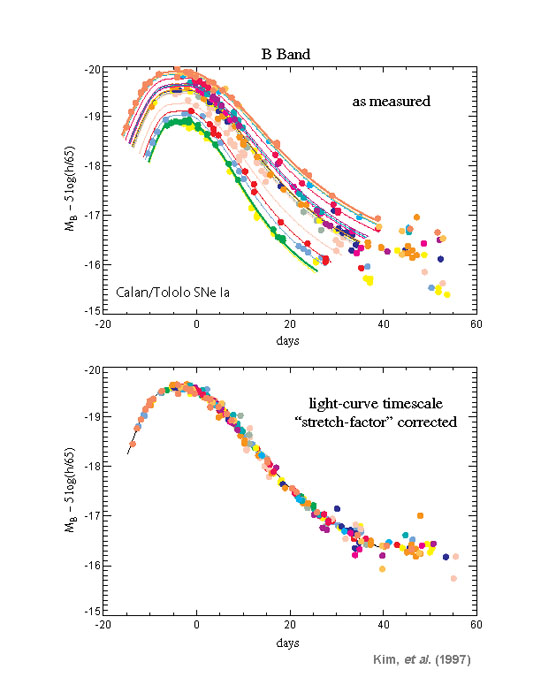 |
Figure 12. Top panel: B-band light curves for low-redshift SNe Ia from the Calan-Tololo survey [Hamuy et al. 1996] show an intrinsic scatter of ~ 0.3 mag in peak luminosity. Bottom panel: After a one-parameter correction for the brightness-decline correlation, the light curves show an intrinsic dispersion of only ~ 0.15 mag. From [Kim 2004]. |
Cosmological parameters are constrained by comparing distances to low-
and high-redshift SNe Ia. Operationally, since
H0 dL is independent of the
Hubble parameter H0, Eq. (11) can be written as
m = 5log10[H0
dL(z;
M,
DE,
w(z))] +  ,
where
,
where
 M - 5log10(H0
Mpc) + 25 is the parameter effectively constrained by the
low-redshift SNe that anchor the Hubble diagram.
M - 5log10(H0
Mpc) + 25 is the parameter effectively constrained by the
low-redshift SNe that anchor the Hubble diagram.
The major systematic concerns for supernova distance measurements are errors in correcting for host-galaxy extinction and uncertainty in the intrinsic colors of SNe Ia; luminosity evolution; and selection bias in the low-redshift sample. For observations in two passbands, with perfect knowledge of intrinsic SN colors or of the extinction law, one could solve for the extinction and eliminate its effects on the distance modulus. In practice, the combination of photometric errors, variations in intrinsic SN colors, and uncertainties and likely variations in host-galaxy dust properties lead to distance uncertainties even for multi-band observations of SNe. Observations that extend into the rest-frame near-infrared, where the effects of extinction are much reduced, offer promise in controlling this systematic.
With respect to luminosity evolution, there is evidence that SN peak luminosity correlates with host-galaxy type (e.g., [Jha, Riess & Kirshner 2007]), and that the mean host-galaxy environment, e.g., the star formation rate, evolves strongly with look-back time. However, brightness-decline-corrected SN Ia Hubble diagrams are consistent between different galaxy types, and since the nearby Universe spans the range of galactic environments sampled by the high-redshift SNe, one can measure distances to high-redshift events by comparing with low-redshift analogs. While SNe provide a number of correlated observables (multi-band light curves and multi-epoch spectra) to constrain the physical state of the system, insights from SN Ia theory will likely be needed to determine if they are collectively sufficient to constrain the mean peak luminosity at the percent level [Hoeflich 2004].
Finally, there is concern that the low-redshift SNe currently used to anchor the Hubble diagram and that serve as templates for fitting distant SN light curves are a relatively small, heterogeneously selected sample and that correlated large-scale peculiar velocities induce larger distance errors than previously estimated [Hui & Greene 2006]. This situation should improve in the near future once results are collected from low-redshift SN surveys such as the Lick Observatory Supernova Search (LOSS), the Center for Astrophysics Supernova project, the Carnegie Supernova Project, the Nearby Supernova Factory, and the Sloan Digital Sky Survey-II Supernova Survey.
Accounting for systematic errors, precision measurement of w0 and wa with SNe will require a few thousand SN Ia light curves out to redshifts z ~ 1.5 to be measured with unprecedented precision and control of systematics [Frieman et al. 2003]. For redshifts z > 0.8, this will require going to space to minimize photometric errors, to obtain uniform light-curve coverage, and to observe in the near-infrared bands to capture the redshifted photons.
Galaxy clusters are the largest virialized objects in the Universe.
Within the context of the CDM paradigm, the number density of
cluster-sized dark matter halos as a function of redshift and halo mass
can be accurately predicted from N-body simulations
[Warren et
al. 2006].
Comparing these predictions to
large-area cluster surveys that extend to high redshift (z
 1) can
provide precise constraints on the cosmic expansion history
[Wang &
Steinhardt 1998,
Haiman, Mohr &
Holder 2001].
1) can
provide precise constraints on the cosmic expansion history
[Wang &
Steinhardt 1998,
Haiman, Mohr &
Holder 2001].
The redshift distribution of clusters in a survey that selects clusters according to some observable O with redshift-dependent selection function f(O, z) is given by
 |
(30) |
where dn(z) / dM is the space density of dark halos in comoving coordinates, and p(O|M,z) is the mass-observable relation, the probability that a halo of mass M at redshift z is observed as a cluster with observable property O. The utility of this probe hinges on the ability to robustly associate cluster observables such as X-ray luminosity or temperature, cluster galaxy richness, Sunyaev-Zel'dovich effect flux decrement, or weak lensing shear, with cluster mass (e.g., [Borgani 2006]).
The sensitivity of cluster counts to dark energy arises from two factors: geometry, the term multiplying the integral in Eq. (30) is the comoving volume element; and growth of structure, dn(z)/dM depends on the evolution of density perturbations, cf. Eq. 15. The cluster mass function is also determined by the primordial spectrum of density perturbations; its near-exponential dependence upon mass is the root of the power of clusters to probe dark energy.
Fig. 13 shows the sensitivity to the dark energy equation-of-state parameter of the expected cluster counts for the South Pole Telescope and the Dark Energy Survey. At modest redshift, z < 0.6, the differences are dominated by the volume element; at higher redshift, the counts are most sensitive to the growth rate of perturbations.
 |
Figure 13. Predicted cluster counts for a
survey covering 4,000 sq. deg. that is sensitive to halos more massive
than 2× 10¹⁴
M |
The primary systematic concerns are uncertainties in the mass-observable relation p(O|M,z) and in the selection function f(O,z). The strongest cosmological constraints arise for those cluster observables that are most strongly correlated with mass, i.e., for which p(O|M,z) is narrow for fixed M, and which have a well-determined selection function. There are several independent techniques both for detecting clusters and for estimating their masses using observable proxies. Future surveys will aim to combine two or more of these techniques to cross-check cluster mass estimates and thereby control systematic error. Measurement of the spatial correlations of clusters and of the shape of the mass function provide additional internal calibration of the mass-observable relation [Majumdar & Mohr 2004, Lima & Hu 2004].
With multi-band CCD imaging, clusters can be efficiently detected as enhancements in the surface density of early-type galaxies, and their observed colors provide photometric redshift estimates that substantially reduce the projection effects that plagued early optical cluster catalogs [Yee & Gladders 2002, Koester et al. 2007]. Weak lensing and dynamical studies show that cluster richness correlates with cluster mass [Johnston et al. 2007] and can be used to statistically calibrate mass-observable relations. Most of the cluster baryons reside in hot, X-ray emitting gas in approximate dynamical equilibrium in the dark matter potential well. Since X-ray luminosity is proportional to the square of the gas density, X-ray clusters are high-contrast objects, for which the selection function is generally well-determined. Empirically, X-ray luminosity and temperature are both found to correlate more tightly than optical richness with virial mass [Arnaud 2005, Stanek et al. 2006].
The hot gas in clusters also Compton scatters CMB photons as they pass through, leading to the Sunyaev-Zel'dovich effect (SZE; [Sunyaev & Zeldovich 1970]), a measurable distortion of the blackbody CMB spectrum. It can be detected for clusters out to high redshift (e.g., [Carlstrom, Holder & Reese 2002]). Since the SZE flux decrement is linear in the gas density, it should be less sensitive to gas dynamics [Nagai 2006, Motl et al. 2005]. Finally, weak gravitational lensing can be used both to detect and to infer the masses of clusters. Since lensing is sensitive to all mass along the line of sight, projection effects are the major concern for shear-selected cluster samples [Hennawi & Spergel 2005, White, van Waerbeke & Mackey 2002].
X-ray or SZE measurements also enable measurements of the baryonic gas
mass in clusters; in combination with the virial mass estimates
described above, this enables estimates of the baryon gas fraction,
fgas
MB / Mtot. The ratio
inferred from X-ray/SZE measurements depends upon cosmological distance
because the inferred baryon mass, MB
dL5/2 (X-ray) or
dL2 (SZE), and the inferred total
mass from X-ray measurements Mtot
dL. If clusters are representative samples of
matter, then fgas(z)
dL3/2 or 1 should
be independent of redshift and
 B
/ M; this
will only be true for the correct cosmology
[Allen et al. 2007,
Rapetti &
Allen 2007].
B
/ M; this
will only be true for the correct cosmology
[Allen et al. 2007,
Rapetti &
Allen 2007].
7.3. Baryon acoustic oscillations
The peaks and troughs seen in the angular power spectrum of the CMB temperature anisotropy (see Fig. 5) arise from gravity-driven acoustic oscillations of the coupled photon-baryon fluid in the early Universe. The scale of these oscillations is set by the sound horizon at the epoch of recombination—the distance s that sound waves in the fluid could have traveled by that time,
 |
(31) |
where the sound speed cs is determined by the ratio of the baryon and photon energy densities. The precise measurement of the angular scales of the acoustic peaks by WMAP has determined s = 147 ± 2 Mpc. After recombination, the photons and baryons decouple, and the effective sound speed of the baryons plummets due to the loss of photon pressure; the sound waves remain imprinted in the baryon distribution and, through gravitational interactions, in the dark matter distribution as well. Since the sound horizon scale provides a "standard ruler" calibrated by the CMB anisotropy, measurement of the baryon acoustic oscillation (BAO) scale in the galaxy distribution provides a geometric probe of the expansion history.
In the galaxy power spectrum, this scale appears as a series of oscillations with amplitude of order 10%, more subtle than the acoustic oscillations in the CMB because the impact of baryons on the far larger dark matter component is small. Measuring the BAO scale from galaxy clustering in the transverse and line-of-sight directions yields measurements of r(z) / s and of sH(z), respectively [Hu & Haiman 2003, Seo & Eisenstein 2003, Blake & Glazebrook 2003]. Spectroscopic redshift surveys can probe both, while photometric surveys are mainly sensitive to transverse clustering. While determining these quantities with precision requires enormous survey volumes and millions of galaxies, N-body simulations suggest that the systematic uncertainties associated with BAO distance scale measurements are smaller than those of other observational probes of dark energy. Because such large numbers of galaxies are needed, BAO measurements provide distance estimates that are coarse-grained in redshift.
The main systematic uncertainties in the interpretation of BAO measurements are the effects of non-linear gravitational evolution, of scale-dependent differences between the clustering of galaxies and of dark matter (bias), and, for spectroscopic surveys, redshift distortions of the clustering, which can shift the BAO features. Numerical studies to date suggest that the resulting shift of the scale of the BAO peak in the galaxy power spectrum is at the percent level or less [Seo & Eisenstein 2007, Guzik, Bernstein & Smith 2007, Smith, Scoccimarro & Sheth 2007], comparable to the forecast measurement uncertainty for future surveys but in principle predictable from high-resolution simulations.
7.4. Weak gravitational lensing
The gravitational bending of light by structures in the Universe distorts or shears the images of distant galaxies; see Fig. 14. This distortion allows the distribution of dark matter and its evolution with time to be measured, thereby probing the influence of dark energy on the growth of structure.
 |
Figure 14. Cosmic shear field (white ticks) superimposed on the projected mass distribution from a cosmological N-body simulation: overdense regions are bright, underdense regions are dark. Note how the shear field is correlated with the foreground mass distribution. Figure courtesy of T. Hamana. |
The statistical signal due to gravitational lensing by large-scale structure is termed "cosmic shear." The cosmic shear field at a point in the sky is estimated by locally averaging the shapes of large numbers of distant galaxies. The primary statistical measure of the cosmic shear is the shear angular power spectrum measured as a function of source-galaxy redshift zs. (Additional information is obtained by measuring the correlations between shears at different redshifts or with foreground lensing galaxies.) The shear angular power spectrum is [Kaiser 1992, Hu & Jain 2004]
 |
(32) |
where  denotes the angular
multipole, the weight function
W(z, zs) is the efficiency for
lensing a population of source galaxies and is determined by the
distance distributions of the source and lens galaxies, and
P(k, z) is the power spectrum of
density perturbations.
denotes the angular
multipole, the weight function
W(z, zs) is the efficiency for
lensing a population of source galaxies and is determined by the
distance distributions of the source and lens galaxies, and
P(k, z) is the power spectrum of
density perturbations.
As with clusters, the dark-energy sensitivity of the shear angular power spectrum comes from two factors: geometry—the Hubble parameter, the angular-diameter distance, and the weight functions; and growth of structure—through the evolution of the power spectrum of density perturbations. It is also possible to separate these effects and extract a purely geometric probe of dark energy from the redshift dependence of galaxy-shear correlations [Jain & Taylor 2003, Bernstein & Jain 2004]. The three-point correlation of cosmic shear is also sensitive to dark energy [Takada & Jain 2004].
The statistical uncertainty in measuring the shear power spectrum on large scales is [Kaiser 1992]
 |
(33) |
where fsky is the fraction of sky area covered
by the survey,
2( i) is the
variance in a single component of the (two-component) shear, and
neff is the effective number density per
steradian of galaxies with well-measured shapes. The first term in
brackets, which dominates on large scales, comes from cosmic variance of
the mass distribution, and the second, shot-noise term results from both
the variance in galaxy ellipticities ("shape noise") and
from shape-measurement errors due to noise in the images.
Fig. 15
shows the dependence on the dark energy of the shear power spectrum and
an indication of the statistical errors expected for a survey such as
LSST, assuming a survey area of 15,000 sq. deg. and effective source
galaxy density of neff = 30 galaxies per
sq. arcmin.
i) is the
variance in a single component of the (two-component) shear, and
neff is the effective number density per
steradian of galaxies with well-measured shapes. The first term in
brackets, which dominates on large scales, comes from cosmic variance of
the mass distribution, and the second, shot-noise term results from both
the variance in galaxy ellipticities ("shape noise") and
from shape-measurement errors due to noise in the images.
Fig. 15
shows the dependence on the dark energy of the shear power spectrum and
an indication of the statistical errors expected for a survey such as
LSST, assuming a survey area of 15,000 sq. deg. and effective source
galaxy density of neff = 30 galaxies per
sq. arcmin.
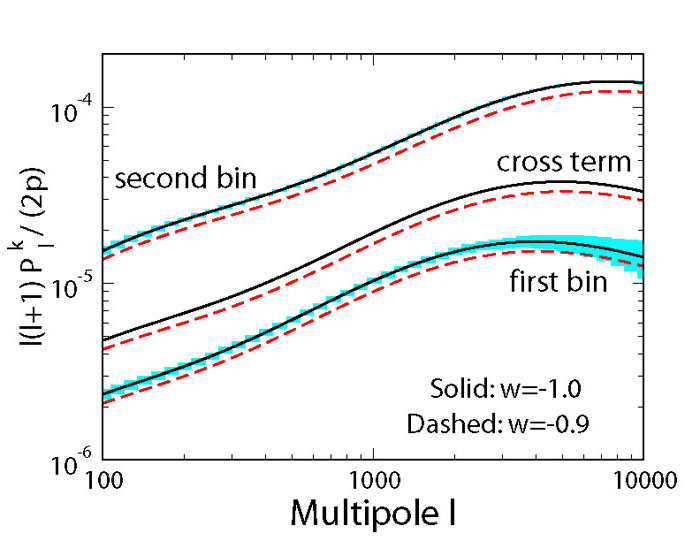 |
Figure 15. Cosmic shear angular power spectrum and statistical errors expected for LSST (see Section 8) for w = -1 and -0.9. For illustration, results are shown for source galaxies in two broad redshift bins, zs = 0-1 (first bin) and zs = 1-3 (second bin); the cross-power spectrum between the two bins (cross term) is shown without the statistical errors. |
Systematic errors in weak lensing measurements arise from a number of
sources
[Huterer et
al. 2006]:
incorrect shear estimates, uncertainties in galaxy
photometric redshift estimates, intrinsic correlations of galaxy shapes, and
theoretical uncertainties in the mass power spectrum on small scales. The
dominant cause of galaxy shape measurement error in current lensing
surveys is the anisotropy of the image point spread function (PSF)
caused by optical and CCD distortions, tracking errors, wind shake,
atmospheric refraction, etc. This error can be diagnosed since there are
geometric constraints on the shear patterns that can be produced by
lensing that are not respected by systematic effects.
A second kind of shear measurement error arises from miscalibration of the
relation between measured galaxy shape and inferred shear,
arising from inaccurate correction for the
circular blurring of galaxy images due to atmospheric seeing.
Photometric redshift errors impact shear power spectrum estimates primarily
through uncertainties in the scatter and bias of photometric redshift
estimates in redshift bins
[Huterer et
al. 2006,
Ma, Hu & Huterer
2006].
Any tendency of galaxies to align with their neighbors — or to
align with the local mass distribution — can be confused with
alignments caused by
gravitational lensing, thus biasing dark energy determinations
[Hirata &
Seljak 2004,
Heymans et
al. 2006].
Finally, uncertainties in the theoretical mass power
spectrum on small scales could complicate attempts to use the high-multipole
(
several hundred)
shear power spectrum to constrain dark
energy. Fortunately, weak lensing surveys should be able to internally
constrain the impact of such effects
[Zentner, Rudd
& Hu 2007].
While the four methods discussed above have the most probative power, a number of other methods have been proposed, offering the possibility of additional consistency checks. The Alcock-Paczynski test exploits the fact that the apparent shapes of intrinsically spherical cosmic structures depend on cosmology [Alcock & Paczynski 1979]. Since spatial clustering is statistically isotropic, the anisotropy of the two-point correlation function along and transverse to the line of sight has been proposed for this test, e.g., using the Lyman-alpha forest [Hui, Stebbins & Burles 1999].
Weak lensing of the CMB anisotropy by foreground clusters, in combination with lensing of galaxies, provides a potential geometric probe of dark energy (e.g., [Hu, Holz & Vale 2007]).
The Integrated Sachs-Wolfe (ISW) effect provided a confirmation of
cosmic acceleration, cf.
Section 4.1.2. ISW impacts the large-angle
structure of the CMB anisotropy, but
low- multipoles are subject
to large cosmic variance, limiting their power. Nevertheless, ISW is of
interest because it may be able to show the imprint of large-scale
dark-energy perturbations
[Coble, Dodelson &
Frieman 1997,
Hu &
Scranton 2004].
Gravitational radiation from inspiraling binary neutron stars or black holes can serve as "standard sirens" to measure absolute distances. If their redshifts can be determined, then they could be used to probe dark energy through the Hubble diagram [Dalal et al. 2006].
Long-duration gamma-ray bursts have been proposed as standardizable candles (e.g., [1452003Schaefer]), but their utility as cosmological distance indicators that could be competitive with or complementary to SNe Ia has yet to be established [Friedman & Bloom 2005]. The angular size-redshift relation for double radio galaxies has also been used to derive cosmological constraints that are consistent with dark energy [Guerra, Daly & Wan 2000]. The optical depth for strong gravitational lensing (multiple imaging) of QSOs or radio sources has been proposed [Fukugita et al. 1992] and used (e.g., [Mitchell et al. 2005, Chae 2007]) to provide independent evidence for dark energy, though these measurements depend on modeling the density profiles of lens galaxies.
Polarization measurements from distant galaxy clusters in principle provide a sensitive probe of the growth function and hence dark energy [Cooray, Huterer & Baumann 2004]. The relative ages of galaxies at different redshifts, if they can be determined reliably, provide a measurement of dz/dt and, from Eq. (13), measure the expansion history directly [Jimenez & Loeb 2002]. Measurements of the abundance of lensed arcs in galaxy clusters, if calibrated accurately, provide a probe of dark energy [Meneghetti et al. 2005].
As we have stressed, there is every reason to expect that at early times dark energy was but a tiny fraction of the energy density. Big bang nucleosynthesis and CMB anisotropy have been used to test this prejudice, and current data already indicate that dark energy at early times contributes no more than ~ 5% of the total energy density [Bean, Hansen & Melchiorri 2001, Doran & Robbers 2006].
While the CMB provides precise cosmological constraints, by itself it has little power to probe dark energy (see Fig. 17). The reason is simple: the CMB provides a single snapshot of the Universe at a time when dark energy contributed but a tiny part of the total energy density (a part in 109 for vacuum energy). Nonetheless, the CMB plays a critical supporting role by determining other cosmological parameters, such as the spatial curvature and matter density, to high precision, thereby considerably strengthening the power of the methods discussed above, cf. Fig. 8. It also provides the standard ruler for BAO measurements. Data from the Planck CMB mission, scheduled for launch in 2008, will complement those from dark energy surveys. If the Hubble parameter can be directly measured to better than a few percent, in combination with Planck it would also provide powerful dark energy constraints [Hu 2005].
7.7. Probing new gravitational physics
In Section 5.2 we discussed the possibility that cosmic acceleration could be explained by a modification of General Relativity on large scales. How can we distinguish this possibility from dark energy within GR and/or test the consistency of GR to explain cosmic acceleration? Since modified gravity can change both the Friedmann equation and the evolution of density perturbations, a strategy for testing the consistency of GR and dark energy as the explanation for acceleration is to compare results from the geometric (expansion history) probes, e.g., SNe or BAO, with those from the probes sensitive to the growth of structure, e.g., clusters or weak lensing. Differences between the two could be evidence for the need to modify GR [Knox, Song & Tyson 2006]. A first application of this idea to current data shows that standard GR passes a few modest consistency tests [Chu & Knox 2005, Wang et al. 2007].
Finally, any modification of gravity may have observable effects beyond cosmology, and precision solar system tests can provide important additional constraints (e.g., [Lue, Scoccimarro & Starkman 2004]).
Four complementary cosmological techniques have the power to probe dark energy with high precision and thereby advance our understanding of cosmic acceleration: Weak Gravitational Lensing (WL); type Ia supernovae (SN); Baryon Acoustic Oscillations (BAO); and Galaxy Clusters (CL). To date, constraints upon the dark energy equation-of-state parameter have come from combining the results of two or more techniques, e.g., SN+BAO+CMB (see Fig. 8) or BAO+CMB (see Table 1), in order to break cosmological parameter degeneracies. In the future, each of these methods, in combination with CMB information that constrains other cosmological parameters, will provide powerful individual constraints on dark energy; collectively, they should be able to approach percent-level precision on w at its best-constrained redshift, i.e., wp (see Fig. 17).
 |
Figure 16. Relative statistical power of different dark energy space probes, separately and in combination, in constraining the DETF Figure of Merit (FoM) (see Section 11). Bars indicate estimated range of increase (allowing for uncertainties in systematic errors) in the FoM relative to present experiments. Adopted from the DETF report [Albrecht et al. 2006]. |
Table 2 summarizes these four dark energy probes, their strengths and weaknesses and primary systematic errors. Fig. 16 gives a visual impression of the statistical power of each of these techniques in constraining dark energy, showing how much each of them could be expected to improve our present knowledge of w0 and wa in a dedicated space mission [Albrecht et al. 2006].
| Method | Strengths | Weaknesses | Systematics |
| WL | growth+geometric, | CDM assumption | image quality, |
| statistical power | photo-z | ||
| SN | purely geometric, | standard candle | evolution, |
| mature | assumption | dust | |
| BAO | largely geometric, | large samples | bias, |
| low systematics | required | non-linearity | |
| CL | growth+geometric, | CDM assumption | determining mass, |
| X-ray+SZ+optical | selection function | ||