


Since the supernova discoveries were announced in 1998, the evidence for an accelerating Universe has become substantially stronger and more broadly based. Subsequent supernova observations have reinforced the original results, and new evidence has accrued from other observational probes. In this section, we review these developments and discuss the current status of the evidence for cosmic acceleration and what we know about dark energy. In Section 7, we address the probes of cosmic acceleration in more detail, and we discuss future experiments in Section 8.
4.1. Cosmic microwave background and large-scale structure
An early and important confirmation of accelerated expansion was the
independent evidence for dark energy from measurements of CMB anisotropy
[Jaffe et al. 2001,
Pryke et al. 2002]
and of large-scale structure
(LSS). The CMB constrains the amplitude of the primordial fluctuations
that give rise to the observed structure as well as the distance to the
last-scattering surface, r(z
 1100). In order to
allow sufficient growth of the primordial perturbations and not disrupt
the formation of large-scale structure, dark energy must come to
dominate the Universe only very recently (see
Section 2.3), implying that its energy
density must evolve with redshift more slowly than matter. This occurs
if it has negative pressure, w < 0, cf. Eq. (5). Likewise, the
presence of a component with large negative pressure that accounts for
three-quarters of the critical density affects the distance to the
last-scattering surface.
1100). In order to
allow sufficient growth of the primordial perturbations and not disrupt
the formation of large-scale structure, dark energy must come to
dominate the Universe only very recently (see
Section 2.3), implying that its energy
density must evolve with redshift more slowly than matter. This occurs
if it has negative pressure, w < 0, cf. Eq. (5). Likewise, the
presence of a component with large negative pressure that accounts for
three-quarters of the critical density affects the distance to the
last-scattering surface.
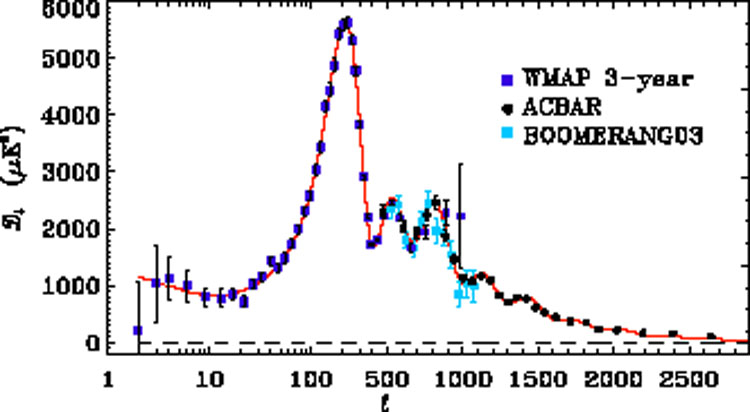
4.1.1 CMB Anisotropies of the cosmic microwave background provide a record of the Universe at a simpler time, before structure had developed and when photons were decoupling from baryons, about 380,000 years after the Big Bang [Hu & Dodelson 2002]. The angular power spectrum of CMB temperature anisotropies, measured most recently by WMAP [Spergel et al. 2007] and by ground-based experiments that probe to smaller angular scales, is dominated by acoustic peaks that arise from gravity-driven sound waves in the photon-baryon fluid (see Fig. 5a). The positions and amplitudes of the acoustic peaks encode a wealth of cosmological information. They indicate that the Universe is nearly spatially flat to within a few percent. In combination with LSS or with independent H0 measurement, the CMB measurements indicate that matter contributes only about a quarter of the critical density. A component of missing energy that is smoothly distributed is needed to square these observations - and is fully consistent with the dark energy needed to explain accelerated expansion.
 |
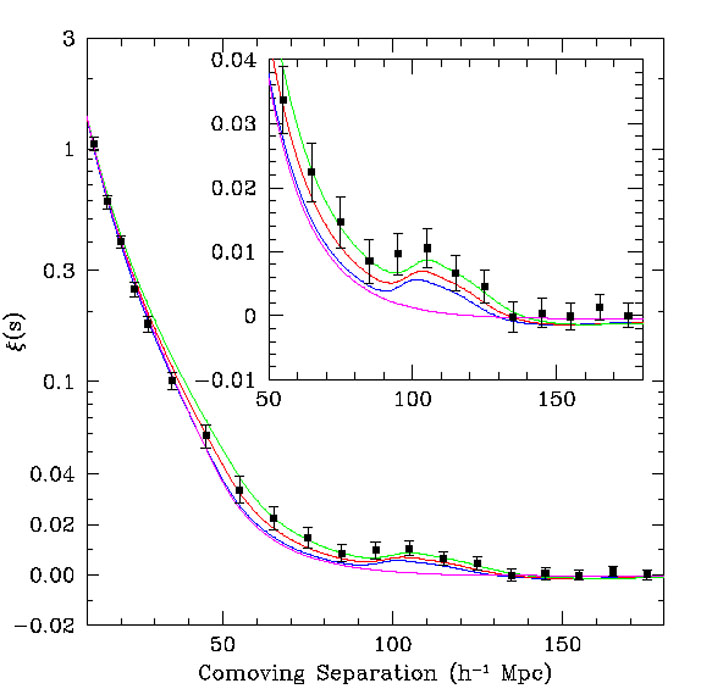 |
Figure 5. Left panel:
Angular power spectrum measurements of the
CMB temperature fluctuations from WMAP, Boomerang, and ACBAR.
Red curve shows the best-fit
|
|
4.1.2. Large-scale Structure Baryon acoustic oscillations (BAO), so prominent in the CMB anisotropy, leave a subtler characteristic signature in the clustering of galaxies, a bump in the two-point correlation function at a scale ~ 100 Mpc that can be measured today and in the future can provide a powerful probe of dark energy (see Section 7.3). Measurement of the BAO signature in the correlation function of SDSS luminous red galaxies (see Fig. 5b) constrains the distance to redshift z = 0.35 to a precision of 5% [Eisenstein et al. 2005]. This measurement serves as a significant complement to other probes, as shown in Fig.8.
The presence of dark energy affects the large-angle anisotropy of the
CMB (the low- multipoles)
through the integrated Sachs-Wolfe (ISW) effect. The
ISW arises due to the differential redshifts of photons as they pass through
time-changing gravitational potential wells, and it leads to a small
correlation
between the low-redshift matter distribution and the CMB anisotropy. This
effect has been observed in the cross-correlation of the CMB with
galaxy and radio source catalogs
[Boughn
& Crittenden 2004,
Fosalba
& Gaztanaga 2004,
Afshordi,
Loh & Strauss 2004,
Scranton et
al. 2003].
This signal indicates that the Universe is not described by the
Einstein-de Sitter model
(
multipoles)
through the integrated Sachs-Wolfe (ISW) effect. The
ISW arises due to the differential redshifts of photons as they pass through
time-changing gravitational potential wells, and it leads to a small
correlation
between the low-redshift matter distribution and the CMB anisotropy. This
effect has been observed in the cross-correlation of the CMB with
galaxy and radio source catalogs
[Boughn
& Crittenden 2004,
Fosalba
& Gaztanaga 2004,
Afshordi,
Loh & Strauss 2004,
Scranton et
al. 2003].
This signal indicates that the Universe is not described by the
Einstein-de Sitter model
( M = 1),
a reassuring cross-check.
M = 1),
a reassuring cross-check.
Weak gravitational lensing
[Schneider
2006,
Munshi et
al. 2006],
the small, correlated distortions of galaxy shapes due to gravitational
lensing by intervening large-scale structure, is a powerful technique
for mapping dark matter and its clustering. Detection of this cosmic
shear signal was first announced by four groups in 2000
[Bacon, Refregier
& Ellis 2000,
Kaiser, Wilson
& Luppino 2000,
Van Waerbeke et
al. 2000,
Wittman et al. 2000].
Recent lensing surveys covering areas of order 100 square degrees have shed
light on dark energy by pinning down the combination
 8
(M /
0.25)0.6
8
(M /
0.25)0.6  0.85 ± 0.07, where
8 is the rms
amplitude of mass fluctuations on the 8 h-1 Mpc scale
[Jarvis et
al. 2006,
Hoekstra et
al. 2006,
Massey et al. 2007].
Since other measurements peg
8 at
0.8, this implies that
M
0.25, consistent with
a flat Universe dominated by dark energy. In the future, weak lensing
has the potential to be the most powerful probe of dark energy
[Huterer
2002,
Hu 2002],
and this is discussed in Section 7 and
Section 8.
0.85 ± 0.07, where
8 is the rms
amplitude of mass fluctuations on the 8 h-1 Mpc scale
[Jarvis et
al. 2006,
Hoekstra et
al. 2006,
Massey et al. 2007].
Since other measurements peg
8 at
0.8, this implies that
M
0.25, consistent with
a flat Universe dominated by dark energy. In the future, weak lensing
has the potential to be the most powerful probe of dark energy
[Huterer
2002,
Hu 2002],
and this is discussed in Section 7 and
Section 8.
A number of
concerns were raised about the robustness of the first SN evidence
for acceleration, e.g., it was suggested that distant SNe could
appear fainter due to extinction by hypothetical
grey dust rather than acceleration
[Drell, Loredo & Wasserman 2000,
Aguirre 1999].
Over the intervening decade, the supernova evidence for acceleration has
been strengthened by results from a series of SN
surveys. Observations with the Hubble Space Telescope (HST) have provided
high-quality light curves
[Knop et al. 2003]
and have extended SN measurements to
redshift z 1.8,
providing evidence for the expected earlier epoch of
deceleration and disfavoring dust extinction as an alternative
explanation to acceleration
[Riess et al. 2001,
Riess et al. 2004,
Riess et al. 2007].
Two large ground-based surveys, the Supernova Legacy Survey (SNLS)
[Astier et al. 2006]
and the ESSENCE survey
[Miknaitis et
al. 2007],
have been using 4-meter telescopes to measure
light curves for several hundred SNe Ia over the redshift range z ~
0.3-0.9, with large programs of spectroscopic follow-up on 6- to 10-m
telescopes. Fig. 6 shows a compilation of SN
distance
measurements from these and other surveys. The quality and quantity
of the distant SN data are now vastly superior to what was available in
1998, and the evidence for acceleration is correspondingly more
secure (see Fig. 8).
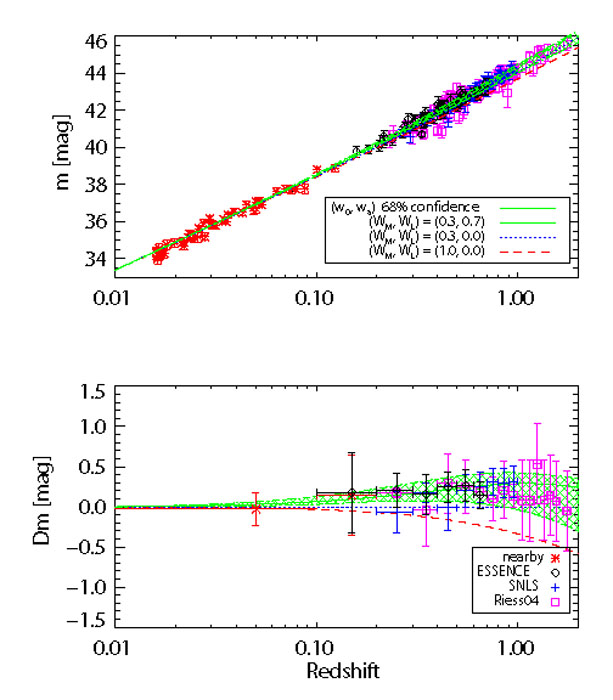 |
Figure 6. SN Ia results: ESSENCE (diamonds),
SNLS (crosses), low-redshift SNe (*), and the compilation of
[Riess et
al. 2004]
which includes many of the other published SN distances plus those from HST
(squares). Upper: distance modulus vs. redshift measurements shown
with three cosmological models:
|
Measurements of the ratio of X-ray emitting gas to total mass in
galaxy clusters, fgas, also indicate the presence of
dark energy. Since galaxy clusters are the largest collapsed objects in
the universe, the gas fraction in them is presumed to be constant and
nearly equal to the baryon fraction in the Universe, fgas
B
/ M (most
of the baryons in clusters reside in the gas). The value of
fgas inferred
from observations depends on the observed X-ray flux and temperature as well
as the distance to the cluster. Only the "correct cosmology" will produce
distances which make the apparent fgas constant in
redshift. Using data from the Chandra X-ray Observatory,
[Allen et al. 2004,
Allen et al. 2007]
determined  to
a 68% precision of about ± 0.2, obtaining a value
consistent with the SN data.
to
a 68% precision of about ± 0.2, obtaining a value
consistent with the SN data.
Finally, because the expansion age of the Universe depends upon the
expansion history, the comparison of this age with
independent age estimates can be used to probe dark energy. The ages of the
oldest stars in globular clusters constrain the age of the Universe: 12
Gyr  t0
15 Gyr
[Krauss & Chaboyer 2003].
When combined with a weak constraint from structure formation or
from dynamical measurements of the matter density, 0.2 <
M <
0.3, a consistent age is
possible if -2
w -0.5; see
Fig. 7. Age consistency is an important
crosscheck and provides additional evidence for the defining feature of dark
energy, large negative pressure. CMB anisotropy is very sensitive to the
expansion age; in combination with large-scale structure
measurements, for a flat Universe it yields the tight constraint
t0 = 13.8 ± 0.2 Gyr
[Tegmark et al. 2006].
t0
15 Gyr
[Krauss & Chaboyer 2003].
When combined with a weak constraint from structure formation or
from dynamical measurements of the matter density, 0.2 <
M <
0.3, a consistent age is
possible if -2
w -0.5; see
Fig. 7. Age consistency is an important
crosscheck and provides additional evidence for the defining feature of dark
energy, large negative pressure. CMB anisotropy is very sensitive to the
expansion age; in combination with large-scale structure
measurements, for a flat Universe it yields the tight constraint
t0 = 13.8 ± 0.2 Gyr
[Tegmark et al. 2006].
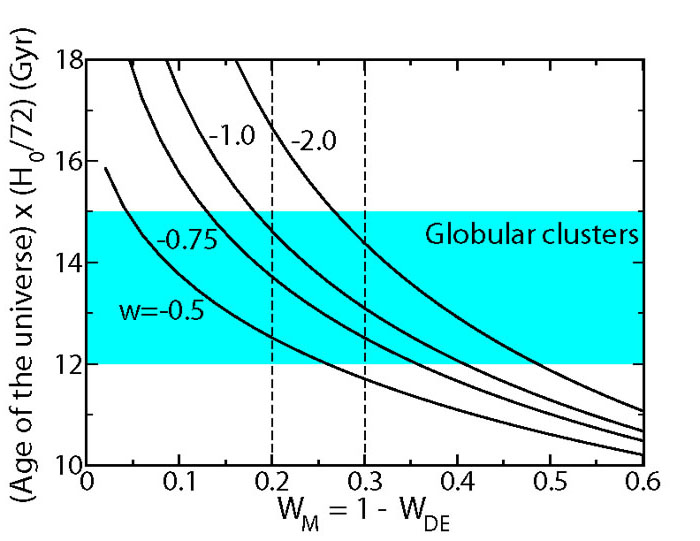 |
Figure 7. Expansion age of a flat universe
vs. |
[Sandage 1970] once described cosmology as the quest for two numbers, H0 and q0, which were just beyond reach. Today's cosmological model is described by anywhere from 4 to 20 parameters, and the quantity and quality of cosmological data described above enables precise constraints to be placed upon all of them. However, the results depend on which set of parameters are chosen to describe the Universe as well as the mix of data used.
For definiteness, we refer to the
"consensus cosmological model" (or
CDM) as one in
which k, H0,
B,
M,
,
t0,
8, and
nS are
free parameters, but dark energy is assumed to be a
cosmological constant, w = -1. For this model,
[Tegmark et al. 2006]
combined data from SDSS and WMAP to derive
the constraints shown in the second column of
Table 1.
| Parameter | Consensus model | Fiducial model |
| 0 |
1.003 ± 0.010 | 1 (fixed) |
| DE |
0.757 ± 0.021 | 0.757 ± 0.020 |
| M |
0.246 ± 0.028 | 0.243 ± 0.020 |
| B |
0.042 ± 0.002 | 0.042 ± 0.002 |
| 8 |
0.747 ± 0.046 | 0.733 ± 0.048 |
| nS | 0.952 ± 0.017 | 0.950 ± 0.016 |
| H0 (km/s/Mpc) | 72 ± 5 | 72 ± 3 |
| T0 (K) | 2.725 ± 0.001 | 2.725 ± 0.001 |
| t0 (Gyr) | 13.9 ± 0.6 | 13.8 ± 0.2 |
| w | -1 (fixed) | -0.94 ± 0.1 |
| q0 | -0.64 ± 0.03 | -0.57 ± 0.1 |
To both illustrate and gauge the sensitivity of the results to the choice of
cosmological parameters, we also consider a "fiducial dark energy
model", in which spatial flatness (k = 0,
0 = 1) is
imposed, and w is assumed to be a
constant that can differ from -1. For this case the cosmological parameter
constraints are given in the third column of Table 1.
Although w is not assumed to be -1 in the fiducial model, the data prefer a value that is consistent with this, w = -0.94 ± 0.1. Likewise, the data prefer spatial flatness in the consensus model in which flatness is not imposed. For the other parameters, the differences are small. Fig. 8 shows how different data sets individually and in combination constrain parameters in these two models; although the mix of data used here differs from that in Table 1 (SNe are included in Fig. 8), the resulting constraints are consistent.
Regarding Sandage's two numbers, Table 1 reflects good agreement with but a smaller uncertainty than the direct H0 measurement based upon the extragalactic distance scale, H0 = 72 ± 8 km/s/Mpc [Freedman et al. 2001]. However, the parameter values in Table 1 are predicated on the correctness of the CDM paradigm for structure formation. The entries for q0 in Table 1 are derived from the other parameters using Eq. (6). Direct determinations of q0 require either ultra-precise distances to objects at low redshift or precise distances to objects at moderate redshift. The former is still beyond reach, while for the latter the H0 / q0 expansion is not valid.
 |
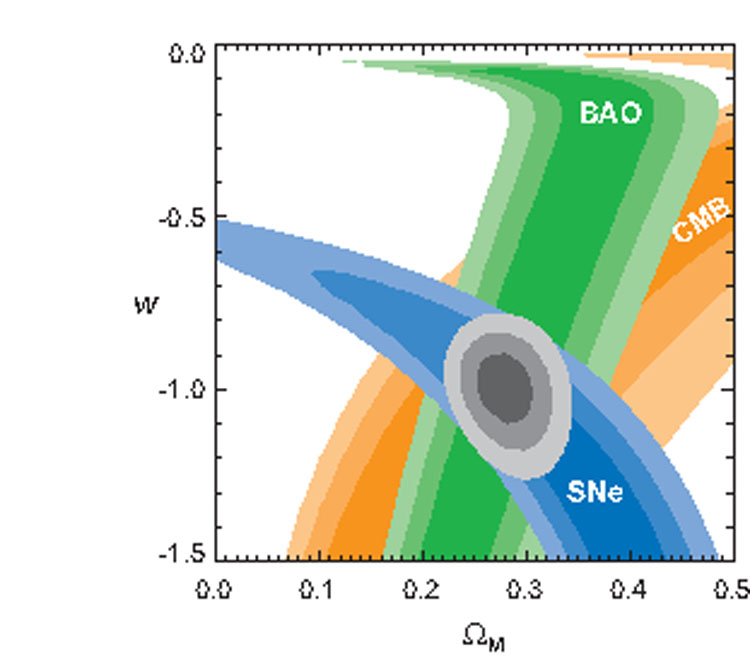 |
Figure 8. Left panel:
Constraints upon
|
|
If we go beyond the restrictive assumptions of these two models,
allowing both curvature and w to be free parameters, then the
parameter values shift
slightly and the errors increase, as expected. In this case,
combining WMAP, SDSS, 2dFGRS, and SN Ia data,
[Spergel et al. 2007]
find w = -1.08 ±
0.12 and 0
= 1.026-0.015+0.016, while WMAP+SDSS only bounds
H0 to the range 61-84 km/s/Mpc at 95% confidence
[Tegmark et
al. 2006],
comparable to the accuracy of the HST Key Project measurement
[Freedman et
al. 2001].
Once we drop the assumption that w = -1, there are no
strong theoretical
reasons for restricting attention to constant w. A widely used and
simple form that accommodates evolution is w =
w0 + (1 - a)wa (see
Section 6). Future surveys with greater
reach than that of present experiments will aim to constrain models in
which M,
DE,
w0, and wa are all free parameters
(see Section 8). We note that
the current observational constraints on such models are quite weak.
Fig. 9 shows the marginalized constraints on
w0 and wa when just three of these
four parameters are allowed to vary, using data from the CMB, SNe, and BAO,
corresponding to w0
-1 ± 0.2,
wa ~ 0 ± 1
[Kowalski et
al. 2008].
While the extant data are fully consistent with
CDM, they do not
exclude
more exotic models of dark energy in which the dark energy density or its
equation-of-state parameter vary with time.
 |
Figure 9. 68.3%, 95.4%, and 99.7% C.L. marginalized constraints on w0 and wa in a flat Universe, using data from SNe, CMB, and BAO. The diagonal line indicates w0 + wa = 0. From [Kowalski et al. 2008]. |