


Spheroidal galaxies include the biggest and the smallest galaxies of the Universe. The investigation of their dark matter component is rather complicated. With respect to spirals, the bulk of stars in ellipticals is much more compact and then it probes much inner and more luminous matter dominated galactic regions than the stellar and HI disks do in spirals. However, the halos of ellipticals are filled with objects, like planetary nebulae and globular clusters that can be good tracers of the gravitational potential, in spite of their limited number and totally unknown dynamical state.
9.1. The fundamental plane in ellipticals
The luminous regions of ellipticals show a 3D relationship, known as the fundamental plane, which is usually written as
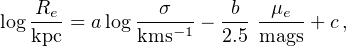 |
(43) |
where Re is the effective radius, σ is the central velocity dispersion (corrected to an aperture of Re / 8). µe and log Ie are the surface brightness and surface luminosity within Re. It is worth to remind that for virialized stable objects, all with the same surface profile I(r / Re) and small amount of dark matter inside Re, one expects: Re = σ0a / Ieb , with a = 2 and b = 1. It is well known that the FP has different parameters (Djorgovski and Davis 1987, Dressler et al. 1987, Jorgensen et al. 1996), e.g., logRe = 1.24 logσ0 − 0.82 log⟨ I ⟩e with scatter 0.07 dex in logRe . As a recent example, Hyde and Bernardi (2009) used a sample of about 50,000 early-type galaxies based on the SDSS-DR4/6, photometric and spectroscopic parameters and obtained a = 1.3 ± 0.05, b = 0.3 ± 0.05 with r.m.s. of 0.1 dex (See Fig. 19).
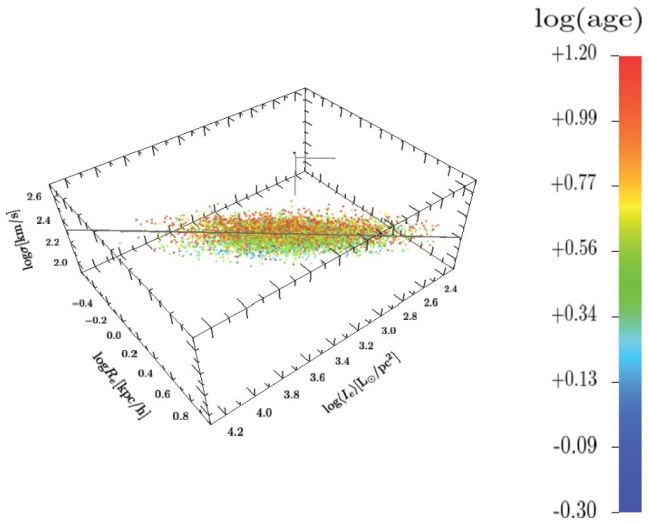 |
Figure 19. The fundamental plane of ellipticals from Hyde and Bernardi (2009) in the coordinate system Ie, Re, σ(1/8 Re). Image reproduced with permission from Magoulas et al. (2012), copyright by the authors. |
Moreover, Magoulas et al. (2012) investigated the near-infrared FP in ∼ 104 early-type galaxies (ETG) included in the 6dF Galaxy Survey (6dFGS). They fitted the distribution of central velocity dispersions, near-infrared surface brightness and half-light radii with a three-dimensional Gaussian model that provided an excellent match to the observed properties.
The resulting FP reads as: Re ∝ σ1.52 ± 0.03Ie−0.89 ± 0.01, with a r.m.s. of 23%. The deviation of the FP with respect to the theoretical predictions, called the tilt of the FP, has been thought to be due a combination of several effects (Bernardi et al. 2003, Bolton et al. 2008, Hyde and Bernardi 2009, Graves and Faber 2010 and Zaritsky 2012 for a review). However, from recent independent and accurate measurements of the total mass inside Re by means of stellar dynamics (Cappellari et al. 2006, Thomas et al. 2011) and strong lensing (Bolton et al. 2007, Auger et al. 2010), it is clear that variations among ETGs of the stellar mass to light ratio M / L are the cause of the tilt. This has clearly emerged in Cappellari et al. (2013): they started with the FP which reads as
 |
(44) |
σe and Re are normalized to the median values found in sample under study. The resulting values of the parameters are: b = 1.25 ± 0.04 ; c = 0.96 ± 0.03 and the r.m.s. scatter is 0.1 dex; when the galaxy luminosity is replaced by the dynamical mass L × (M / L)dyn, obtained by self-consistent JAM modelling (see Sect. 5.5) a smaller r.m.s. it is found and the parameters: b = 1.93 ± 0.03, c = 0.96 ± 0.02 acquire the virial values. This confirms that a major part of the scatter of the FP is actually due to variations in the M / Ls values.
Therefore, the fundamental plane of ETGs expresses the properties of the virialized stellar spheroids and, differently from the Tully–Fisher in spirals, is not directly related to the properties of DM distribution (inside Re). Finally, this result lends support to the idea, valid in spirals, that the dynamically measured mass is more accurate prior of luminous mass of a galaxy than the luminosity itself.
9.2. The dark matter distribution in ellipticals
The derivation of the distribution of dark and luminous mass in ellipticals is far more difficult than in disk systems. The kinematics is more uncertain and the tracers of the gravitational field often do not cover sufficiently well the crucial region between 1/3 Re and 3 Re where the system becomes from stellar dominated to DM dominated.
The main issues under investigation are: a) an universal power law slope of the total density profile: ρtot∝ r−2 and b) large variations of the M⋆/L ratio with mass and other quantities. As regard to the first issue, let us stress that the above density law in ellipticals and the case V(R) = const in spirals are different configurations (see Eq. 19). As regard to the second, at fixed galaxy luminosity, the stellar mass-to-light ratios vary in ellipticals much more than in spirals.
As regard to investigations in early-type galaxies (ETG)s one has to report the several different approaches devised to obtain their mass distribution. However, it is fair to stress that it is difficult to make a synthesis of the results obtained so far, being the situation still in full development.
Data from the Sloan Lens Advanced Camera for Surveys (SLACS) project (Bolton et al. 2006) provided us with the total matter density profiles for a sample of 73 ETGs with strong lenses and large stellar masses (M⋆ > 1011 M⊙ (Auger et al. 2010). For each galaxy the relevant quantities are the Einstein radius Re, its relative enclosed mass, the stellar mass, and σe the velocity dispersions at Re. An isotropic mass model was assumed and they found: (ρtot(r) ∝ r−γ) with ⟨γ⟩ = 2.08 ± 0.03 and with a scatter among galaxies of σγ = 0.16.
Cappellari (2012) determined the total density profile for a sample of 14 ETGs fast-rotators (stellar masses 10.2 < logM∗ / M⊙ < 11.7). SLUGGS and ATLAS observations provided the 2D stellar kinematics out to about to 4 Re, reaching the region dominated by dark matter and poorly investigated before. They built axisymmetric dynamical models based on the Jeans equations solved with a spatially varying anisotropy β and a general density profile for the dark matter halo. The resulting total density profiles were found to be to follow, from Re/10 to 4 Re, the the power law: ρtot(r) ∝ r−γ with ⟨γ⟩ = 2.19 ± 0.03. This extension of the above power law relationship to regions well outside R1/2≃ Re is far than trivial and likely hides a connection between the dark halo and the stellar spheroid.
Tortora et al. (2014) have investigated the central regions ( r < Re) of ETGs by using strong lensing data from SPIDER and kinematics and photometric data from ATLAS3D. The analysis extends the range of galaxy stellar mass (M⋆) probed by gravitational lensing down to ∼ 1010 M⊙. Each galaxy was modeled by two components (dark matter halo + stellar spheroid). The following DM halo profiles were considered: NFW, NFW-contracted, and Burkert. The mass-to-light (M⋆ / L) was normalized to the Chabrier IMF as M⋆ / L = δIMF(M⋆ / L)Chabrier with δIMF a free parameter describing the systematically variations of IMF among galaxies. They found that, generally: 1) δIMF increases with galaxy size and mass. 2) α(Re / 2) = d logM / d log r −3 in the most massive (M⋆ ∼ 1011.5 M⊙) or largest (Re ∼ 15 kpc) ETGs reaches the value of −2, while in low-mass (M⋆ ∼ 1010.2 M⊙) or very small (Re ∼ 0.5 kpc) ETGs decreases to the value of −2.5. As regard to the DM distribution, the result of this work could not reach an explicit preference for a particular profile.
Chae (2014) investigated ∼ 2,000 nearly spherical Sloan Digital Sky Survey (SDSS) ETGs, at a mean redshift of ⟨ z ⟩ = 0.12 and assembled mass models based on their aperture, velocity dispersions, and luminosity profiles measurements. A two-components mass model (i.e., stellar spheroid plus dark halo) successfully fitted, inside R1/2, the SDSS aperture velocity dispersions. As result, they confirmed that, in the region: 0.1 R1/2 < R < R1/2, the total density (dark halo + stellar spheroid) exhibits a power law behavior: ρtot(r) ∝ rγ with ⟨γ⟩ = −2.15 ± 0.04.
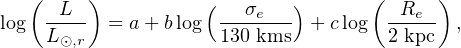
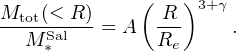
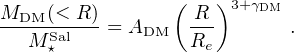
Oguri et al. (2014) investigated 161 strong gravitational lenses from SLACS and BELLS and a number of strongly lensed quasars. They derived the stellar mass M*Sal for each lensing galaxy by fitting the observed spectral energy distribution to a stellar population synthesis model with a Salpeter IMF (Bruzual and Charlot 2003). The measurement in these lens galaxies of the sizes of their Einstein rings Re allowed them to build normalized total mass profiles for each object: Mtot(< Re) / M*Sal and to normalize the projected radius R by the effective luminosity radius Re. Notice that this double-normalization is of the same kind of that performed in the dd galaxies (Karukes and Salucci 2017). They derived, from each Einstein ring, the relative scaled mass profile Mtot(< Re / Re) / M*Sal. These data were fitted by the model
 |
(45) |
They found γ = −2.11 ± 0.05. Furthermore, they decomposed the total mass in its dark and luminous components: a power-law spherical DM dark halo and a Hernquist spheroid for which, with y ≡ R / Re: MHer(y) = Msph y2 / (1.42 + y2)
 |
(46) |
Quasar microlensing measurements break the IMF-stellar mass degeneracy, the DM fraction inside Re results: ADM / A = 0.2 and γDM = −1.60−0.13+0.18 that implies that DM is distributed in a way shallower than the total matter, as it occurs in disk systems, see Fig. 20.
 |
Figure 20. Normalized mass of ETGs as function of its normalized radius. Also shown: the best-fit mass profile solid line and the stellar spheroid and the power law DM halo contributions green and red dotted lines. Image reproduced with permission from Oguri et al. (2014), copyright by the authors. |
Poci et al. (2017) (see also Cappellari et al. 2013), by modelling kinematical and photometric data of 258 early-type galaxies, belonging to the volume-limited ATLAS3D survey, derived their density profiles and found the usual power law: ρtot(r) = rγ with γ = −2.2 ± 0.2. Noticeably, however, they did find significant variations of γ with Σe the surface brightness inside Re and σe, in some contrast with previous works.
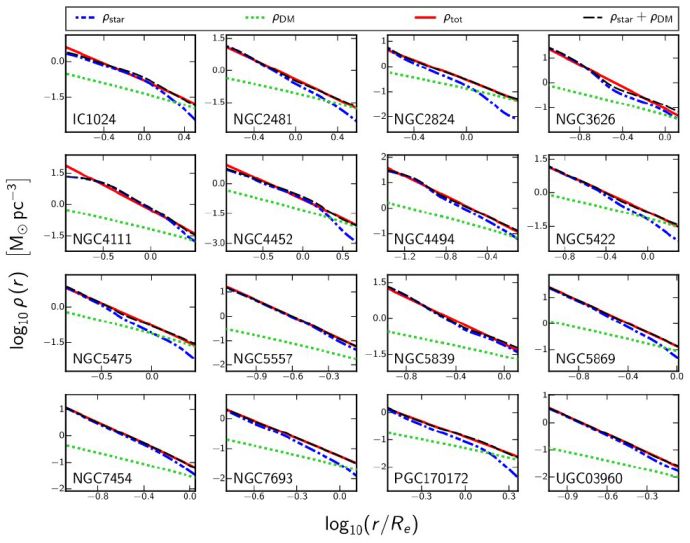 |
Figure 21. The total density profile solid line and its stellar dotted line and DM dot-dashed line components for 16 galaxies from the ATLAS survey. Image reproduced with permission from Poci et al. (2017), copyright by the authors. |
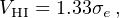
Serra et al. (2016) investigating a sample of 16 fast-rotator ETGs with HI disks extended out to ∼ 6 Re established a tight linear relation between VHI the (flat) circular velocity measured from resolved HI observations in (external) DM dominated regions (i.e., for R ≫ Re) and σe. the velocity dispersion measured at Re, i.e., in a luminous matter dominated region:
 |
(47) |
with an observed scatter of 12 percent. The tightness of the correlation suggests a strong coupling between luminous and dark matter, analogous to the situation in spirals, in LSBs and in dds. Eq. (47) implies a decline in the effective circular velocities V(r) from Re to the outer regions. Such drop is in excellent agreement with the results of Cappellari et al. (2015) and, remarkably, is similar to that observed in early-type spirals (Noordermeer et al. 2007) and in the most luminous late type spirals (Salucci et al. 2007). Assuming ρtot(r) ∝ r−γ, Eq. (47) implies < γ > = 2.18 ± 0.03 across the sample, with a scatter of 0.11 around the average value (see Fig. 22).
 |
Figure 22. Radial profile of the normalized circular velocity for the sample of ellipticals in Serra et al. (2016). Data come from JAM models for R < Re and from HI 21 cm for R > Re. Points and solid lines are coded according to the increasing RHI / Re ratio. |
Alabi et al. (2018) (see also Alabi et al. 2016) used globular cluster kinematics data, primarily from the SLUGGS survey, to measure the dark matter fraction fDM(5 Re) and the average dark matter density ρDM(5 Re within 5 Re for 32 nearby ETGs with stellar mass log (M⋆ / M⊙) ranging from 10.1 to 11.8. They found that fDM(Re) ∼ 0.6 for galaxies with stellar mass lesser than (M⋆ / M⊙) ∼ 1011. At higher masses, a sudden large range of fDM(Re) values emerges. This seems in contradiction with the total density power law ρtot∝ r−2.1 ± 0.1 usually found in other determinations.
Pulsoni et al. (2017) used planetary nebulae (PNe) as tracers of the gravitational field around ellipticals. They obtained two-dimensional velocity and velocity dispersion for 33 ETGs. The velocity fields were reconstructed from the measured PNe velocities. The data extend out from 3 Re to 13 Re. The objects show a kinematic transition between the inner luminous matter dominated regions and the outer halo dominated ones. These transition radii, in units of Re, anti-correlate with stellar mass, differently from what occurs in spirals. The galaxies appear to have more diverse kinematic properties in their halos than in their central regions. It is noticeable the fact that 15% of the galaxies in the sample have steeply falling profiles implying that, inside Re, the fraction of dark matter is very negligible.
One important issue of the ETGs is the comparison between the M / L's inferred from their dynamical or strong lensing modelling and those inferred from the fitting of their spectral energy distributions. Cappellari (2016) have investigated it with a large sample of objects. The values derived, see Fig. 23), indicate the existence of random variations of the IMF and variations with the galaxy dispersion velocity. Noticeably, the existence of a non universal initial mass function (IMF) is already present at intermediate redshift (Tortora et al. 2018).
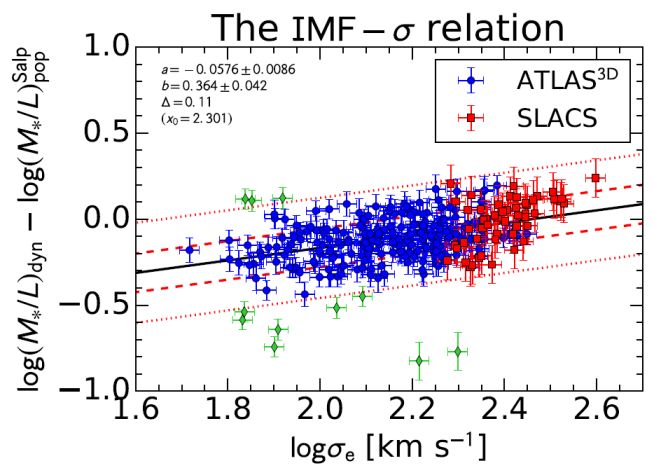 |
Figure 23. The mass discrepancy–σ relation, very likely created by systematical variations of the IMF among ETGs (see Cappellari 2016, Posacki et al. 2015). |
Evidence that ellipticals have variable IMF them come also from their chemical evolution model reproducing the abundance patterns observed in the sample of the Sloan Digital Sky Survey Data Release 4 (De Masi et al. 2018). The model assumes ellipticals form by fast gas accretion, and suffer a strong burst of star formation followed by a galactic wind, which quenches star formation. The model if assumes a fixed initial mass function (IMF) in all galaxies, fail in simultaneously reproducing the observed trends of chemistry with the galactic mass; only a varying IMF among ellipticals, leads to an agreement with data.
Corsini et al. (2017) have investigated NGC 7113, and PGC 67207, two bright ETGs in low-density environments. These rare objects may help us disentangling in ellipticals what is of pertinence of the process of their formation and what is inherent to the properties of their dark matter halos. The surface-brightness distributions and their parameters were derived by Ks-ugriz-band two-dimensional photometric decomposition. The line-of-sight stellar velocity distributions inside Re were measured along several position angles. They assumed the BT-URC DM halo profile (see Eq. 29). The luminous and dark distributions were obtained from the orbit-based axisymmetric dynamical modelling (see Sect. 5.5). The fit model to the data is excellent and implies that these galaxies have a lower content of dark matter with respect to early-type galaxies living in high-density environments. Moreover, it is important to notice that their DM density inside 2 Re is significantly higher than in similar mass spirals (see Fig. 24).
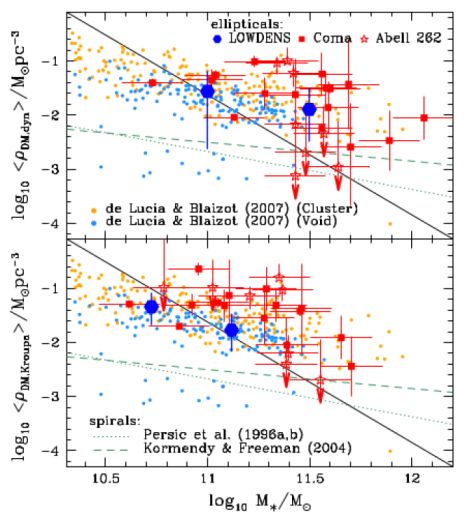 |
Figure 24. The average density inside 2 Re in NGC 7113 and PGC 67207 (blue hexagons as a function of their stellar spheroid mass M⋆ computed a) dynamically (top) or b) from the photometry (bottom). Also shown the values for ETGs in Coma Cluster (red filled) and in Abell 262 (red open). The lines show the corresponding spirals’ relationship. Image reproduced with permission from Corsini et al. (2017), copyright by the authors. |
Dwarf spheroidal (dSph) galaxies are the smallest and least luminous galaxies in the Universe and provide unique hints on the nature of DM. They are old, in dynamical equilibrium and with no HI component. They contain a (small) number of stars, which provide us with tracers of the gravitational field. The very negligible baryonic content that they show does not affect their mass modelling and it also indicates that this component may have never modified the primordial DM distribution (see Walker 2013). Then, by investigating these galaxies, we probe the original structure of the DM halos (see the review of Battaglia et al. 2013).
The stellar component for each dwarf spheroidal galaxy is modeled by means of a Plummer density profile with its scale radius Re, see Eq. (12). The main sample includes the eight larger dSphs of the Milky Way: Carina, Draco, Fornax, Leo I, Leo II, Sculptor, Sextans, and Ursa Minor. The determination of the DM mass profile M(r) requires the velocity dispersion profile along the line-of-sight σ l.o.s.(r) (see Fig. 25). The very limited number of these galaxies combined with the large range in the values of their physical quantities make the stacked analysis approach impossible for investigating the dSphs mass distribution. There are three common methods that use available observations to infer the DM density profile in dSphs.
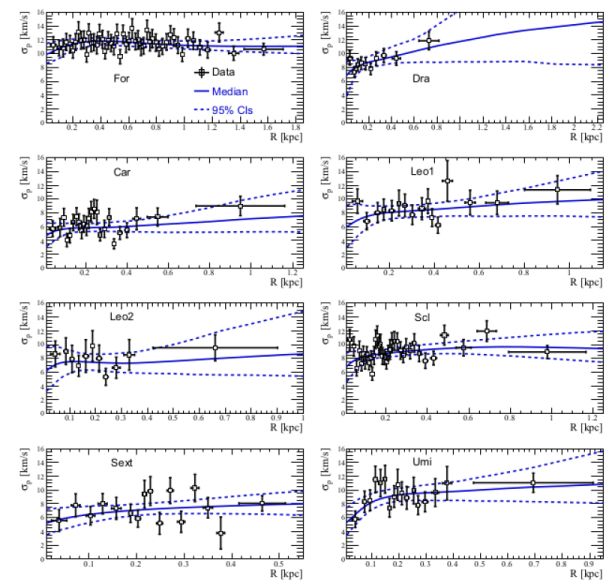 |
Figure 25. Line-of-sight dispersion velocities of the “classical” dSphs. A large r.m.s. is evident. Image reproduced with permission from Bonnivard et al. (2015), copyright by the authors. |
Jeans analysis: In this approach one feeds Eq. (18) with the values of ν⋆(R), the stellar density profile, uses a large number of well determined dispersion velocities σl.o.s.(r) (Walker et al. 2009a) and assumes a particular anisotropy profile (e.g., as in Bonnivard et al. 2015). Then, through a Monte Carlo analysis, one obtains the free parameters of the DM density profile ρ(r) and the anisotropy function β. There are views that this investigation, also when the tangential velocity dispersions are available, cannot resolve in these objects the cusp/core issue (Walker et al. 2009b, Strigari et al. 2008, Bonnivard et al. 2015, Strigari et al. 2018). The degeneracy in the Jeans equation between the mass and the anisotropy profiles, combined with a kinematics of limited extension and quality, makes difficult to determine the density profile by means of this method.
Slope method: Walker and Penarrubia (2011) first exploited the fact that in some dSphs there are multiple stellar populations, photometrically and chemo-dynamically distinct sub-components. They independently trace the (same) gravitational potential. Since M(Re), the mass contained within the effective radius Re of each component, can be measured independently of their stellar orbital anisotropies, see Eq. (20) then, we can derive the quantity d logM / d logR at different radii without adopting a DM halo profile. The method, applied to the dSph Fornax and Sculptor, for which two separate stellar sub-components have been disentangled, gives ΔlogM / Δlogr = 2.61−0.37+0.43 and 2.95−0.39+0.51, respectively, pointing to DM densities that keep an almost constant value within the central few-hundred parsecs of these objects. With the same method, Breddels et al. (2013) found that a NFW profile is only marginally allowed in Sculptor.
This method has been carefully investigated by Strigari et al. (2018) in view of determining the level of its intrinsic bias, see Fig. 26 and finding improvements.
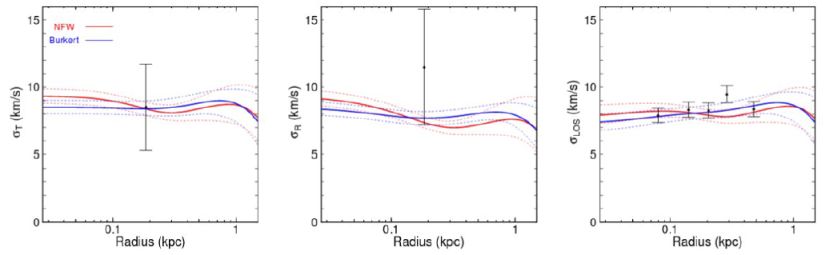 |
Figure 26. Observed versus predicted dispersion velocities form different halo density profiles. Image reproduced with permission from Strigari et al. (2018), copyright by AAS. |
Schwarzschild modelling: A promising method, based on distribution functions that depends on the action integrals, has been put forward by Pascale et al. (2018). This was applied to the Fornax galaxy, finding strong evidence for the presence of a cored density profile.