


The term "rotation curve," as applied to spiral galaxies, refers to that function V(r) that describes the tangential velocity in the plane of the rotating disk, in terms of the distance r from. the galactic center. Most of the observational work on rotation curves of disk galaxies has focused on using the interstellar gas as a tracer of the gravitational potential produced by the total content of the galaxy, i.e., stars, gas, dust, radiation and dark matter. Until about ten years ago, the bulk of the rotation curve data was derived from optical observations of the narrow lines emitted by HII regions; such lines are easily detected in star-forming regions of disks. Bright HII regions, however, while relatively conspicuous in the inner parts of disks, become rare in the outer regions. HI gas, on the other hand, typically extends with detectable column densities beyond the outer boundary of the HII region distribution, so that velocity measurements from HI maps provide the rotation curve and, by inference, the mass in the outer parts of spiral galaxies. Luminous galaxian material fades exponentially with radial distance, and until the early 1970s, it appeared reasonable to expect that the luminous matter was a good tracer of the total mass. Therefore, rotation velocities were expected to start falling in the periphery of luminous disks, as a result of the corresponding decline in mass density. If the mass of a galaxy were strongly concentrated, one would in fact expect the rotation curve to approach asymptotically a Keplerian r-1/2 decrease. Seminal work on the stability of disks, which invoked the presence of massive, dark halos, and early single-dish 21-cm measurement of large nearby galaxies indicated the fallacy of such an expectation.
Many rotation curves have now been measured well outside the optical disk. Perhaps the most interesting characteristic of the HI rotation curves is that the rotational velocity does not fall even at large distances from the center, as can be appreciated in Figure 12.6, showing several examples obtained by aperture synthesis observations. In practice, both optical and HI line measures are used in studying rotation curves. Optical spectra outline the rotation in the bright inner disk while the velocity field in the outer portion is derived from 21-cm mapping.
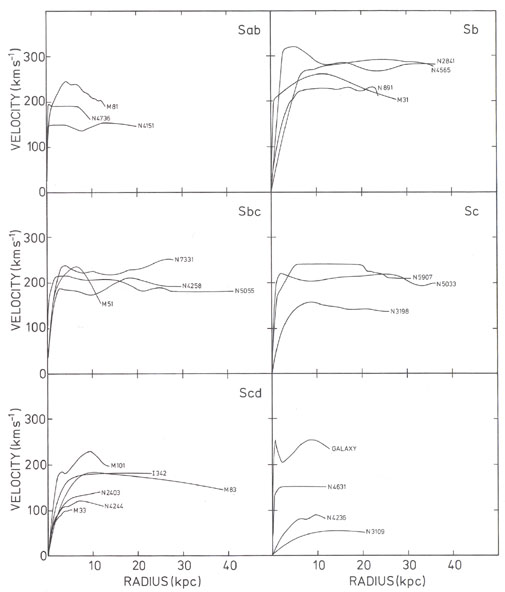 |
Figure 12.6. Selection of rotation curves of spiral galaxies, assembled by Bosma (1981). (Reprinted with permission from The Astronomical Journal). |
Given the rotation curve V(r), simple balance of gravitational and centrifugal force in spherical symmetry gives for the total mass MT(r) contained within r
 |
(12.4) |
with V(r) in km s-1 and r in kpc. [If the assumption of spherical symmetry for MT(r) is relaxed, the constant in Equation (12.4) diminishes slightly.] A rotation curve which becomes flat in the outer regions implies a linearly rising MT(r) and a mean density that decreases as r-2; since the luminous matter decreases exponentially, the ratio of dynamical to luminous mass grows with r. In general, rotation curves of spiral disks remain flat, or perhaps rise very mildly as r+0.1 at large radii. The maximum rotational velocity reached within a disk, Vmax, is a function of both luminosity and morphological type. For a given type, higher peak rotation velocities - as derived from long-integration optical measurements - are attained by brighter systems. At a fixed luminosity, earlier spirals are faster rotators than late ones. (The largest rotational velocity observed thus far in a disk is about 500 km s-1 in the S0a galaxy UGC 12591.)
The correlation between luminosity and Vmax is of the form
 |
(12.5) |
with n close to 4. In Section 12.4, we discuss the use of HI profile velocity widths in applying Equation (12.5) to estimate luminosities, and hence redshift-independent distances. Equation (12.5) can be derived from simple empirical and scaling relations, as shown by Aaronson et al. (1979). In addition, Faber (1982) finds that Equation (12.5) provides insight into a question of cosmological importance. Her reasoning is that as the rotational velocity at large radii is a dynamical manifestation of the total mass (which, to a large extent, is composed of spheroidally distributed, mostly nonluminous matter), it should be related to total mass in the form
 |
(12.6) |
where m is an integer whose value is determined by the exponent of the power law spectrum of primordial density perturbations. The relation in Equation (12.6) applies to hierarchically clustered, dissipationless structures, such as any spheroidal mass distribution. Assuming that a constant mass-to-luminosity ratio holds, at least for galaxies of a given morphological type, the empirical relation in Equation (12.1) with n = 4 determines the exponent of the power spectrum in Equation (12.6). One obtains a value for m of -2, which agrees with other independent estimates of m that set m = - 1 as an upper limit. This result implies that the power spectrum of primordial density fluctuations is highly skewed towards large fluctuations relative to what one would expect for uncorrelated perturbations ("white noise"). Note that if m were independently well known, Equation (12.5) could be inferred from Equation (12.6).
In the inner regions, rotation curves rise steeply; the scale length of that rise is inversely correlated with Vmax, and consequently with the luminosity of the galaxy. The rise appears nearly linear, which is consistent with what one would expect, for example, for a rotating rigid body or homogeneous spheroid. In order to obtain detailed descriptions of V(r), clearly both high spectral and angular resolution are necessary, especially in the inner regions, where V(r) may have steep gradients. Often, however, there is little or no detectable HI in the inner regions-especially in early-type disks - which makes the measurement of V(r) arduous. The combination of optical and radio techniques provides, in the majority of cases, the best means of carefully determining V(r) throughout the disk. Good quality rotation curves are known for several dozen systems. Single-dish profiles of the type shown in Figure 12.1(f) are much easier to obtain and thus more common; from them it is possible to extract a value of Vmax, which can then provide an indication of the total mass contained within the region observed in the HI line. Unless the galaxy is mapped, the exact extent of this region is unknown and the estimate relies on statistical considerations.