


This section discusses the selection of dusty star-forming galaxies at far-infrared and submillimeter wavelengths. Given past and current survey detection limits, these galaxies are typically prolific star formers that exhibit infrared-based star formation rates as much as a few orders of magnitude above a normal L⋆ galaxy. Although they sometimes only represent the tip of the iceberg in terms of galaxy mass halos and star formation rates, they shed light on how galaxy formation processes in the early Universe might differ from the Universe today. The detection and selection of these sources is the first step to studying them.
2.1. Local Infrared-Luminous Galaxies
Any discussion of the high-redshift infrared-bright galaxy population requires a brief overview of the local Luminous InfraRed Galaxy (LIRG; LIR > 1011 L⊙ ) population, even though it's not clear whether or not high-z DSFGs closely relate or not. The InfraRed Astronomy Satellite (IRAS; Neugebauer et al., 1984) was responsible for the discovery of these extremely bright extragalactic sources during its short lifetime in 1983. While close to 250,000 extragalactic sources were logged by IRAS over the entire sky, the subset of 'bright galaxies' became the most well-studied infrared sources (629 of which make up the 'Revised Bright Galaxy Sample,' or RBGS; Sanders et al., 2003). Further populations of local infrared-bright galaxies were discovered by ISOPHOT aboard the ISO satellite in the mid-1990s (Lemke et al. 1996). The majority of local IRAS-selected and ISO-selected galaxies were infrared galaxies with infrared luminosities within 1011 < LIR < 1012 L⊙ , though a small subset (~ 12 galaxies) were ultraluminous infrared galaxies, or ULIRGs, with 1012 < LIR < 1013 L⊙ . Careful analysis of these galaxies, from studying their morphological structure in the optical, near-infrared, molecular gas and dust emission, indicated that the majority of systems above ~ 1011.5 L⊙ - or above star formation rates ~ 50 M⊙ yr-1 - were major mergers of two or more equal-mass galaxies (de Jong et al. 1984, Soifer et al. 1984, Lonsdale et al. 1984, Joseph & Wright 1985, Veilleux et al. 2002, for a review, see Sanders & Mirabel, 1996).
The observation that high infrared luminosity correlated with high star formation rates and major mergers led to the widely accepted evolutionary picture for extreme luminosity systems first proposed by Sanders et al. (1988). A schematic diagram of this evolutionary picture is shown in Figure 2, here reproduced from Hopkins et al. (2008). This formulation places the LIRG or ULIRG phenomenon at a fixed stage in a larger evolutionary sequence whereby two gas-rich disk galaxies collide and ignite an intense phase of star formation by the rapid compression and cooling of gas. This collision and subsequent star formation triggers the prolific formation of dust particles which, in turn, absorb rest-frame optical and ultraviolet emission from young, blue stars and re-radiates that light at infrared/submillimeter wavelengths during the (U)LIRG phase. At the moment when the two galaxy cores and supermassive black holes (SMBHs) merge during final coalescence, an active galactic nucleus (AGN) is formed and is fed by an accretion disk of material, further fueled by the infall from the outer realms of the galaxy merger (Hopkins et al., 2012b, a). The (U)LIRG phase is proposed to be short-lived due to limited gas supply and high star formation rates, and the possible feedback winds generated from the AGN. The resulting galaxy might shine brightly after the ULIRG phase as an obscured or unobscured AGN (or quasar), but eventually, the system lacks gas to form new stars. The galaxy could then be categorized as an 'elliptical galaxy' as it approaches a virialized state from the merger and is characterized by an old stellar population. Significant theoretical progress toward this picture has been made by Hopkins et al. (2005a, b, 2006), Kim et al. (2009), Younger et al. (2009a), Teyssier et al. (2010), Hayward et al. (2013c) and others.
 |
Figure 2. A schematic diagram of the evolution of a galaxy undergoing a major merger of gas-rich disks during its lifetime. This figure is reproduced from Hopkins et al. (2008) with permission from the authors and AAS. Image credits: (a) NOAO/AURA/NSF; (b) REU program/NOAO/AURA/NSF; (c) NASA/STScI/ACS Science Team; (d) Optical (left): NASA/STScI/R. P. van der Marel & J. Gerssen; X-ray (right): NASA/CXC/MPE/S. Komossa et al.; (e) Left: J. Bahcall/M. Disney/NASA; Right: Gemini Observatory/NSF/University of Hawaii Institute for Astronomy; (f) J. Bahcall/M. Disney/NASA; (g) F. Schweizer (CIW/DTM); (h) NOAO/AURA/NSF. |
While this merger-driven picture of local infrared galaxies seems quite elegant and meaningful, particularly to the formation of the most massive elliptical galaxies in the Universe, local infrared galaxies are very rare relative to 'normal' Milky Way type galaxies and are not thought to contribute substantially to the z = 0 cosmic star formation rate density. If high-z (U)LIRGs are more common than local (U)LIRGs, does this imply that major mergers dominate cosmic star formation at early times? Or could they be dominated by a different physical evolutionary sequence not yet known? As the wealth of information on high-z infrared galaxies mounts, we are inching closer to answers, but it is critical to recognize that our current high-z studies would be lost without the large body of fundamental work done on local (U)LIRG samples in the decades leading up to the submillimeter galaxy (SMG) era.
2.2. The very negative K-correction
Before the advent of the Submillimeter Common User Bolometric Array (Scuba) in 1997 3, the first of several high-sensitivity submillimeter arrays, the number of distant (z ≳ 0.3) infrared-luminous galaxies known amounted to only a handful. This included the spectacularly luminous IRAS F10214+4724 with apparent LIR = 3 × 10¹⁴ L⊙ at z = 2.3 (Rowan-Robinson et al., 1991) and APM 08279+5255 with LIR = 5 × 10¹⁵ L⊙ at z = 3.9 (Irwin et al. 1998), both gravitationally lensed by factors ≳ 10. They were both so unique and rare that little was known about the population of unlensed dusty galaxies to which they might relate. With submillimeter sensitivities an order of magnitude improved over previous generations of instruments, Scuba ushered in a new era of discovery in the high-z Universe by revealing the unlensed high-z infrared-luminous galaxy population.
Tens to hundreds of luminous sources were detected with Scuba in the first deep-field maps (e.g. Smail et al., 1997, Hughes et al., 1998, Barger et al., 1998), although their properties were hard to study (Ivison et al., 1998) due to the large beamsize of Scuba's observations (~ 15′′ at 850 µm; at cosmological redshifts, roughly 120 kpc) and the difficulty in identifying multi-wavelength counterparts. However, at the time it was already thought that these submillimeter sources would be predominantly located at high-redshift. This is because submillimeter observations of extragalactic sources, particularly those conducted at ~ 1 mm, benefit from a special trait relating to having a negative K-correction.
A K-correction is applied to a redshifted object's absolute magnitude (or its flux) to convert from observed-frame to rest-frame. The K-correction depends only on the inferred shape of the galaxy's spectral energy distribution, and is independent of the correction between apparent and absolute magnitudes. The K-correction is typically called 'positive' if the flux density decreases with increasing redshift and 'negative' if it increases with redshift (this terminology was built around magnitudes, hence the reversal of positive and negative).
Galaxies' submillimeter emission has a negative K-correction 4. This is because dust emission in ULIRGs resembles a modified blackbody which peaks at rest-frame wavelengths ~ 100 µm, and the long-wavelength portion of the spectrum is the Rayleigh-Jeans regime where Sν∝ ν2+β, where Sν is the measured flux density (given in units ∝ Jy) and β is the dust emissivity spectral index, discussed more in § 5. Beyond ~ 3 mm, galaxies' emission is no longer dominated by dust emission, but by a mix of synchrotron and free-free emission, where the K-correction is positive.
However, it is not the negative K-correction alone which makes extragalactic submillimeter observing special. It's the fact that submillimeter observations have a very negative K-correction such that high-z galaxies have roughly constant brightness at submillimeter wavelengths from z = 1 - 8. If a galaxy of fixed luminosity L is pushed back in redshift, the observed flux density at a given frequency ν diminishes as the luminosity distance increases approximately ∝ (1 + z)4 (since Sν = Lν / 4πDL2 and DL can be approximated as DL∝ (1 + z)2 at 0.5 < z < 3). The SED also shifts towards shorter rest-frame wavelengths. In the Rayleigh-Jeans regime, the flux density will behave 5 like Sν(z) ∝ ν2+β / 4π DL2 ∝ νrest2+β(1 + z)2+β / (1 + z)4 ∝ (1 + z)β - 2. Later we will verify that β = 1.5 - 2.0 is a reasonable assumption for dusty galaxies, which then leads us to Sν(z) is roughly constant. In other words, across the wide range of redshifts for which the Rayleigh-Jeans approximation is applicable (z ≈ 1 - 8 for 850 µm observations), the observed flux density is roughly constant or might even increase slightly. This is what makes the K-correction in the submillimeter very negative.
Figure 3 makes it clear that the submillimeter regime is unique in making the high-redshift Universe readily accessible. This figure highlights the expected change in observed flux density with redshift for a template DSFG SED of fixed luminosity (Pope et al., 2008b) across many observed-frame wavelengths, from the optical (i-band, 0.8 µm) through the near-IR, mid-IR, far-IR, millimeter, and the radio (1.4 GHz). The K-correction at 250 < λ < 500 µm is still negative, though is far less dramatic than the very negative K-correction at ~ 1 mm and the very positive K-correction at optical/near-infrared and radio wavelengths which causes a dramatic drop in redshift flux density. Promisingly, the negative K-correction at 850 µm-2 mm implies that higher redshift galaxies will actually be easier to detect than their low-redshift counterparts, making the motivation for the original 850 µm Scuba surveys quite clear.
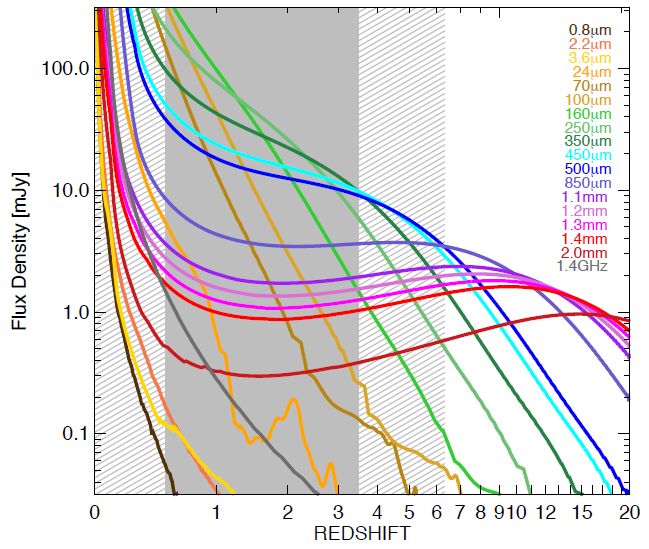 |
Figure 3. The observed flux densities for a typical 1012.5 L⊙ infrared-luminous galaxy as a function of redshift. This illustrates the nearly-unchanged flux densities which DSFGs have in the ~ 1 mm bands across a wide range of epochs 1.5 ≲ z.5 ≲ 10. The Pope et al. (2008b) composite SMG SED is used to generate the flux evolution, or K - correction, at wavelengths 24 µm-2 mm, and at 1.4 GHz. An Arp 220 SED, adjusted to have a luminosity of 1012.5 L⊙, is used to generate optical and near-IR K - corrections. The peak epoch of DSFG discovery is highlighted in solid gray, from 0.5 < z < 3.5, where redshift follow-up and characterization has been efficient, particularly for 850 µm-selected SMGs. The shaded areas, at 0 < z < 0.5 and 3.5 < z < 6.4 highlight redshift space where log(LIR) ≈ 12.5 galaxies are perceived to be rare. At 0 < z < 0.5 this is because they have a very low volume density, attributable to cosmic downsizing (Cowie et al., 1996), whereas at high-redshift (3.5 < z < 6.4) it is unknown whether or not the volume density of DSFGs is much lower since galaxies are much more difficult to spectroscopically confirm. At present, no purely star-forming DSFG at redshifts above z ≈ 6.4 has been discovered. |
2.3. Dusty Galaxy Selection from ~ 8-2000 µm
Infrared galaxy selection has largely been limited by the opacity of the Earth's atmosphere or, alternatively, the limited instrumentation which we are able to send to space. Beyond the local samples discovered by IRASand ISO, high-redshift far infrared galaxy searches have primarily focused on the 345 GHz and 230 GHz transmission 'windows' with recent expansions to other wavelengths due to instrumental improvements. The atmosphere's transmission at different infrared-to-radio wavelengths is shown in Figure 4 under two different water column densities, illustrating all of the naturally occurring submm and mm atmospheric windows.
 |
Figure 4. The atmospheric transmission as seen from Mauna Kea, Hawai'i under two weather conditions with precipitable water vapor (PWV) levels of 0.5mm and 2.0mm. The PWV is the amount of water vapor in the atmosphere integrated from the top of the atmosphere down to the telescope. In the submillimeter regime (λ<1 mm) the atmosphere is very opaque, even under the driest weather conditions. Some natural atmospheric windows occur at 350 µm (860 GHz), 450 µm (670 GHz), 770 µm (390 GHz), 870 µm (345 GHz), 1.2 mm (250 GHz) and 2 mm (150 GHz). An optical depth of τ ≤ 0.10 only occurs ~ 10% of nights on Mauna Kea, and the truly exceptional τ ≤ 0.03 conditions are extremely rare, only happening a few days out of the year. Note that a few more bands occur ~ 200 µm but require even drier conditions to observe from the ground. |
Understanding the atmospheric windows and the initial limitations of infrared bolometer array technology is critical to understanding the selection of the first high-z dusty starbursts. Below, in § 2.3.1, we describe the facilities used to discover distant infrared galaxy populations; the order is roughly chronological, as the populations were first observed and described. Table 1 lists some basic properties of the facilities in the same chronological order.
| Instrument | Telescope | Years | Beam- | Wave- | Deepest | Instrument |
| Active | size | bands | Sensitivity | Reference | ||
| IRAS | IRAS | 1983 | 0.5′† | 12 µm | 0.4 Jy | Neugebauer et al. (1984) |
| 0.5′† | 25 µm | 0.5 Jy | ||||
| 1.0′† | 60 µm | 0.6 Jy | ||||
| 2.0′† | 100 µm | 1.0 Jy | ||||
| ISOPHOT | ISO | 1995-1998 | 7′′ | 15 µm | 14 mJy | Lemke et al. (1996) |
| 11′′ | 25 µm | 90 mJy | ||||
| 44′′ | 100 µm | 250 mJy | ||||
| 79′′ | 180 µm | 800 mJy | ||||
| Scuba | JCMT | 1997-2005 | 15′′ | 850 µm | 1 mJy | Holland et al. (1999) |
| 7′′ | 450 µm | 30 mJy | ||||
| Mambo-1 | IRAM 30 m | 1998-2002 | 11′′ | 1.2 mm | 0.8 mJy | Kreysa et al. (1999) |
| Mambo-2 | IRAM 30 m | 2002-2011 | 11′′ | 1.2 mm | 0.8 mJy | |
| Sharc-II | CSO | 2002-2013 | 9′′ | 350 µm | 5 mJy | Dowell et al. (2003) |
| Bolocam | CSO | 2002-2013 | 30′′ | 1.1 mm | 1.9 mJy | Laurent et al. (2005) |
| MIPS | Spitzer | 2003-2009 | 6′′ | 24 µm | 7µJy | Rieke et al. (2004) |
| 17′′ | 70 µm | 0.8 mJy | ||||
| 38′′ | 160 µm | 9.4 mJy | ||||
| FIS | AKARI | 2006-2011 | 26′′ | 65 µm | 9.2 mJy | Murakami et al. (2007) |
| 36′′ | 90 µm | 3 mJy | ||||
| 56′′ | 140 µm | 36 mJy | ||||
| 64′′ | 160 µm | 120 mJy | ||||
| BLAST | BLAST | 2008 | 33′′ | 250 µm | 18 mJy | Devlin et al. (2009) |
| 46′′ | 350 µm | 13 mJy | ||||
| 66′′ | 500 µm | 12 mJy | ||||
| Spire | Herschel | 2009-2013 | 18′′ | 250 µm | 5.8 mJy | Griffin et al. (2010) |
| 26′′ | 350 µm | 6.3 mJy | ||||
| 36′′ | 500 µm | 6.8 mJy | ||||
| Pacs | Herschel | 2009-2013 | 12′′ | 160 µm | 0.9 mJy | Poglitsch et al. (2010) |
| 7′′ | 100 µm | 0.4 mJy | ||||
| 5′′ | 70 µm | 0.4 mJy | ||||
| WISE | WISE | 2009-2011 | 7′′ | 12 µm | 0.2 mJy | Wright et al. (2010) |
| 12′′ | 22 µm | 1.2 mJy | ||||
| AzTEC | JCMT | 2005-2006 | 19′′ | 1.1 mm | 1.5 mJy | Wilson et al. (2008) |
| ASTE | 2007-2008 | 29′′ | 1.1 mm | 1.2 mJy | ||
| LMT (32m) | 2011-2015 | 9′′ | 1.1 mm | ... | ||
| LMT (50m) | 2015- | 6′′ | 1.1 mm | ... | ||
| Laboca | APEX | 2006- | 19′′ | 870 µm | 1.2 mJy | Siringo et al. (2009) |
| ACT | ACT | 2007- | 54′′ | 1.1 mm | 6.0 mJy | Swetz et al. (2011) |
| 69′′ | 1.4 mm | 3.7 mJy | ||||
| 98′′ | 2.0 mm | 2.3 mJy | ||||
| SPT | SPT | 2008- | 69′′ | 2.0 mm | 1.3 mJy | Mocanu et al. (2013); |
| 63′′ | 1.4 mm | 3.4 mJy | Vieira et al. (2010) | |||
| Saboca | APEX | 2009- | 8′′ | 350 µm | 30 mJy | Siringo et al. (2010) |
| GISMO | IRAM 30m | 2011- | 24′′ | 2.0 mm | 0.1 mJy | Staguhn et al. (2012) |
| Scuba-2 | JCMT | 2011- | 15′′ | 850 µm | 0.7 mJy | Holland et al. (2013) |
| 7′′ | 450 µm | 1.7 mJy | ||||
| † The IRAS detector's pixels were much larger than the beamsize. | ||||||
While reviewing the facilities by which high-z DSFGs were discovered, the reader should keep in mind the underlying shape of a dusty starburst's spectral energy distribution (SED) and how that behaves with redshift and wavelength, as shown in Figure 3. Figure 5 illustrates a characteristic SED of a z = 2 LIR = 3 × 10¹² L⊙ galaxy (Pope et al., 2008b) in relation to some well known local ULIRGs (Arp 220, Mrk 231, templates provided by Polletta et al., 2007). Over-plotted on this SED are characteristic detection limits for the deepest mid-IR, submillimeter and millimeter facilities available. When reviewing the respective facilities, it is important to keep in mind the impact of the selection wavelength on the various DSFG populations.
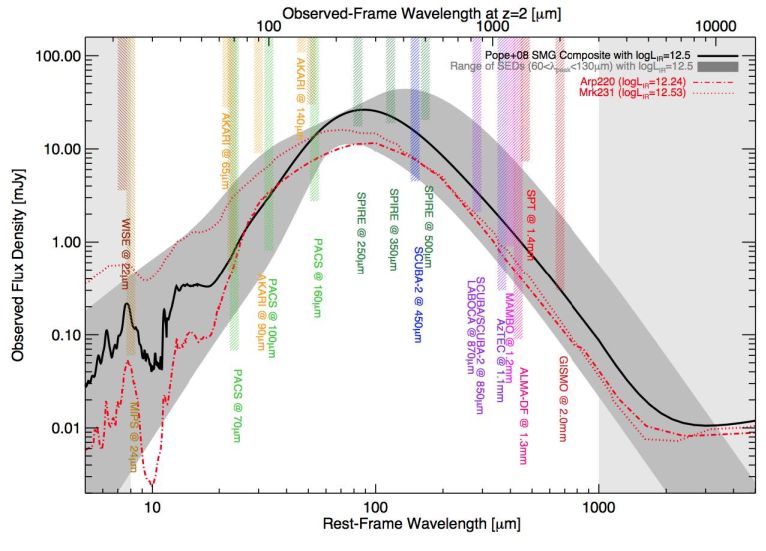 |
Figure 5. A schematic spectral energy distribution for a dusty star forming galaxy at z = 2. A representative SED for a ~ 500 M⊙ yr-1 SMG (black; Pope et al., 2008b) is overplotted on a gray band representing the plausible range of SED types for a galaxy of fixed infrared luminosity 1012.5 L⊙ with peak SED wavelengths ranging from 70-130 µm (corresponding to temperatures ~ 30-58K). Model SEDs for local galaxies Arp 220 and Mrk 231 are also overplotted in red dot-dashed and dotted lines. Vertical shaded bands represent the sensitivities of different far-infrared observatories; the minimum flux density value of each colored band represents the 3σ detection limit for the given instrument. From short wavelengths to long, we include WISE at 22 µm, MIPS at 24 µm, 70 µm, and 160 µm, AKARI at 65 µm, 90 µm, and 140 µm, Pacs at 70 µm, 100 µm, and 160 µm, Spire at 250 µm, 350 µm, 500 µm, Scuba-2 at 450 µm and 850 µm, Scuba at 850 µm and Laboca at 870 µm, AzTEC at 1.1mm, Mambo at 1.2mm, the ALMA Deep Field pointing at 1.3mm, the South Pole Telescope at 1.4mm, and GISMO at 2.0mm. References given in the text and Table 1. |
2.3.1. Facilities and Instruments Discovering high-z DSFGs
Submillimeter Common User Bolometric Array [Scuba], (1997-2005)
Scuba was commissioned on the James Clerk Maxwell Telescope (JCMT) atop Mauna Kea in Hawai'i in 1997 and operated simultaneously at 450 µm and 850 µm (in the 670 GHz and 345 GHz atmospheric windows). Although Scuba was not the first bolometer-array in use, it had unrivaled sensitivity at the time with a fairly substantial field of view (~ 5 arcmin2). While the 450 µm sensitivity was significantly worse than the 850 µm sensitivity (σ450 ≈ 30 × σ850), so not as constraining, the 850 µm arrays could reach ~ 2 mJy sensitivity with 6 hours of integration, easily detecting 1012.5 L⊙ galaxies out to z ≈ 8. The first few submillimeter deep-field maps which were published (e.g. Smail et al., 1997, Barger et al., 1998, Hughes et al., 1998) detected several galaxies at 850 µm within several square arcminutes. A was soon shown (e.g. Ivison et al., 1998), these galaxies sit predominantly at high-z (due to the anticipated benefit of the negative K-correction), the detection of these galaxies was enough to confirm that there had to be strong evolution in the cosmic star formation rate density, or infrared luminosity density, out to high-z. Put another way, if the density of (U)LIRGs at z ~ 1 - 2 mirrored the local density, then the limited volumes probed by the original Scuba surveys would not have been large enough to detect a single source.
While the detection of Scuba galaxies provided an exciting confirmation of an evolving Universe, follow-up on individual galaxies was arduous given the large 15′′ beamsize. At first, attempts to use deep optical data provided lengthy lists of multiple candidate counterparts for every submillimeter source (Smail et al., 1998). Although efforts to follow-up these galaxies with spectroscopy were able to obtain redshifts (Barger et al., 1999), it remained uncertain whether or not these redshifts corresponded directly to the source of submillimeter emission. Later, the realization that these submillimeter sources should also be faint µJy radio galaxies (Ivison et al., 1998, 2000, Smail et al., 2000) by virtue of the FIR/radio correlation seen in local starburst galaxies (see § 5.12), lead to a breakthrough in SMG counterpart identification. Deep µJy radio data were obtained with the Very Large Array (VLA) at 1.4 GHz (e.g. Ivison et al., 2002) at substantially higher resolution (~ 1′′) than the submillimeter maps. Since radio sources are far more rare on the sky than optical sources, and there would typically only be one radio galaxy within the searchable beamsize of Scuba, the precise positions of single µJy radio sources provided the missing link necessary to characterize SMGs. The process of SMGs' redshift follow-up and characterization is discussed again in more detail in § 4.
The results of the redshift follow-up effort on 850 µm SMGs revealed a population that, indeed, sat at high redshifts. The median radio-identified SMG had a redshift of z ≈ 2.2 (Chapman et al., 2004a, 2005) with far-infrared luminosities > 1012.5 L⊙ and star formation rates > 500 M⊙ yr-1 . By 2006, about 75 SMGs had confirmed spectroscopic redshifts (Swinbank et al., 2004, Chapman et al., 2005) and many were being followed up at other wavelengths to understand their comprehensive energy budget and evolutionary mechanisms. We describe the follow-up physical characterization of Scuba-selected SMGs more in § 5. We highly recommend the Blain et al. (2002) review for a thorough summary of SMG science in the earlier days of Scuba. Scuba was decommissioned in 2005 to make way for the second generation instrument for the JCMT, Scuba-2.
MAx-planck Millimeter BOlometer [Mambo], (2002-2011)
Mambo represents a family of bolometer arrays designed and built at the Max-Planck-Institut für Radioastronomie and installed on the Institut de Radioastronomie Millimétrique (IRAM) 30 m Telescope at Pico Veleta in southern Spain (Kreysa et al., 1999). After a few prototypes, the first generation of Mambo (known as “Mambo-1”) was a 37 channel array used from 1998-2002 until the development of a second generation 117 channel array (“Mambo-2”) installed on the 30 m in early 2002. The latter was far more sensitive and enabled the deep mapping of blank fields over ~ 4 arcmin2 similar to Scuba.
Some of the deeper Mambo blank-field pointings cover ~ 150 arcmin2 both in the Elais-N2 and Lockman Hole North fields to 0.8 mJy RMS (Greve et al., 2004), 400 arcmin2 to 1 mJy RMS in COSMOS (Bertoldi et al., 2007)), and 287 arcmin2 to 0.7 mJy in the GOODS-N field (Greve et al., 2008). An updated an expanded version of the Lockman Hole North map has a 0.75 mJy RMS over 566 arcmin2 (Lindner et al., 2011).
Submillimeter High Angular Resolution Camera-II [Sharc-II], 2002-2013
The Sharc-II camera operated at 350 µm and at 450 µm at the Caltech Submillimeter Observatory (Dowell et al., 2003) on Mauna Kea and was used extensively for far-infrared follow-up of Scuba submillimeter-selected galaxies at 350 µm with a 2.3 arcmin2 field of view and 9 ′′ beamsize. Since the atmospheric opacity is quite high at 350 µm making observations only accessible in the driest weather conditions, Sharc-II was not used readily for blank-field mapping. Kovács et al. (2006) and Coppin et al. (2008a) used Sharc-II to follow-up 850 µm-detected SMGs to further constrain their SEDs near the peak of their modified blackbody emission.
BOLOmeter CAMera [Bolocam], 2002-2013
The Bolocam instrument is designed for observations at 1.1 mm and 2.1 mm at the Caltech Submillimeter Observatory. Observations were not done simultaneously at both wavelengths, and the only deep field survey work done with Bolocam was done at 1.1 mm with a 30 ′′ FWHM beam (Laurent et al., 2005). Observations at 2.1 mm were motivated by searches for clusters via the Sunyaev-Zeldovich effect. A deep 1.1 mm Bolocam map of the COSMOS field exists and overlaps significantly with the AzTEC 1.1 mm COSMOS pointings.
Multiband Imaging Photometer for Spitzer [MIPS], 2003-2009
MIPS aboard the Spitzer Space Telescope (formerly known as the Space Infrared Telescope Facility, SIRTF) has been fundamental in the detection of distant galaxies at mid-infrared wavelengths (Rieke et al., 2004). MIPS had detector arrays operating at 24 µm, 70 µm, and 160 µm with beamsizes 6′′, 18′′ and 41′′, respectively. The 24 µm channel was the most sensitive and widely used; 70 µm was also used for some deep field pointings, while the 160 µm channel was the least sensitive. MIPS completed a series of large legacy mapping programs over several square degrees at 24 µm in deep extragalactic fields (Dickinson et al., 2003, Lonsdale et al., 2003, Egami et al., 2004, Le Floc'h et al., 2004, Dunlop et al., 2007, Sanders et al., 2007, Dickinson et al., in preparation, Chary et al., in preparation).
MIPS provided the first look at the population of mid-infrared (~ 20-70 µm) luminous galaxies in the distant Universe; the work complemented the submillimeter mapping work done at ~ 850 µm and was well suited for characterizing galaxies at z < 2. Not only was the MIPS 24 µm beamsize significantly smaller than the bolometer arrays' beamsize, but the MIPS maps covered much larger areas on the sky, providing statistically significant populations of dusty galaxies.
Selection of galaxies at 24 µm is a bit more complex than selection in the submillimeter on the Rayleigh-Jeans portion of the dusty modified blackbody. The rest-frame 24 µm emission of a dusty starburst is dominated by hot dust emission (~ 100-200 K) and not the canonical cold (~ 30-50 K), diffuse dust dominating the bulk of infrared emission at longer wavelengths. This hot dust could emanate from more compact star-forming regions, or 'clumps' within galaxies or it could emanate from hot, dusty tori surrounding black hole accretion disks at the galaxies' center. At redshifts z ~ 1 - 2, the observed 24 µm band could be dominated by emission features generated by heavier dust grains, in particular Polycyclic Aromatic Hydrocarbons (PAHs; Lagache et al., 2004) which are associated with star-forming regions (see more in § 5.7). Although the physical mechanisms driving observed 24 µm emission are varied and complex, there is no doubt that the emission is dust-generated.
A key population identified with Spitzer MIPS are 24 µm sources (Yan et al., 2004a, b, Sajina et al., 2008, Donley et al., 2010, Zamojski et al., 2011, Sajina et al., 2012), and the subset of this population, Dust Obscured Galaxies (DOGs, Dey et al., 2008). DOG selection requires 24 µm emission and a very red color between optical R-band and 24 µm. The DOG population (defined formally in the glossary, § 12), is representative of the family of mid-infrared bright dusty galaxies, ranging from pure starbursts, to obscured AGN-dominated sources, to very luminous PAH emitters.
Far-Infrared Surveyor [FIS], 2006-2011
The Far-Infrared Surveyor on board the 68.5 cm AKARI telescope (formerly known as the ASTRO-F satellite; Murakami et al., 2007, Kawada et al., 2007) imaged the sky at 65 µm, 90 µm, 140 µm, and 160 µm. Similar to the original IRAS survey, FIS conducted an all-sky far-infrared survey (Yamamura et al., 2010) at relatively shallow depths (i.e. insufficient to detect high-z unlensed galaxies) but conducted a few deep field pointings, including the AKARI deep field South (ADF-S) covering ~ 12 deg2 (Clements et al., 2011). The ADF-S hosts several tens of bright 90 µm galaxies (the 90 µm channel being the most sensitive) yet to be characterized in detail; a number of spectroscopic redshifts for the galaxies have been compiled in Sedgwick et al. (2011). The AKARI observatory also hosted the InfraRed Camera (IRC; Onaka et al., 2007) operated at shorter wavelengths, from 2.4-24 µm, yet was not focused on deep-field extragalactic work as Spitzer IRAC and MIPS fulfilled that role.
Balloon-borne Large Aperture Submillimeter Telescope [BLAST], 2006-2007
BLAST provided a unique look into the 250-500 µm sky (Devlin et al., 2009) in advance of Spire on the Herschel Space Observatory. Since the sky is virtually opaque at these wavelengths, the BLAST detector was launched on a balloon to rise above most of the Earth's atmosphere on a number of scheduled flights in the Arctic and Antarctic circles. BLAST's scientific flights took place in 2005 (launched from Esrange, Sweden) and 2006-2007 (launched from McMurdo, Antarctica). The latter flight resulted in near-destruction of the telescope but total recovery of the data. In that flight, BLAST conducted the first deep extragalactic surveys at 250-500 µm, one covering 9 deg2 encompassing the Extended Chandra Deep Field South (ECDF-S, Devlin et al., 2009) and another 8 deg2 near the south ecliptic pole. While BLAST discovered many individual FIR-luminous galaxies not yet previously discovered (Dunlop et al., 2010, Chapin et al., 2010), its large beamsize and large area coverage were best suited for measurements of the CIB. More details on BLAST's CIB results and clustering measurements are given in § 7. A documentary film entitled BLAST! recounts the drama of the BLAST launches.
Spectral and Photometric Imaging Receiver [Spire], 2009-2013
The Spire instrument was launched aboard the Herschel Space Observatory in May of 2009 and operated until April 2013. Spire consisted of both a spectrometer and an imaging photometer operating in three wavebands simultaneously at 250 µm, 350 µm, and 500 µm. The photometer was used primarily for mapping large areas of sky under the Herschel Multitiered Extragalactic Survey (HerMES; Oliver et al., 2012) and the Herschel-ATLAS Survey (Eales et al., 2010) to varying depths. The beamsize of 250 µm, 350 µm, and 500 µm observations was 18′′, 26′′ and 36′′, respectively with a confusion limit of 5.8 mJy, 6.3 mJy and 6.8 mJy, respectively. Spire has been very useful for constraining measurements of the CIB and discovering rare, isolated bright far-IR sources which have sometimes been found to be very distant lensed submillimeter galaxies, many of which are described throughout this review.
Photodetector Array Camera & Spectrometer [Pacs], 2009-2013
The Pacs instrument, launched aboard the Herschel Space Observatory along with Spire, consisted of both an integral field spectrometer and imaging photometer. Although less commonly used for high-z submillimeter sources, the spectrometer provided spectral coverage from 57-210 µm and was very valuable for identifying rarer species of gas emission in nearby ULIRGs (e.g. van der Werf et al., 2010). The imaging photometer provided simultaneous two-band imaging at 70 µm, 100 µm, and 160 µm and was used primarily by the Pacs Evolutionary Probe team (PEP; Lutz et al., 2011), and the GOODS-Herschel team (Elbaz et al., 2011). Although Pacs had a much smaller beamsize than Spire due to the lower wavelengths probed (5′′, 7′′ and 12′′ at 70, 100, and 160 µm, respectively) and the confusion limit was much lower at these wavelengths, Pacs mapping was not as efficient as Spire mapping, making it more difficult to cover large areas of sky. Between the two major extragalactic deep field surveys PEP and GOODS-Herschel, about 3 deg2 were imaged at 100 µm and 160 µm, with < 1 deg2 at 70 µm.
Wide-field Infrared Survey Explorer [WISE], 2009-2011
The WISE satellite conducted an all-sky survey at 3.4, 4.6, 12 and 22 µm with a 40 cm diameter telescope and led to important discoveries of near earth objects and Y-dwarf stars; most relevant to the detection of DSFGs is the all-sky 22 µm coverage (Wright et al., 2010). Although the detection limit at 22 µm was quite shallow compared to, e.g., Spitzer MIPS at 24 µm (see Figure 5), the huge increase in sky area meant that WISE detected many ultraluminous and hyper-luminous infrared galaxies, many at high-z. The DSFGs detected by WISE are notably warm, since they were selected at much shorter wavelengths than traditional SMGs or even local IRAS galaxies (Bridge et al., 2013, Blain et al., 2013, Tsai et al., 2013).
AzTEC, 2005-present
AzTEC, which is not an acronym, is a 144 element bolometer array camera operating at 1.1 mm currently mounted on the Large Millimeter Telescope (LMT) on the Sierra Negras outside of Puebla, Mexico (Wilson et al., 2008). AzTEC was commissioned in 2005 first on the JCMT after Scuba was taken down, and over a short two month period, AzTEC surveyed ≈1 deg2 to 1 mJy RMS, roughly the same sky area covered by the many previous surveys of Scuba. While on the JCMT, AzTEC's imaging beamsize was 19′′. AzTEC was later taken to the 10 m Atacama Submillimeter Telescope Experiment (ASTE) in Chile where it mapped sky to similar depths over large areas, but with a 29′′ beamsize, until 2008. AzTEC was transported to the LMT in 2009 and has since been undergoing tests and commissioning, awaiting the completion of the 50 m telescope (which currently is only complete out to a 32 m diameter). The beamsize at the LMT is significantly improved over the large beamsizes at JCMT and ASTE, currently 9′′ with a 32 m dish which will improve to 6′′ with a 50 m dish.
AzTEC has performed some of the deepest and widest ground-based extragalactic field pointings, including several pointings in the COSMOS field (e.g. Scott et al., 2008, Aretxaga et al., 2011) and has been responsible for the discovery of some of the highest redshift SMGs known around z ≈ 5 (e.g. Capak et al., 2011).
Large Apex BOlometer CAmera [Laboca], 2006-present
Laboca was developed by the bolometer development group at the Max-Planck-Institute für Radioastronomie as a multi-channel bolometer array for 870 µm continuum mapping installed at the Atacama Pathfinder EXperiment (APEX) telescope in Chile (Siringo et al., 2009). It was first brought to APEX for science observations in 2006/2007 and started full science operations in 2008. The Laboca beamsize is 19′′, similar to that of Scuba and AzTEC on the JCMT, although Laboca's field of view is 11.4 arcmin2. The first deep extragalactic pointing carried out with Laboca, and still the most uniform large coverage area from the instrument, is in the Chandra Deep Field South (Weiss et al., 2009a). The DSFGs discovered by Laboca in this LESS survey were some of the first to be followed up with continuum observations at ALMA interferometricall (Karim et al., 2013, Hodge et al., 2013b).
Atacama Cosmology Telescope [ACT], 2007-present
The ACT experiment (Swetz et al., 2011) is a 6 m millimeter telescope which was installed on Cerro Toco in Chile in 2007. With a beamsize about an arcminute across, observations are conducted 1.1 mm, 1.4 mm and 2.0 mm with the primary goal understanding the CMB through the Sunyaev-Zeldovich (SZ) effect and measuring temperature variations of the CMB down to arcminute scales. In surveying 455 deg2 in the 2008 ACT Southern Survey to ~ 0.03 Jy, it has also contributed somewhat to the study of DSFGs (e.g. Marsden et al., 2013), although perhaps not as much as its later counterpart, South Pole Telescope.
South Pole Telescope [SPT], 2008-present
The South Pole Telescope is a 10 m millimeter wave telescope located at the geographic south pole in Antarctica designed to detect low-contrast signals like anisotropies in the cosmic microwave background (Carlstrom et al., 2011) The bolometer array on the SPT completed a 87 deg2 survey of the sky looking for the detection of galaxy clusters via the Sunyaev-Zel'dovich effect (Staniszewski et al., 2009, Vieira et al., 2010), then later some larger surveys to 770 deg2 (Mocanu et al., 2013); the full survey area completed in 2011 was 2500 deg2 with ~ 100 bright DSFG detections. While its purpose was to detect galaxy clusters, the SPT instrument was also ideal for detecting some of the brightest galaxies emitting at long wavelengths (Vieira et al., 2010). Due to their extreme perceived luminosities, galaxies detected by SPT have been shown to be gravitationally lensed (e.g. Vieira et al., 2013, Bothwell et al., 2013b). We describe the follow-up of some of the more interesting SPT discoveries in § 6.
Submillimetre Apex BOlometer CAmera [saboca], 2009-present
The saboca instrument is a 39 channel bolometer array operating at 350 µm at APEX on Cerro Chajnantor in Chile. Although saboca has a relatively small beamsize for submillimeter bolometer observations, it is not sufficiently sensitive to detect unlensed DSFGs at high-z. In the best weather conditions (PWV = 0.2mm) the RMS at 350 µm would reach 10.3 mJy/beam after 13 hours, or 17.5 mJy/beam in average weather conditions. With large overheads, saboca has not been as widely used for submm mapping as other submillimeter bolometers, nor has it been used extensively for dedicated source follow-up at 350 µm as Sharc-II.
Goddard-Iram Superconducting 2-Millimeter Observer [GISMO], 2011-present
GISMO is a 8 × 16 pixel bolometer camera operating at 2 mm built at the Goddard Space Flight Center and is installed on the IRAM 30 m telescope at Pico Veleta in Spain (Staguhn et al., 2012). GISMO actually named GISMO-2 after the earlier prototype, GISMO; (Staguhn et al., 2006) is designed to detect the highest-redshift DSFGs by taking advantage of the dramatic K-correction at 2 mm (see Figure 3). The field of view is 1.8 × 3.7 arcmin and the beamsize 16.7′′. Some small deep fields have already been obtained, particularly in a 5 × 5 arcmin portion of GOODS-N to 120 µJy/beam RMS (Staguhn et al., 2013) with more, wider-field pointings being planned in fields like COSMOS.
Submillimeter Common User Bolometer Array-2 [Scuba-2], 2011-present
Scuba-2 (Holland et al., 2013) is the second generation bolometer array for the James Clerk Maxwell Telescope and finished commissioning in 2011. Scuba-2, a 10000 pixel camera with 100-150 times the mapping speed of Scuba, operates simultaneously at 450 µm and 850 µm. Scuba-2 is the first ground-based instrument to map blank field sky efficiently in the 450 µm window. Since the wavelength is half that of 850 µm mapping, the resolution is also improved by a factor of 2, with a 7′′ beamsize.
At 850 µm, Scuba-2 produces very similar science results to the previous Scuba instrument, although it is a much more efficient mapper, by a factor of 5-10 (the best increase in mapping speed is seen at 450 µm). At 450 µm, Scuba-2 is much more efficient than Scuba. The Scuba-2 Cosmology Legacy Survey (S2CLS) is the Guaranteed Time project on Scuba-2 which is dedicating the most observing time to blank-field extragalactic mapping at both 450 µm and 850 µm. Several initial works (Chen et al., 2013a, Geach et al., 2013, Casey et al., 2013, Chen et al., 2013b, Roseboom et al., 2013) describe galaxies selected at 450 µm and compare and contrast them to galaxies selected at longer wavelengths.
2.3.2. Notable surveys focused on DSFG Discovery
While the instruments above have contributed a great deal to the collective knowledge and census of DSFG activity in the high-redshift Universe, their contributions have been radically varied in scope and limitations. Figure 6 illustrates some of the more prominent 'legacy' surveys conducted in the submillimeter to date by survey area and depth, given here in units of solar luminosities. Luminosity is used as the method of quoting survey depth so that different surveys conducted at different wavelengths can be compared. Unfortunately, the conversion from a flux density limit to a luminosity limit is intrinsically uncertain and dependent on the SED shape of any given galaxy (which is impacted mostly by its characteristic dust temperature). The survey depths in Figure 6 therefore have an characteristic uncertainty which is dominated by the intrinsic variation of SED shapes, a topic which is addressed later in § 2.4.1. Also critical to note is that survey depth is redshift dependent. Shorter selection wavelengths will be most sensitive to detecting low luminosity systems at low redshift, whereas long wavelengths will be efficient at a range of redshifts, thanks to the varying K-correction (see Figure 3). What constitutes a deep survey at 100 µm at z = 1, is not that deep at z = 2.5; Figure 6 shows various survey limits at both of these epochs.
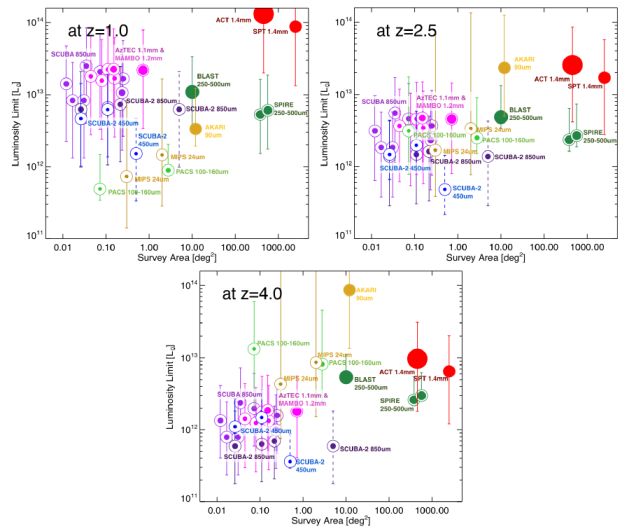 |
Figure 6. Survey Area against sensitivity, in solar luminosities, for several far-infrared surveys in the literature. Survey depth in solar luminosities is determined from the range of plausible SEDs (taken from Figure 5) which could have a given flux density, Sν, at a given selection wavelength, λ, at the given redshift. The survey depths at z = 1 are given on the upper left panel, at z = 2.5 are given in the upper right panel, and survey depths at z = 4 are shown at bottom. The symbol size corresponds linearly with the survey's beamsize, ranging from 7-90′′. Note that this plot omits all-sky far-infrared surveys from Planck, WISE, and AKARI, although their sensitivities are not deep enough to detect unlensed, non-AGN dominated DSFGs. The Scuba 850 µm surveys included on this plot (purple) are the Hawai'i Hubble map (Barger et al., 1999), the 8 mJy survey (Scott et al., 2002, Fox et al., 2002), the HDF Scan map (Borys et al., 2003, Pope et al., 2005), CUDSS (Webb et al., 2003), the Scuba Lens survey (Smail et al., 2002), and the SHADES survey (Coppin et al., 2005). At 870 µm (also purple), we include the LESS Laboca survey (Weiss et al., 2009a). From Scuba-2 at 850 µm (dark purple) and 450 µm (blue), we include recent surveys from Chen et al. (2013a) and Casey et al. (2013). We also include future survey estimates from the Scuba-2 Cosmology Legacy Survey (Smail, private communication). At 1.1 mm and 1.2 mm (magenta) we include the MAMBO surveys of GOODS-N, Elais N2, and Lockman Hole North (Greve et al., 2004, 2008, Lindner et al., 2011) and COSMOS (Bertoldi et al., 2007) and the AzTEC surveys of COSMOS (Scott et al., 2008, Aretxaga et al., 2011). At 250-500 µm (dark green), we show the BLAST ECDFS survey (Devlin et al., 2009) and Herschel-Spire legacy programs HerMES (Oliver et al., 2012) and H-ATLAS (Eales et al., 2010). At 100 µm (light green), we show the results of the Pacs PEP and GOODS-Herschel surveys (Lutz et al., 2011, Elbaz et al., 2011). The AKARI 90 µm deep field (Clements et al., 2011) is also shown (gold) as are the Spitzer MIPS coverages of GOODS-N and COSMOS (Sanders et al., 2007, Dickinson et al., in prep). At 1.4 mm (red), we also include the ACT survey (Marsden et al., 2013) and the SPT survey (Vieira et al., 2013). |
The largest survey conducted with Scuba was the SHADES survey (Coppin et al., 2005) covering 0.25 deg2 to 2 mJy RMS, though several prior surveys at 850 µm opened up the discovery space for far-infrared galaxies: the Hawai'i Hubble map with 0.2-4 mJy RMS over 110 arcmin2 (Barger et al., 1999), the 260 arcmin2 2.5 mJy RMS 8 mJy survey (Scott et al., 2002, Fox et al., 2002, Lutz et al., 2001, Almaini et al., 2003, Ivison et al., 2002), the HDF Scan map with 125 arcmin2 to 3 mJy (Borys et al., 2003), CUDSS with 1 mJy RMS over 60 arcmin2 (Webb et al., 2003), and the lens survey with 1.7 mJy RMS over 45 arcmin2 Smail et al., 2002). In the mid-2000's, Mambo began producing similarly fruitful results in Elais N2 and Lockman Hole, with 0.8 mJy RMS over 160 arcmin2 (Greve et al., 2004), 1 mJy RMS over 400 arcmin2 in COSMOS (Bertoldi et al., 2007), 0.7 mJy RMS over 287 arcmin2 in GOODS-N (Greve et al., 2008), and 0.75 mJy RMS over 566 arcmin2 in Lockman Hole North (Lindner et al., 2011). AzTEC soon followed with even larger sky areas at 1.1 mm with deep maps in COSMOS, to 1.3 mJy RMS over 0.15 deg2 (Scott et al., 2008) and 1.25 mJy RMS over 0.72 deg2 (Aretxaga et al., 2011). The 870 µm LABOCA coverage of CDFS (Weiss et al., 2009a) is also comparably large, and provided the first uniform SMG sample followed up with ALMA interferometrically (Karim et al., 2013, Hodge et al., 2013b).
Also in the mid-2000's were some surveys at shorter wavelengths; notably the Spitzer MIPS large sky coverage at 24 µm. Although not probing the peak of the modified blackbody emission directly, the 24 µm surveys covered much larger areas than prior submm mapping. Some of the deepest maps were in GOODS-N (Dickinson et al., in preparation) and COSMOS (Sanders et al., 2007) with SWIRE covering larger areas 50 deg2 to shallower depths of 280 µJy (Lonsdale et al., 2003). The deepest map from AKARI, the 10 deg2 AKARI deep field (Clements et al., 2011), places it in a regime where it can detect unlensed high-z DSFGs.
Immediately prior to the launch of the Herschel Space Observatory, the BLAST and SPT experiments (Carlstrom et al., 2011) conducted their work at 250-500 µm and 1.4-2.0 mm respectively. The former completed a 10 deg2 deep-map pointing around the ECDFS to ~ 15 mJy RMS (Devlin et al., 2009) while the latter completed a much larger and shallower 87 deg2 survey to 11 mJy RMS at 1.4 mm (Vieira et al., 2010).
By the end of the 2000's, the Herschel Space Observatory was launched and large scale ~ 100 deg2 sensitive submillimeter surveys became reality. The legacy programs of the Spire instruments immediately set out to survey vast areas of sky at 250-500 µm. The H-ATLAS survey (Eales et al., 2010) covers ~ 570 deg2 to 35-45 mJy RMS while the HerMES survey (Oliver et al., 2012) covered ~ 380 deg2 in a wedding cake style; HerMES data were largely confusion limited with sensitivities ~ 5-10 mJy. By the end of Spire's life in 2013, it had surveyed about 1300 deg2 to varying depths. Unfortunately the Pacs instrument did not have the efficient mapping capabilities of Spire; nevertheless, the depth achieved by Pacs PEP (Lutz et al., 2011) and GOODS-Herschel (Elbaz et al., 2011) legacy surveys - particularly at z = 1 - is unrivaled.
2.4. Selection biases and Sensitivity
A discussion on the DSFGs selection methods would not be complete without an analysis of their selection biases and relative sensitivities. Galaxies' flux densities at any given wavelength depend not only on their intrinsic luminosities, but also their SED characteristics. Furthermore, the physical characteristics of DSFGs which we infer from these surveys depends on successful counterpart and redshift identification of the systems. How are our conclusions regarding DSFG evolution impacted by potential SED variation? How are they impacted by the process and success rates of individual source follow-up? What have we missed? The two subsections below address these two problems in detail. First, the impact of intrinsic variation in SED types in § 2.4.1, and second, the impact of multi-wavelength counterpart matching in § 2.4.2.
2.4.1. Intrinsic Variation in SEDs
The average measured dust temperature of DSFGs is ~ 30 - 40 K 6. This temperature is characteristic of dust heated by ambient star formation activity in molecular clouds scattered throughout the galaxy. The volume of dust surrounding these star-forming regions might be diffuse, thus difficult to heat in bulk substantially above ~ 50 K without a very bright nuclear source. From studies of local galaxies, particularly the Revised Bright Galaxy Sample (RBGS; Sanders & Mirabel, 1996), dust temperatures for star-formation dominated DSFGs range between 20-60 K. This dust temperature range represents the intrinsic variation of SED shapes in local ULIRGs, not the uncertainty by which the temperatures are constrained. How does intrinsic DSFG SED variation impact the detection and selection of distant dusty starbursts in the submillimeter? How does it impact the perceived completeness of a population of DSFGs selected in a single band?
Figure 7 illustrates the evolving luminosity detection limits from 0 < z < 5 at different detection wavelengths for a 30 K dust SED and a 55 K dust SED which we use to illustrate the significant dependence of survey depth on assumed dust temperature. While some limits remain stable within a factor of ~ 2 between the panels (e.g. 24 µm, 70 µm, 160 µm, 250 µm) other luminosity thresholds change dramatically (e.g. 850 µm, 1.1 mm, 2.0 mm) where much fainter cold-dust sources are detectable than warm-dust. This is known as the submillimeter dust-temperature selection effect (Blain, 1996, Eales et al., 2000, Blain et al., 2004a). This effect implies that, luminosities being equal, even minor differences in SED shape can impact the measured flux densities at any given submillimeter flux and select against galaxies of certain SED types. At 850 µm, this effect was described by Blain et al. (2004a) and observationally verified by Chapman et al. (2004a) and Casey et al. (2009c), where at and z ~ 2, a galaxy's 850 µm flux density goes as S850 ∝ LIR Tdust-3.5. Galaxies with fixed luminosity LIR and warmer dust (~ 50 K) will have dramatically lower S850 and a much lower likelihood of being selected as a submillimeter galaxy, even though it might have an infrared luminosity typical of other submillimeter galaxies.
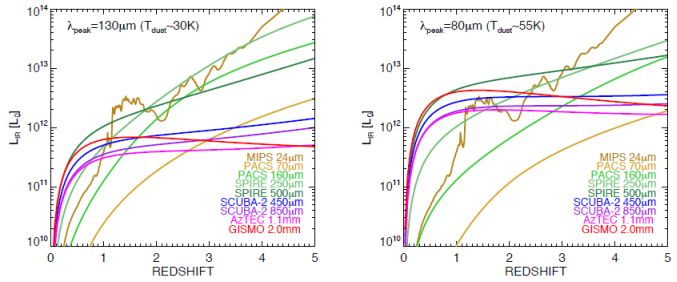 |
Figure 7. The luminosity limits of different submm bands as a function of redshift for two DSFG SEDs, used to highlight the strong dependence of survey depth and completeness on assumed dust temperature. On the left, we use a DSFG SED (modified blackbody of the type given in Eq 7) which peaks in Sν at 130 µm and can be characterized with a temperature of 30 K. On the right, we use an SED peaking at 80 µm and has a temperature of 55 K. Both SED types are within the range of typical expected ULIRG temperatures (20-60 K). This illustrates the dramatic impact that SED shape can have on the sensitivity limits of submillimeter observations at certain redshifts. The wavelengths most impacted by dust temperature are those > 500 µm, while those at 70-250 µm are minimally affected (but might be affected by the presence of AGN emission, not accounted for here). |
The first inclination that the canonical Scuba-selected SMG population was incomplete and biased against warm-dust SEDs (see Blain et al., 2004a, for the first detailed discussion of the topic) lead to the investigation of possible warm-dust SMG cousins. Given the procedure for identifying SMGs' counterparts relied on identification in the radio, where emission is dominated by synchrotron emission mixed with free-free emission (a topic we discuss in the next subsection), a natural place to search for warm-dust SMG cousins is the temperature-independent radio waveband. Chapman et al. (2004a) summarizes the results of the first search of the warm-dust analogue of SMGs as Optically Faint Radio Galaxies (OFRGs). OFRGs later became known as Submillimeter-Faint Radio Galaxies (SFRGs) in later work (Casey et al., 2009c, a, Magnelli et al., 2010, Casey et al., 2011b) which confirmed that they were truly warm-dust analogues of SMGs with similar physical properties.
Figure 8 illustrates the submillimeter dust-temperature selection effect another way. For a galaxy of fixed luminosity and redshift, the observed flux density in a given submillimeter band will vary with dust temperature, or SED peak wavelength. The flux density dependencies on dust temperature are critical to keep in mind when considering 'completeness' of populations. Particularly in the context of completing an accurate census of all infrared-luminous activity, this type of prominent selection bias needs to be considered.
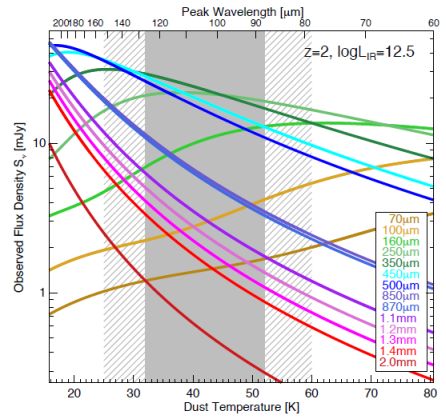 |
Figure 8. For a galaxy of fixed redshift (z = 2) and luminosity (log(LIR) = 12.5), the relationship between SED shape or dust temperature and measured flux density at a variety of wavelengths from the mid-infrared through the millimeter. The solid gray stripe in the background represents the typical characteristic dust temperature range of local ULIRGs; the hashed region represents the dust temperature range of all local infrared-bright galaxies (i.e. from RBGS Sanders & Mirabel, 1996). Within the peak dust temperature range, ~ 32-52 K, 850 µm-1.2 mm flux densities can vary up to 1 dex. Observed wavelengths that are nearer the peak in the SED show a shallower dependence on temperature. |
2.4.2. Identifying Multi-wavelength Counterparts
Although long-wavelength submillimeter observations benefit substantially from the negative K-correction (Figure 3), enabling detection of sources out to very high-z, the difficulty in following up those sources and characterizing them at other wavelengths can bias the interpretation of the population. The large beamsize of single-dish submillimeter observations is the key limiting factor. Bright submillimeter sources will have positional uncertainties of order several to tens of arcseconds and the number of possible counterpart galaxies corresponding to that source is in the tens. Although direct far-infrared/submillimeter interferometric follow-up is the most certain way of narrowing down the position of the submillimeter source to ~ 1′′, interferometric follow-up for submillimeter sources has often been observationally expensive. Other methods can be employed to identify the multiwavelength counterpart to infrared-luminous sources.
Radio counterparts:
Traditionally, this was done by identifying counterparts at radio wavelengths. Radio interferometric observations are far easier to make than far-infrared interferometric observations due to the atmospheric transmission (see Figure 4), and most of the deep extragalactic legacy fields containing submillimeter data already have been surveyed by radio arrays at 1.4 GHz like the Very Large Array, which is now known as the Jansky Very Large Array (VLA) after being largely rebuilt. Searching for infrared-bright galaxies at radio wavelengths exploits the locally observed correlation between radio emission and far-infrared emission in starburst galaxies, described first in Helou et al. (1985) and Condon (1992). Although the physics of this correlation is debated, it is clear that radio synchrotron emission arising from supernova remnants trace the obscured star formation quite well, and that there seems to be little to no evolution in this relationship out to high-redshifts (Murphy, 2009, Ivison et al., 2010a, b).
The advantage of matching submillimeter sources to radio counterparts is that radio sources are much more rare than optically-bright galaxies (Ivison et al., 2007). Although tens of optically-bright galaxies might be visible within one submillimeter beam, it is rare to have more than one radio-bright galaxy (here, radio-bright simply means radio-detected at S1.4 ≳ 50 µJy). Once a radio position is in hand, the source can quickly be identified at other wavelengths and even followed-up using traditional spectroscopic methods in the optical and near-infrared (which was done most famously by Chapman et al., 2005, for a set of ~ 75 Scuba-selected SMGs). With accurate positions and redshifts in hand, follow-up physical characterization can be done.
Of course, the disadvantage of matching to radio counterparts is that a large fraction of submillimeter sources do not have radio counterparts. Chapman et al. (2003b) and Barger et al. (2007) study the µJy radio galaxy population in detail and how they relate to the 850 µm-selected Scuba population. In one of the deepest radio continuum maps, only 66% of S850 > 5 mJy SMGs were radio detected. In slightly shallower coverage areas, the fraction is more like 40-50%. If so many submillimeter sources lack radio counterparts, how will our interpretation of the submillimeter galaxy population be impacted if we only consider those that do?
Unlike submillimeter observations, radio 1.4 GHz observations do not benefit from a negative K-correction at high-redshift (see Figure 3); galaxies at z ≳ 3.5 are very difficult to detect at radio wavelengths. This could imply that the submillimeter sources without radio counterparts sit at high redshifts, but that is difficult to constrain as some other factors could also lead to a radio-faint submillimeter source (like submillimeter multiplicity discussed in § 2.5 or variation in the far-infrared/radio correlation discussed more in § 5.12). Nevertheless, our ability to deduce intrinsic properties for the DSFG population, like the peak epoch of formation, is hampered by our inability to identify roughly half of the submillimeter population.
24µm cross-identifications:
Recognizing the low fraction of submillimeter sources identified at radio wavelengths, work has been done to match submillimeter emission to detection in other bands. This has primarily been done with Spitzer MIPS 24 µm maps, as they cover large areas of sky to sufficient depths (e.g. Pope et al., 2006, Dye et al., 2008). While mid-infrared emission does roughly correlate with far-infrared emission, a few aspects of mid-infrared emission complicate the relation. From z = 0 to z = 4, emission and absorption features from Polycyclic Aromatic Hydrocarbons (PAHs; discussed further in § 5.7) and silicates alter the underlying warm-dust continuum. This manifests in an irregular detection boundary with redshift; as seen in Figure 7, a 1012 L⊙ galaxy is detectable at 24 µm at z < 1 and in the narrow range 2 < z < 2.2. Furthermore, as we will see later, the variety of mid-infrared spectral types in DSFGs is large and does not always map directly to the integrated far-infrared luminosity. One further disadvantage of matching far-infrared emission to 24 µm is that the sky density of 24 µm sources is significantly higher than those in the radio, although still much lower than in the optical. Despite these drawbacks, deep 24 µm imaging from Spitzer is far more abundant in extragalactic legacy fields than sufficiently deep radio maps, making it a natural second choice for counterpart matching.
More recent data from Herschel have made use of the multi-wavelength counterpart technique to constrain the positions of infrared-luminous sources. Roseboom et al. (2010) introduced a cross-matching technique, dubbed 'XID,' which uses 24 µm and radio positional priors to determine both accurate positions as well as deboosted flux densities for Herschel-selected galaxies (HSGs). The technique (updated in Roseboom et al., 2012) identifies significant Herschel detections and investigates nearby 24 µm or radio sources as possible counterparts using a likelihood estimator. Since Herschel maps are confusion limited, this multi-wavelength counterpart matching must be done iteratively across the entire map, and not individually source by source. While the disadvantages of the XID method are the same as prior attempts as using radio or 24 µm counterparts (a potentially high fraction of high-z galaxies will be missing at 24 µm or 1.4 GHz), this technique can be used to assess statistically large populations of z ≲ 2 far-infrared selected galaxies.
Optical and near-IR counterparts using likelihood ratio:
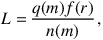
Although matching a large-beamsize submillimeter position directly to an optical/near-infrared source can have high failure rates, there is a technique which assesses the quality of such a match. Performing a likelihood analysis that accounts for both the relative positions and other observable properties of optical sources within a beamsize gives a somewhat reliable estimate as to cross-identification purity. The likelihood ratio can be written as the probability that an optical or near-IR source is the correct counterpart to the longer wavelength submm galaxy with an equivalent probability for an unassociated background source, written as
 |
(1) |
where q(m) and n(m) are the normalized magnitude distributions of counterparts and background sources, respectively. The radial probability distribution of the separation between submm source and the shorter wavelength galaxies is denoted by f(r). This likelihood ratio (LR) method was developed in Sutherland & Saunders (1992) with additional improvements in Ciliegi et al. (2003), Brusa et al. (2007) and - in the context of submillimeter data - in Chapin et al. (2011). This likelihood ratio estimator is similar to the calculation of “p-values,” or the corrected-Poissonian probability. This is the probability of counterpart alignment for a member of a certain population (e.g. 24 µm-selected galaxies, optical i-band selected galaxies, etc) having a given space density. The p-value is calculated via the following as described in Downes et al. (1986):
 |
(2) |
where n is the source density of the given counterpart type, θ is the angular offset between original source and counterpart. The p-value itself represents the probability or random coincidence, and generally, a match is considered reliable if p < 0.05 (e.g. Ivison et al., 2002, Pope et al., 2006, Chapin et al., 2009, Yun et al., 2012, Hodge et al., 2013b, Alberts et al., 2013). The p-value is more appropriate for catalogs in which the surface density is low (e.g., radio identifications) and favors counterparts that are brighter than the background population. Since the surface density of optical and near-infrared sources is high, the LR method is favorable when rarer counterpart types are not available.
Both likelihood matching methods have been implemented to match submillimeter counterparts to optical and near-IR counterparts (e.g. Smith et al., 2011, Fleuren et al., 2012, Bond et al., 2012, Kim et al., 2012), and both methods have been naturally extended to account for other properties of galaxies beyond positional and flux information, such as near-infrared luminosity and color (Wang et al., 2006, Serjeant et al., 2008, Kim et al., 2012, Alberts et al., 2013).
This type of matching is especially necessary when the availability of 24 µm or radio ancillary data is lacking, e.g. over areas spanning many tens to hundreds of square degrees, as recently done with Herschel in the H-ATLAS collaboration. Over these wide areas, near-IR and optical coverage has and will be much more plentifully available and can be used as a direct way of identifying counterparts (see example in Figure 9) The primary drawback of this method is that it assumes one counterpart to each submm source and has no mechanism to account for source multiplicity; however, as discussed in § 2.5, that can be difficult to surmise from radio and 24 µm counterpart identifications as well.
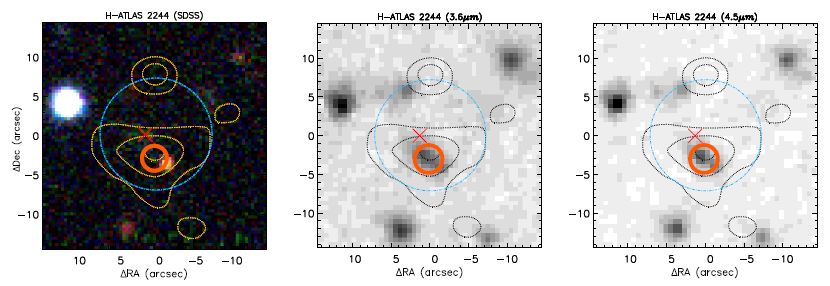 |
Figure 9. An example of a Herschel source that was identified using the likelihood ratio (LR) method with SDSS and IRAC. From left-to-right we show a three-color SDSS image (g, r, and i bands), the 3.6 µm, and the 4.5 µm data. The galaxies identified as the SDSS and IRAC counterparts to the SPIRE source are marked with an 'X' and a small circle, respectively. The LR method prefers the IRAC identification marked with a circle over the SDSS-based identification as the counterpart to the SPIRE source. The large circle has 7.2′′ radius and encompasses the SPIRE 3σpos area in which counterparts are identified. Contours show the SPIRE 250 µm emission at 5, 7, 9, 11σ levels. In the absence of high-resolution sub-mm imaging we cannot determine whether this SPIRE source is the results of blended emission from the two identified galaxies, or whether one of those counterparts is a chance association. The figure is reproduced from Kim et al. (2012) with permission from the authors and AAS. |
One can also use Bayesian techniques (Budavári & Szalay, 2008) that uses a priori knowledge of the counterpart population from one area to guide the identification process of another sky area. This technique has been frequently used to cross-identify X-ray sources in mid and near-IR data (Brand et al., 2006, Gorjian et al., 2008). Bayesian methods are not currently pursued to cross-identify far-IR and submm sources due to the need for a priori in describing the cross-identifications, perhaps with another method. The LR analysis is advantageous in that you can make use of prior information if you have it, unlike the p-statistic (see again Chapin et al., 2011, Alberts et al., 2013).
One of the more recent advances in DSFG work has come from high-resolution far-IR maps providing the initial constraints on the multiplicity of SMGs: in other words, the number of galaxies that contributes to a given submm source's flux density. For confusion-limited surveys (see § 3.1) where sources' flux density would not evolve substantially with redshift (due to the negative K-correction), the probability that two less luminous galaxies masquerade as a single, line-of-sight submm source is not low (it is much higher in the submm than in the optical, where sources at different redshifts are unlikely to have comparable flux densities). For observers studying the environments of heavy star formation at high-z, the initial worry was that some of the most extreme galaxies contributing to the bright-end tail of the flux density distribution may actually resolve into multiple counterparts when examined at high spatial resolution. Indeed, most theoretical models that have aimed to understand the origin of SMGs and other high-z dusty sources have found great difficulty in reproducing the numbers of the brightest sources as individual galaxies (c.f. § 10). In fact some observational works argue with likelihood estimates that submillimeter sources are probably mostly multiples (Chapin et al., 2011). Wang et al. (2011c) used the SMA to map the morphologies of two SMGs, and found that both resolved into multiple counterparts. This study was expanded upon by Barger et al. (2012), who found nearly ~ 1/4 of their sample of 16 SMGs observed with the SMA resolved into multiple counterparts as well.
With the advent of ALMA (even in Cycle 0), this field has been revolutionized. Hodge et al. (2013b) and Karim et al. (2013) found that potentially between 30 - 50% of a sample of ≳ 100 high-z SMGs break up into multiple counterparts, and all sources above S870 > 10 mJy are intrinsic multiples. Their initial detections as a single source by single dish telescopes was confused by the poor resolution of these facilities (e.g. the JCMT) compared to ALMA. To some degree, this phenomena was expected from early radio studies (e.g. Pope et al., 2006, Ivison et al., 2007), clustering measurements (Blain et al., 2004a, Hickox et al., 2012), and numerical models (Hayward et al., 2012). We note that not all high-resolution studies of SMGs have revealed multiplicity to the same extent as the Hodge et al. (2013b) and Karim et al. (2013) which could be biased due to the known underdensity of bright SMGs in the Chandra Deep Field South. For example, Hezaveh et al. (2013) and Chen et al. (2013a) find fewer multiples, the latter work estimating a multiple fraction of SMGs of 10% with several examples of intrinsic >10 mJy single-source SMGs. In all studies, sample sizes are still relatively small (although the ALESS sample is ~ 90 galaxies strong, they are biased fainter than most SMG populations), and we can only expect that much larger, statistically significant samples will become available with Scuba-2 and expanded ALMA operations target this burgeoning field.
3 A single-element bolometer named UKT14 actually predated Scuba on the JCMT, and managed to detect several high-z radio quasars to ~ 4 mJy sensitivity (Hughes et al., 1997). Back.
4 Note that heavily-absorbed soft X-ray sources and self-absorbed radio sources also have negative K-corrections, although not as steep as the submillimeter. Back.
5 Note that at slightly higher redshifts (z > 3), where DL ∝ (1 + z)1.5, this becomes Sν(z) ∝ (1 + z)β - 1.5. Back.
6 This represents a weighted average for dust distributed throughout the galaxy and should not be taken literally. Back.