


4.5. The Emergent Spectrum
4.5.1. Input parameters. A complete model for an isolated cloud requires that the following parameters be defined:
 .
.
The incident continuum is known over a large range of frequencies.
Unfortunately, the most important part, the Lyman continuum up to the
soft X-ray
energies, is not observed except in some high redshift quasars. This is
a major
drawback and indirect methods (chapter 10)
must be used to estimate
L in
that gap. Another uncertainty is the high energy tail
(h > 30 keV) which is
not yet observed in many AGNs. This has important implications in models
of large Ncol. Finally, free-free absorption at low
frequencies may be a
significant heating source for the BLR, but it is not at all clear that
the observed
far infrared radiation originates in a small, point-like continuum
source (see R.
Blandford's contribution), If this radiation comes from an extended disk, or
any other structure large in comparison with the BLR size, then its
effect on the broad line gas, via free-free heating, is largely reduced.
Fig. 7 shows a typical continuum which is used
in photoionization
calculations and is consistent with our knowledge of many radio quiet
AGNs. The
characteristic features are the steep infrared (1 - 3µm)
slope (a spectral index
of about 1.5), the flattening at optical and ultraviolet wavelengths,
sometimes
referred to as "the big blue bump", the cutoff at about 3-10 Ryd (implied
by the models but not directly observed) and the flat X-ray continuum. The
drop at  >
30µm is artificially introduced, because of the above mentioned
uncertainty about the origin of this component.
>
30µm is artificially introduced, because of the above mentioned
uncertainty about the origin of this component.

|
Figure 7. A characteristic AGN continuum. |
The gas density can be measured, or at least estimated, from the
observed spectrum. Standard methods of nebular analysis, involving the
relative strength of several forbidden lines, suggest that
Ne  108 cm-3 in all the
NLR clouds, with a typical density of about 104
cm-3. The density of the
BLR clouds is more difficult to estimate. The absence of strong broad
forbidden lines of
[OIII]5007
indicates that collisional de-excitation takes place,
and therefore Ne
108 cm-3 in all the
NLR clouds, with a typical density of about 104
cm-3. The density of the
BLR clouds is more difficult to estimate. The absence of strong broad
forbidden lines of
[OIII]5007
indicates that collisional de-excitation takes place,
and therefore Ne
 108
cm-3. On the other hand, the strong intercombination
lines of
CIII]1909,
NIII]1750,
NIV]1486 and
OIII]1663 suggest
Ne
1012 cm-3. Detailed calculations confirm
these limits.
108
cm-3. On the other hand, the strong intercombination
lines of
CIII]1909,
NIII]1750,
NIV]1486 and
OIII]1663 suggest
Ne
1012 cm-3. Detailed calculations confirm
these limits.
It is customary to fix either the density or the pressure at the illuminated face of the cloud, and proceed by assuming constant density, constant pressure, or some other assumption. This depends, of course, on conditions outside the cloud. For example, in the "two phase model" (chapter 9) the BLR clouds are embedded in a hot (~ 108 K) intercloud gas that provides the external confining pressure. Constant pressure models are appropriate in this case. On the other hand, the cloud internal pressure, near a variable continuum source, varies in time following the changes in Te, Ne and the line radiation pressure. Since the sound crossing time (chapter 9) of the BLR clouds is comparable to the variability time of the central radiation source, a stable pressure equilibrium may never be achieved. Constant density models may be more appropriate in this case. Finally, if AGN clouds are stellar atmospheres or the outer parts of accretion disks (chapter 9), then their the structure is controlled by the local gravity.
The lower limit on the column density of the BLR clouds is of the order of 1022 cm-2. This is derived from the presence of strong low excitation lines of MgII and FeII. Some clouds of much larger Ncol are likely to exist, as deduced from the frequently observed lines of CaII, but a general upper limit is difficult to establish. Obviously, Ncol is not necessarily the same in all clouds and in all objects. The column density of typical NLR clouds is not well known but it is estimated to be smaller than the BLR column density.
The chemical composition of AGN clouds is difficult to measure because of
the nonstellar continuum shape, which results in a mixing of several
stages of
ionizations in one zone. In the BLR it is possible to use some observed line
ratios, that do not depend much on the temperature and the ionization
parameter,
to estimate the composition. An example is the
NIV]1486 /
CIV1549
ratio which is a good C/N abundance indicator. The abundances relative to
hydrogen are ill determined because of the uncertainty in the calculated
intensity
of the hydrogen lines. There is a similar difficulty in the NLR, due to the
difficulty in determining the electron density and temperature from optical
forbidden lines. The hope is to use ultraviolet HST measurement of
dielectronic
recombination lines, and to combine them with collisionally excited
lines, to determine the temperature. Thus the line pair
(CII1335,
CIII]1909), can
be used to measure Te in the C++
zone. This temperature, combined with the measured intensity of
NIII]1750 that
comes from the same region, will enable
us to directly measure the C/N abundance ratio.
The comparison of observations of many line ratios with the best model calculations suggest that the following cosmic abundances (Table 2) are within a factor 2 of the abundances in many AGNs.
| Element | N/N(H) |
| helium | 0.1 |
| carbon | 3.7 × 10⁻⁴ |
| nitrogen | 1.2 × 10⁻⁴ |
| oxygen | 6.8 × 10⁻⁴ |
| neon | 1.0 × 10⁻⁴ |
| magnesium | 3.3 × 10⁻⁵ |
| aluminum | 2.5 × 10⁻⁶ |
| silicon | 3.2 × 10⁻⁵ |
| sulphur | 1.6 × 10⁻⁵ |
| argon | 3.8 × 10⁻⁶ |
| calcium | 2.0 × 10⁻⁶ |
| iron | 2.6 × 10⁻⁵ |
The shape of the clouds is important because it determines the escape of line and continuum photons. The escape probability function in a sphere is different from that in a slab and there are "skin effects" to be considered. An infinite slab model has been adopted in many cases and will be used here. Later (chapter 5) we consider spherical BLR clouds but retain the slab escape probability function. This is well within the general limitation and uncertainty of using such transfer methods.
Finally, the value of the ionization parameter has to be determined
(alternatively, the cloud distance and
L at some
frequency). This is often used as
the variable parameter in the calculations.
4.5.2 Examples. Fig. 8
shows calculated line fluxes, as a function of the
ionization parameter, for an isolated BLR cloud. The input continuum is
the one
shown in Fig.7, the density is constant at
1010 cm-3, the column density is
1023 cm-2 and the composition is as in
Table 2. The line intensities are given relative to
H .
Calculations for an isolated NLR cloud, with the same continuum
source and abundances and N = 104
cm-3, are shown in Fig. 9. In
this case the calculations stop at
.
Calculations for an isolated NLR cloud, with the same continuum
source and abundances and N = 104
cm-3, are shown in Fig. 9. In
this case the calculations stop at
 912 =
103.5.
912 =
103.5.
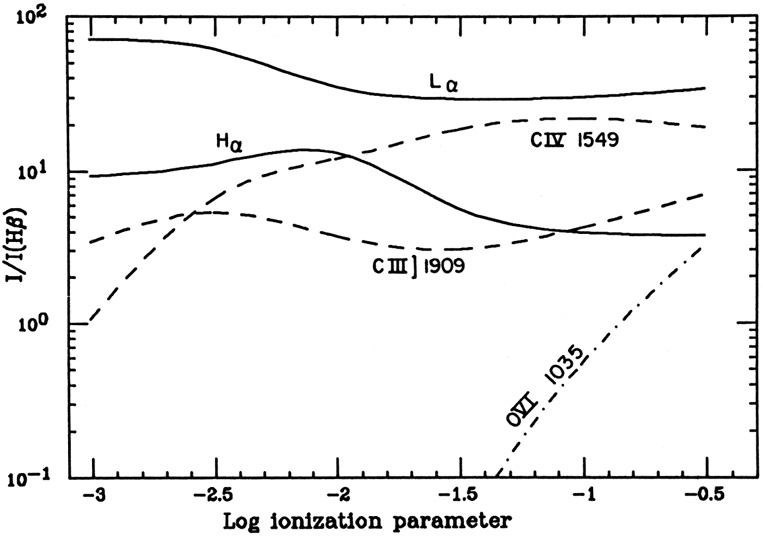
|
Figure 8. Broad line ratios, relative to
H |

|
Figure 9. Narrow line ratios, relative to
H |
As evident from the diagrams, some line ratios are good ionization
parameter indicators. In the BLR model, this is
OVI1035 /
CIV1549; in the NLR
model [OII]3727
/ [OIII]5007.
The CIII]1909 /
CIV1549 ratio,
that was
thought to be a good ionization parameter indicator for the BLR, is not so,
because of the big changes in the ionization structure at large U
that limit the
extent of the C+++ zone. The low excitation lines of
MgII and FeII (not shown
here) depend on U in a very complicated way and are not good
ionization parameter indicators. They are further discussed in
chapter 6.
The observed intensities of the broad high excitation lines (Table 1)
suggest
that the typical ionization parameter for the BLR is at least 0.1, if
all lines are
to be produced in the same population of clouds. There are, however, other
ways to produce strong, high excitation lines, such as optically thin
material.
A typical ionization parameter for the NLR is about 0.01, but there is a
large diversity in this value, as discussed in
chapter 11. The observed strength of
[FeX]6734 and
other narrow [FeX] and [FeXI] lines presents a problem,
since such lines are calculated to be too weak in clouds with the ionization
parameter required to give the observed
[OII]3727 /
[OIII]5007
ratio. The
origin of these lines may be some transition zone between the BLR and the
NLR, or perhaps the interstellar matter of the host galaxy.
Regarding the broad hydrogen lines, the calculated change in
L /
H /
H
is mainly due to the increase of the Balmer optical depth with
U. This is related to a well known problem of AGN study to be
discussed in chapter 6. Finally, the diffuse
bound-free and free-free
continua, emitted by one of the broad line clouds considered here, are
shown in Fig. 10.
/
H /
H
is mainly due to the increase of the Balmer optical depth with
U. This is related to a well known problem of AGN study to be
discussed in chapter 6. Finally, the diffuse
bound-free and free-free
continua, emitted by one of the broad line clouds considered here, are
shown in Fig. 10.

|
Figure 10. Diffuse continua emitted by a broad line cloud with U = 0.3 and all other parameters as specified in the text. |
The next step involves the combination of many one-cloud models in order to compare them with observed AGN spectra. This requires some knowledge of the gas distribution and is discussed in the following chapter.