Type Ia supernovae (SNe Ia) are defined by the lack of hydrogen and helium lines around the maximum light and the presence of strong SiII absorption features. Their peak absolute magnitudes are bright (MB typically between −18.5 and −19.5 mag) and moreover for the majority of them (about 64% of all SN Ia events, denoted as 'nornal', see Li et al 2001) the light curves are remarkably similar, in the sense that they display a well defined relation between the peak absolute brightness and the width of their lightcurve (Phillips 1993). This characteristic makes SN Ia events very good cosmological distance indicators, and led to the discovery of the accelerated expansion of the universe (Riess et al, 1998a, Perlmutter et al, 1999a).
SNe Ia are intrinsically luminous (Riess et al, 2016), thus, even with modest aperture telescopes SNe Ia can be discovered over large volumes; indeed, the All Sky Survey for Supernova (ASAS-SN; Shappee et al, 2014a) uses telescopes with only a 14 cm aperture to discover a total of 242 confirmed SNe, of which 183 were SN Ia (76%) over its first 18 months of dual-hemisphere operations (01 May 2014 to 31 December 2015) alone within mV < 17 (Holoien et al 2017a) 1. Their intrinsic luminosity also permits their discovery at significant redshift; the previous most distant SN Ia SN UDS10Wil at z = 1.914, which was discovered in the Cosmic Assembly Near-infrared Deep Extragalactic Legacy Survey (CANDELS, PI: Faber & Ferguson; see Jones et al, 2013, for details) was recently replaced with another 15 in the range from 1.9 < z < 2.3 presented in Riess et al (2017). SNe Ia in the redshift range from 0.2 < z < 0.8 are now routinely discovered and used for cosmological purposes; in the first two years of the ESSENCE project, 52 SNe Ia were discovered in this redshift range (Matheson et al, 2005).
SNe Ia, however, are not trivial objects to study and understand. Paramount among the difficulties of SNe Ia is that their progenitors and the exact physics of their ignition mechanisms are actively debated (see Sec. 2.7). Despite this, empirical measurements of the SNe Ia, as a class, show remarkable homogeneity and, due to their frequency and ubiquity, SNe Ia are likely to remain our tools for an en masse probe of the distant Universe. Figure 1 is a Hubble Diagram, a plot of distance versus redshift, for SNe Ia within z < 0.1 that demonstrates the remarkable precision (σSNe Ia ∼ 0.12 mag or 6% in distance) of SNe Ia as a class. With a sample size of > 200 (and growing), this stage of the extra-galactic distance scale is, by far, the most well constrained and provides a random uncertainty of ∼ 0.7% to the determination of the local expansion rate of the Universe (the Hubble constant or H0) (for details see discussion in Beaton et al, 2016). In this Section, the key observational components and considerations required to construct the dataset in Figure 1 are described.
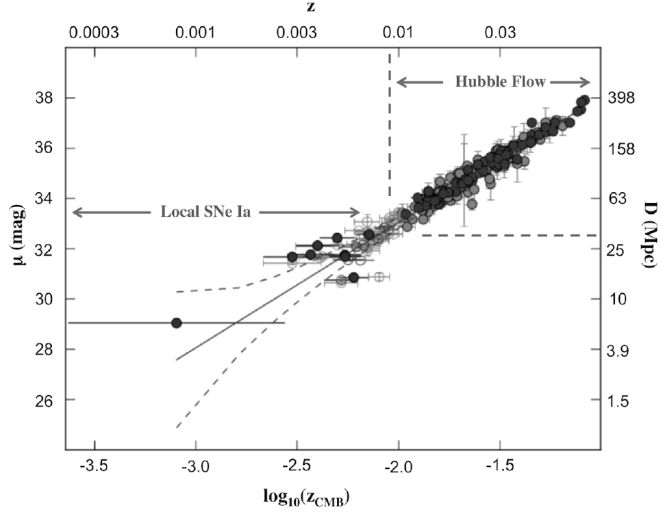 |
Figure 1. Hubble diagram for SN Ia in the Carnegie Supernova Project (dark grey) and the CfA4 survey (grey). The scatter for the SN Ia in the `Hubble Flow' sample (z > 0.01) is 0.12 mag or 6% in distance, which when averaged over the 200 SN Ia in the sample, results in a total uncertainty of 0.7% (Beaton et al, 2016). The effect of peculiar motions on the `local' sample are evident by their large scatter. The `local' sample is far less complete, with only eight galaxies in this visualization; Riess et al (2016) brought another 11 SN Ia into the `local' sample. [Adapted from Beaton et al (2016)]. |
Wood-Vasey et al (2007) present a short contextual history of the role of SNe for cosmology that we will expand upon herein. Within the context of the `Great Debate', Shapley (1919) argued that intrinsic brightness of SN 1885A found within the Andromeda galaxy of M = -16 mag was "out of the question" if Andromeda was, indeed, an `extragalactic nebulae.' Thus, Shapley argued, the island universe hypothesis for the nature of the nebulae was likely incorrect owing to this extreme luminosity. In his landmark paper describing the Cepheid variables discovered in Andromeda between 1923-1928, Hubble (1929) commented on the existence of "a mysterious class of exceptional novae which attain luminosities that are respectable fractions of the total luminosities of the systems in which they appear." Since Hubble's work provided strong evidence that the nebulae were, indeed, extra-galactic in nature (Code 1999), this new class of variables was later classified as `super-novae' by Baade and Zwicky (1934) because the approximate amount of energy released by these objects over 25 days "is equivalent to 107 years of solar radiation of the present strength."
Minkowski (1941) was the first to apply a classification scheme to the supernovae, which was based on the presence or absence of hydrogen emission lines in the spectra (the type II and type I, designations respectively). As Minkowski notes, the spectra for SNe of type I seemed remarkably homogeneous in support of the postulation by Wilson (1939) that such objects could be employed for cosmological exploration. Indeed, the discovery and utilization of SNe for distances relies on their photometric properties, but the classification of SNe into phenomenological subtypes is largely reliant on their spectroscopy. The dual-need of spectroscopic and photometric classification is a challenge for the accumulations of the anticipated large samples to be discovered in the 2020's by large scale transient monitoring programs like the Large Synoptic Survey Telescope (LSST; see discussions in Matheson et al, 2013, LSST Science Collaboration et al, 2009).
Moreover, with the advent of long-term spectroscopic and photometric monitoring of a large number of SNe Ia, there are now additional sub-classifications based on both spectroscopic and photometric diagnostics (see discussion in Parrent et al, 2014).
While both our theoretical understanding and experimental census of SNe Ia has increased dramatically, many of the original mysteries regarding the SNe Ia posed by Baade and Zwicky (1934), when their class was initially defined remain, as vibrant areas of research nearly a century later.
2.2. SN Ia as Standardize-able Candles
While their early homogeneity was suggestive of their utility as
standard candles as early as
Wilson (1939),
the ability to be used as such occurred only in the last 30 years.
Phillips
(1993),
expanding on earlier work by
Pskovskii
(1977),
reported on an apparent empirical correlation between the absolute
luminosity of a SN Ia and its the rate-of-decline in optical lightcurves
(BVI). The decline rate is the change in brightness of a given
band over the 15 days post maximum and is designated
∆m15(λ); a typical
decline rate is ∆m15(λ) = 1, but rates can
vary between 0.9 < ∆m15(λ) < 1.8
(Phillips
2012).
The ∆m15 parameter is relatively straight
forward to measure with appropriate light curves and acts as a scale
factor through which light curves of SN Ia are standardized and used as
distance indicators. In works by
Hamuy et al (1995)
and
Riess et al
(1996),
it was clear that
SNe Ia corrected for their decline rate provided precise distances.
The physics underlying this relationship is that intrinsically brighter
SNe Ia take longer to fade than intrinsically fainter SNe Ia and this is
largely thought to be due to different amounts of 56Ni
contributing to the early time light curve, though the reason for this
could be due to differences in either the total mass or its distribution
in the explosion (see
Kasen and Woosley
2007,
Parrent et al,
2014
for detailed discussions). Recent energy has been focused on the
near-infrared properties of SNe Ia, which show far more homogeneity than
the optical and are less sensitive to dust (a detailed review is given by
Phillips 2012).
Indeed, in Figure 1, the dark grey points from the
Carnegie Supernova Project (CSP) show a tighter dispersion than those in
grey from Harvard-Smithsonian Center for Astrophysics (CfA4), precisely
because of the CSP use of near-infrared photometry.
Since the large scale demonstration of SNe Ia as standardizable candles,
they have been studied at a number of regimes; these are:
(i) local (z < 0.03),
(ii) intermediate (0.03 < z < 0.3),
(iii) distant (z > 0.3),
and (iv) high-z (z > 1.2).
The SN Ia discovered within each regime are used for different goals.
Local SNe Ia can simultaneously constrain progenitor properties and serve
as calibration sources. Intermediate SNe Ia are safely in the Hubble
Flow and used to measure H0. Distant and high-z
samples are used to trace the acceleration of the Universe (w).
Thus, large collaborations have been formed to find, study, and use
SNe Ia and these generally separate into redshift (and brightness)
regimes.
Amongst numerous efforts in the community, several of note are as follows:
the CfA survey
(Riess et al,
1999,
Jha et al, 2006,
Hicken et al,
2009),
the Carnegie Supernova Project (CSP,
Hamuy et al, 2006,
Freedman et al,
2009,
Folatelli et
al, 2010),
ESSENCE
(Miknaitis et
al, 2007,
Wood-Vasey et
al, 2007,
Foley et al, 2008,
Foley et al,
2009),
SH0ES
(Riess et al,
2004b,
Riess et al,
2004a,
Riess et al, 2007,
Riess et al,
2009),
the Supernova Legacy Survey (SNLS,
Sullivan et al, 2011
and references therein),
and the Foundation Survey within Pan-STARRS (e.g,
Foley et al,
2017).
In addition to these largely ground based efforts, there are devoted
space-based programs, one of note being the SWIFT Supernova Program that
is capable of producing early- to late-time UV measurements useful for
understanding the local SN Ia environs
(Brown et al,
2015a).
A database of SNe discoveries (of all types), largely driven by
transient monitoring programs, is maintained on the Latest
Supernovae website
(Gal-Yam et al,
2013)
2,
which includes discovery imaging and classifications on a day-to-day basis.
Individual teams maintain their own databases (both publicly available
and proprietary), but the Open Supernova Catalog
3
provides a uniform access point for both
original observations and derived parameters with extensive citations
(Guillochon et al, 2016).
2.3. SN Ia as Cosmological Probes
The role of SNe Ia in the construction of our concordance cosmology is
hard to understate. They provide the largest sample of tracers for
measuring the Hubble constant (as demonstrated in
Figure 1) and their intrinsic luminosity gives
us access to the evolution of the Hubble constant over time.
The latter led to the discovery of the accelerating Universe
(Perlmutter
et al, 1997,
1998,
1999c,
Riess et al,
1998b,
Schmidt et al,
1998a).
Of particular interest are the proceedings of the Centennial Symposium
for the Carnegie Institution of Washington, entitled "Measuring and
Modeling the Universe," which carefully reflects on the establishment
of the concordance cosmology
(Freedman,
2004).
More recent reviews for which SNe Ia play a central role are: the Hubble
constant by
Freedman and
Madore (2010),
for Dark Energy and the accelerating Universe by
Frieman et al
(2008),
and a prospectus for the long term impact on physics by
Goobar and
Leibundgut (2011).
The hundreds of citations to these review articles indicate the speed at
which these fields are evolving.
Indeed, in a span of less than 20 years the `factor of two controversy'
in the value of the Hubble constant, ultimately resolved with the
HST Key Project
(Freedman et
al, 2001a),
has been recast as a 3-σ
discrepancy between the values measured from SNe Ia (e.g., by
calibration of Figure 1;
Riess et al, 2016,
Freedman et al,
2012)
and that inferred from modeling
anisotropies in the cosmic microwave background (most recently,
Planck
Collaboration et al, 2016).
As is demonstrated by
Beaton et al (2016,
their Fig. 1), as the uncertainties in either measurement technique have
progressively decreased, the discrepancy between the two techniques has
only grown. As described in
Freedman
(2017),
the SN Ia derived cosmology `is at a crossroads.'
Thus, it is meaningful to understand the observational metrics through
which we understand and characterize the SN Ia, which are driven by the
wealth of data that can be collected in the near-field.
For the purposes of the distance scale, SNe Ia in the local and
intermediate redshift regime are of the greatest interest, with
measurements made on those samples ultimately informing their use at
ever more distant regimes.
Those samples used for cosmology (z > 0.3) ultimately drive a set of
criteria that determine the "suitability" of a local or intermediate
SN Ia for direct calibration.
These restrictions are motivated by the desire to use the same intrinsic
distance indicator in all regimes and, due to observability constraints,
many of the fundamental parameters (such as the dispersion within a
class of SN Ia sample) are only well-characterized in local or
intermediate samples (to be discussed in a later section).
The requirements from
Riess et al (2016)
are: (i) observations taken on modern CCD detectors, (ii) not highly
reddenned (AV < 0.5), (iii) discovered before peak
brightness, (iv) have `typical' spectroscopic designations, and (v)
relatively homogeneous photometric data (same filters, etc.).
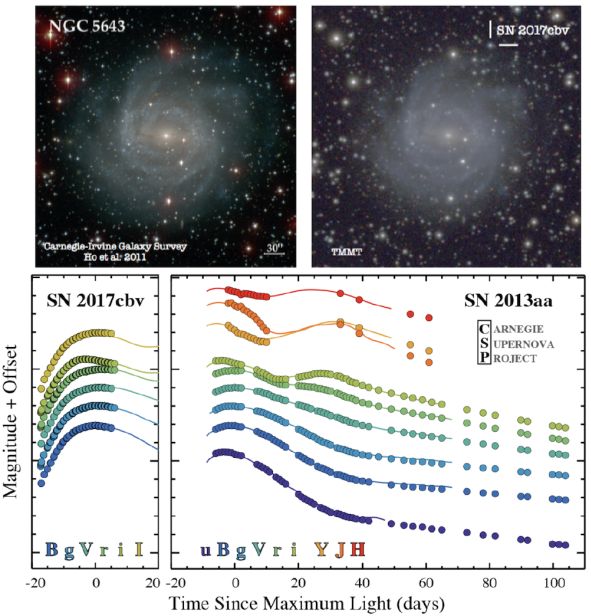
2.4. SN 2017cbv: A Recent `local' SN Ia
On March 10, 2017, a transient source, DLT17u, was discovered in the
nearby (D = 16 Mpc), face-on barred spiral galaxy NGC 5643 within the
context of the D < 40 Mpc (DLT40) one day cadence supernova search
(Tartaglia et
al, 2017).
The top panels of Figure 2 compare
a pre- and post-discovery image of NGC 5643.
Figure 2. Imaging data required to
characterize SN Ia for use in a Hubble diagram. (top panels)
Pre-imaging of NGC 5643 from the Carnegie-Irvine Galaxy Survey
(Ho et al, 2011)
as compared to a photometric monitoring image of NGC 5643 with
SN 2017cbv indicated (imaging using the TMMT;
Monson et al,
2017,
A. Monson, priv. communication).
(bottom panels) Daily photometric monitoring of SN 2017cbv (left) in six
photometric bands from a pair of robotic telescopes at Las Campanas
Observatory through maximum light. This exquisite pre-maximum
photometry is enabled by dual-hemisphere monitoring programs and can be
compared light curves from the previous SN Ia in NGC 5643, SN 2013aa
(right). The nine-band photometric monitoring from the CSP permits
detailed study of the the SN Ia, including direct fits for the
extinction law local to the SN Ia. SN 2017cbv will be followed for a
similar length of time as SN 2013aa from the ground and space. Small
ticks correspond to a luminosity change by 1 mag. Light curves courtesy
of A. Monson, M. Seibert, and C. Burns.
Within 20 hours, a spectrum was obtained for the source that classified
it as a SN Ia from the characteristic broad emission lines
(Hosseinzadeh et al, 2017).
Comparison of the spectrum to a series of
templates indicated this object was found at least 2 weeks before
maximum light and detailed comparisons to template spectra within the
Superfit code
(Howell et al,
2005)
confirmed this was young SN Ia. Based on this classification, the
transient DLT17u was renamed to SN 2017cbv.
Additional careful photometric monitoring of the object began nearly
immediately after its discovery (e.g.,
Coulter et al,
2017,
among others) and, due to its brightness (it reached ∼
11.5 mag in V), both professional and amateur astronomers have
participated in data collection.
It is noteworthy that NGC 5643 was home to a SN Ia in 2013, SN 2013aa
(Parrent et al,
2013),
which was extensively monitored by the Carnegie Supernova Project (CSP,
Freedman et al, 2009,
Hamuy et al,
2006).
In contrast to SN 2017cbv, SN 2013aa was only classified `a few days
before maximum
(Parrent et al,
2013),
which limited follow-up observations by other teams.
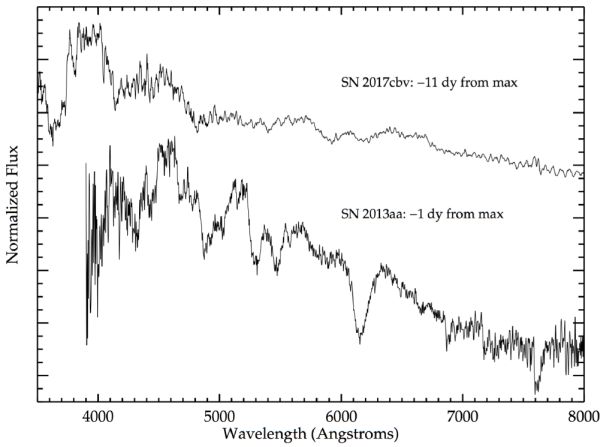
In Figure 3, the -11 day spectrum of SN 2017cbv is
compared to the -1 day spectrum of SN 2013aa. There are marked
differences between the spectral evolution over just this 10 day time
span, but the broad, often asymmetric, spectral features are
characteristic of SNe Ia. The ability to find these events early and
begin the follow-up process not only aids in the use of a SN Ia for
distance determination, but also in revealing their physical evolution.
A detailed guide to optical spectral classification for all SNe is given
in
Filippenko
(1997a)
and for SNe Ia by
Parrent et al
(2014);
in particular,
Parrent et al
(2014)
demonstrates the spectral evolution with time, for which the spectrum of
SN 2017cbv represents one of the earliest ever observed.
Figure 3. Classification spectra for the SN
Ia in NGC 5643. SN 2017cbv was classified at least -10
days from
maximum and the same day of discovery (top). SN 2013aa was classified
-1 day from maximum and three days after its discovery (bottom). These
two spectra are demonstrative of the differences in SN Ia spectra on
∼ 10 day timescales. The spectrum for SN 2017cbv was retrieved
from the Transient Name Server
(https://wis-tns.weizmann.ac.il/object/2017cbv)
and obtained by
Hosseinzadeh et al (2017).
The spectrum for SN 2013aa was retrieved via the Latest Supernovae
(Gal-Yam et al, 2013)
compilation and obtained by Terry Bohlsen
(http://users.northnet.com.au/~bohlsen/Nova/sn_2013aa.htm).
The photometric monitoring data for SN 2017cbv and SN 2013aa are
compared in the bottom panels of Figure 2.
Multi-band simultaneous light-curve fits from SNooPy
(Burns et al,
2011,
2014)
are also shown for both SNe Ia underneath the individual observations.
The key difference is the (i) dense sampling permitted with robotic
facilities and (ii) the > 10 day difference in the starting point of
the light curve. Utilizing a SN Ia for a distance measurement requires
careful fitting of the time of maximum light, which is less ambiguously
determined for SN 2017cbv than for SN 2013aa.
Moreover, to simultaneously and self-consistently solve for both the
total extinction (the combined foreground Galactic extinction and the
internal host-galaxy extinction) and the reddening law (e.g.,
RV) local to the SN Ia, simultaneous multi-band
fitting is necessary. Preliminary fitting with SNooPy for both SNe Ia
suggest that the total extinction for both objects is consistent with
the foreground component; this is consistent with the location of either
SN Ia in the outer disk of NGC 5643.
The light curves for SN 2013aa which are typical of the CSP program,
show the differences between the light curves observed in blue and red
wavelengths. At longer wavelengths (longward of i′, there
is a secondary maximum
that occurs around 35 days. The strength and timing of
the secondary maximum is correlated with the decline rate (with the
fastest decliners showing no bump), which is suggestive that it has some
physical connection with the primary maximum (see discussion in
Phillips 2012
and their Fig. 1). The near-infrared properties of SNe Ia have revealed
additional peculiar classes not apparently in the optical light-curves.
For this reason,
Phillips (2012)
argues that the Y is well
positioned to meet the complementary needs of signal-to-noise,
insensitivity to dust, well-behaved decline-rate corrections, and
simplicity of technology to provide the greatest leverage on the future
cosmological measurements using SNe Ia.
The light curves for SN 2013aa also demonstrate the length of time for
typical SN Ia follow-up.
More specifically, to determine the stretch-factor for the
Phillips-relation, ∆m15, observations must be
sufficient to (i) determine maximum light and (ii) to follow the light
curve beyond 15 days. Both SNe Ia display `ideal' stretch factors of
∆m15 ∼ 1
and, thus, both SNe Ia are `normal' and ideal for use as standard
candles. As is demonstrated for SN 2013aa, the `local' sample is typically
followed with a dense cadence for ∼ 40 days (to detect
the secondary maximum) and then a less dense cadence there after for as
long as the SN Ia can be observed from the ground.
When the SN Ia is no longer detectable from the ground, space-based
photometry can be used to put further constraints on progenitor models;
SN 2011fe in M 101 has been followed 1840 days post its B
maximum (though on months long timescales) and observations are planned
for at least another 600 days
(Shappee et al,
2017).
The discussion of SN 2017cbv and SN 2013aa demonstrates the progress
in the level of SN Ia observations in only a few years.
Dual-hemisphere transient monitoring enabled by robotic, and largely
autonomous, facilities permits early discovery of transient objects.
A large-scale networked international community, enabled with
state-of-the-art data processing tools, can classify a transient event
within a day of its discovery.
Classification, in turn, triggers numerous communities poised for
appropriate follow-up, which for the use of SN Ia for distances requires
photometric monitoring for up to 40 days post-maximum.
2.5. The `local' Sample in Context
The current limitation of SNe Ia as absolute distance indicators is
the calibration of the absolute luminosity of SN Ia. We do not have
theoretical predictions of their peak luminosity because there is still
continuing uncertainty about their exact nature. Thus they have to be
calibrated using other distance indicators, and this is one of the
primary purposes for the modern distance ladder. SNe Ia are calibrated by
Cepheid stars, using the Leavitt Law, which in turn have to be
calibrated to an absolute scale. Currently, the Leavitt law is
determined by using both Cepheids in the Milky Way and in the
Small and
Large Magellanic Clouds. Milky Way Cepheids have
distances measured geometrically from their parallaxies, either by
Hubble Space Telescope or Hipparcos
(van Leeuwen
et al, 2007),
and new Gaia masurements, for a much larger number of stars
(Clementini, 2017)
are now being incorporated into the cosmic ladder. The Leavitt Law in
the Large Magellanic Cloud is anchored by eclipsing
binaries (e.g.
Pietrzynski
et al, 2013).
The statistical error in the distance measurement of a single Cepheid
was estimated to be around 0.3 mag
(Riess et al,
2016).
However, as of
Riess et al
(2016),
there are in total of 19 SNe Ia host galaxies that can be calibrated via
Cepheids and the Leavitt Law. Prior to 2016, there were only eight SN Ia
calibrators, which were (largely) the same SN Ia used in the
HST Key Project
(Freedman et al
2001a).
This implies that roughly ∼ 1 SN Ia suitable for the
calibration sample is discovered per annum, despite SNe Ia comprising
66% of the sample of all bright SNe (see
Holoien et al,
2017a
and references therein). It is of interest to investigate what is
limiting the build-up of the SN Ia calibration sample.
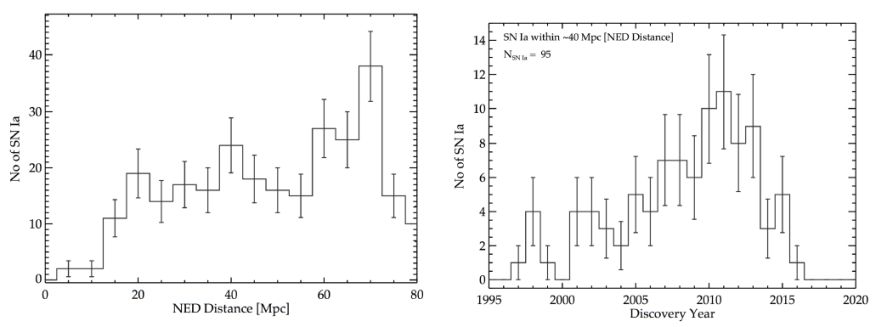
In Figure 4a, the SNe Ia known from the `Recent
Supernova' database
(Gal-Yam et al,
2013)
4
as of March 2016 are binned by the homogenized distance to their host
galaxy from
NASA Extragalactic
Database
(NED;
Steer et al,
2017).
This sample has been cleaned of SN Ia sub-types, but not by extinction
(host galaxy or Galactic foreground) or decline rate.
The average number of SNe Ia within a single 5 Mpc bin is
∼ 20 SNe Ia, which suggests there are 5× more SNe
Ia within the volume accessible to HST Cepheid measurements than
are currently in the calibration sample
(using ∼ 35-40 Mpc as the limiting volume).
Figure 4. 'Local' SNe Ia demographics as
of as of March 01, 2016. (a) Number of normal SNe Ia
discovered since 1995 as a function of the
NED Homogenized
distance for
their host. Error bars show the Poisson uncertainty for each bin. While
there are few SNe Ia within 20 Mpc, the distribution beyond 20 Mpc is
relatively flat. (b) Number of normal SNe Ia discovered per
year since 1995 within 40 Mpc. There are a total of 95 SN Ia using
these distances. This suggests that if primary distance techniques can
push into this volume, a vastly larger number of SNe Ia can be
independently calibrated to study the known biases in the SNe Ia
population.
With the dramatic increase in efficiency for transient follow-up and
classification described above, is it not unreasonable to attribute this
large number entirely to recent discoveries. In
Figure 4b the 95 SNe Ia within 40 Mpc are
binned by their discovery year from 1995 to 2016.
For reference, the ASAS-SN all-sky project has been in operation since 2013
(Holoien et al,
2017d),
but only reached peak efficiency in the latter half of 2015
(Holoien et al,
2017a),
shortly before this data were compiled. From inspection of
Figure 4b, the number of SNe Ia discovered per
annum fluctuates widely, but, in general, the numbers do not trend
strongly with the onset of all-sky monitoring programs (albeit these
programs permit unprecedented early detection; e.g.,
Figure 2).
Analyses of yearly rates over the next few years, however, will be more
informative with programs like ASAS-SN having become dramatically more
efficient(e.g.,
Holoien et al,
2017b).
Of the 95 SN Ia within 40 Mpc, nearly half (∼ 40) have
sufficient photometric data sufficient to be included in the calibration
sample (e.g., similar in spirit to Figure 2;
C. Burns and B. Shappee, priv. communication).
Despite having sufficient data to determine a SN Ia-based distance,
these host galaxies lack robust independently determined distances from
the Cepheid-based distance ladder.
The reason for the lack of independent distances is the unsuitability of
the host galaxy for Cepheid based distances, either due to its star
formation history, an edge-on inclination, or its morphological type.
Thus, utilization of a distance ladder constructed using a standard
candle that can be applied to edge-on and non-star forming galaxies has
the potential to dramatically improve the size of the calibration
sample. Such a distance ladder is explored using old stellar populations in
Beaton et al
(2016),
and these distance methods are described elsewhere in this volume.
As discussed in the following section, expanding the calibration sample
to better reflect the demographics of SNe Ia in the larger, Hubble flow
sample is an important step for further refinement of SNe Ia derived
cosmological parameters.
In principle, the use of multiple calibrators for a single galaxy should
help to control the systematic errors. For example, the use of galaxies
where both SN I and II have been detected would be valuable, but
unfortunately, there are only a few of such galaxies, and they lack
distance determination based on the Tip of the Red Giant Branch (TRGB)
and/or Cepheids. Probably, with the new facilities the number of
galaxies with both SN types and a good distance determination will
increase.
Apart from Cepheids, NGC 4258, an active galaxy with spatially resolved
water maser emission is used as additional distance indicator since this
galaxy is also a host for numerous Cepheids. A combination of four
geometrical distance calibrators
(Riess et al,
2016)
allowed a determination of H0 with 2.4%
uncertainty, and this is the uncertainty currently underlying all
cosmological measurements done with the use of SNe Ia as a systematic
error.
Our discussion of the `local' SNe Ia in NGC 5643 is characteristic of
the attention received by these rare `local' calibrators.
The dramatically larger sample of SNe Ia in the Hubble Flow receive
less attention in their data collection, but represent a much more
complete sample from which to draw inferences on SN Ia as a population.
More specifically, these are usually only monitored for
∼ 20 days to obtain decline rates and may not have
extensive multi-wavelength data or time-resolved spectroscopy.
There are three main sources of systematic uncertainty that hinder the
use of SNe Ia and our understanding of the physical phenomena inferred
from them (adapted from
Hicken et al,
2009):
The large scale programs described earlier are all aimed at addressing
item (1). Item (2) will be discussed in detail later in this volume (see
Section 2.8). The relevant results for item (3) are
summarized in the points to follow.
Multi-SN Ia Systems: There are only two current `local'
galaxies that are host to multiple SN Ia in the modern observation era.
These are NGC 1316, a massive elliptical galaxy in the
Fornax cluster, and NGC 5643, a spiral galaxy (discussed above).
Stritzinger
et al (2010)
used the four events in NGC 1316 and were able to determine that the
three normal SNe Ia provided consistent distances at the 5% level and
demonstrated that the fourth SN Ia, a fast-decliner, was discrepant at
the 25-30% level. The two SNe Ia in NGC 5643
(Figures 2 and
3) will be the first time a test of this nature
can be performed on a late-type host. Moreover, both of these galaxies
are sufficiently local that distances can be derived independent of SNe
Ia to extend such tests in absolute terms (in lieu of differential
analyses).
Intrinsic Scatter: Using early data from the CSP,
Folatelli et
al (2010)
studied the scatter of the best studied SNe Ia in their sample; this
set included 23 SNe Ia with multi-wavelength data similar to that
presented for SN 2013aa in Figure 2.
A scatter of 0.11 mag (5%) in distance was reported.
Folatelli et
al (2010)
noted that the dispersion increased with decreasing distance, which
implies that much of the observed dispersion could be accounted for with
peculiar velocities. They discussed additional reasons for the observed
trends, concluding that many observational and (potential) intrinsic
effects could contribute to the scatter. A deeper analysis using a
larger set of homogeneous data would be beneficial to understand the
intrinsic scatter in SNe Ia magnitudes.
Host Mass Bias:
Sullivan et al
(2010)
find a strong dependence on the mass of the host. Massive galaxies are
systematically brighter by 0.06 to 0.09 mag (3% to 5% in distance; >
3σ difference). Such effects will average out for cosmology if the
distribution of host galaxy masses remains relatively constant in time,
but it is unlikely that this is the case for distant SNe Ia samples.
Local Star Formation Bias:
Rigault et al
(2013)
found a dependence of derived SNe Ia magnitudes as a function of the
local (1 kpc) environment around the SN Ia as probed by Hα surface
brightness. SN Ia in passive (i.e., non-star forming) environments were
found to be brighter by 0.094 ± 0.031 mag (5% in distance), which
is termed the local star formation bias.
Rigault et al
(2015)
revisited this issue using both an independent sample of SN Ia (that of
Hicken et al,
2009)
and using FUV maps to trace the local region.
Rigault et al
(2015)
find that SN Ia in locally star-forming environments are 0.094 ±
0.025 mag (5% in distance) fainter; a 3.8σ difference. If the
Hicken et al
(2009)
sample is isolated to just the most massive hosts, nearly 50% of the SN
Ia arise from locally passive environments.
The local SN Ia calibration sample is almost entirely star-forming
(Rigault et al,
2015,
Riess et al,
2016).
These effects are complicated and may bias attempts to better understand
which galaxies produce SN Ia. More complex modeling as in
Holoien et al
(2017c)
could be of use to disentangle these effects in the
general SN Ia population as well as the continued large-scale study of
detailed SN Ia host demographics (e.g.,
Holoien et al,
2017b
and references therein).
Additional systematic error in SNe Ia measurements may come from weak
lensing effect, particularly for the high redshift sources, above
z = 1.5. Weak lensing causes additional dispersion in the
measured luminosity distances, and the distances are on average
effectively larger.
Hilbert et al
(2011)
estimated that this effect introduces systematic error of about 2% at
redshift 1.5, but the appropriate simulations may allow to reduce this
effect. This applies also to other measurement methods based on standard
candle approach.
Despite their use as cosmological standard candles and their relevance
also for galactic chemical evolution, consensus about the nature of SN
Ia progenitor systems is still lacking, and this may affect their use as
the tracers of the Universe expansion.
Any model for SN Ia progenitors must satisfy a number of observational
constraints. The first obvious ones are the
lack of hydrogen (∆MH < 0.01
M⊙) and helium in the spectra, the
range of values of the peak luminosity and their correlation with the
light curve width, and a total kinetic energy of the ejecta
of ∼ 1051 erg. Our understanding of SN Ia
lightcurves dictates that the peak luminosity is determined by the mass
of radioactive 56Ni, whilst the lightcurve width depend on
the opacity, determined by iron-group elements
like 56Ni, 58Ni, 54Fe. These latter two
elements are non-radioactive and do not contribute to the peak
luminosity. The temporal evolution of the spectra also allows to
reconstruct the radial composition of the ejecta. All these
observations taken together imply the presence of
∼ 0.1-1.0 M⊙ of
56Ni in the ejecta (but very little
in the outer layers), ∼ 0.2-0.4
M⊙ of Si, S, Ca, Ar, and less than 0.1
M⊙ of n-rich isotopes
(54Fe, 58Ni).
It was recognized very early on
(Hoyle and Fowler 1960)
that SN Ia must be thermonuclear explosions in electron degenerate matter,
pointing to exploding white dwarfs (WDs) as the cause of SN Ia
events. Given that single WDs form with masses below the Chandrasekhar
mass and are intrinsically stable objects, their evolution must be
perturbed by a companion in order to cause the required explosion.
Irrespective of the companion and the trigger mechanism, one can firstly
investigate which WD mass+explosion mechanism can be invoked
to explain SN Ia observations (see, e.g., the review by
Röpke et al,
2011).
In terms of WD masses, one can divide the potential progenitors into two
broad classes, namely Chandrasekhar and sub-Chandrasekhar mass progenitors.
In the Chandrasekhar mass scenario a C-O WD in a binary system
approaches the Chandrasekhar mass due to accretion from
the companion, and C-burning reactions set in at the centre when the
density is of the order of 109 g cm3.
After a non-explosive initial 'simmering' phase (see, i.e.,
Lesaffre et al,
2006)
lasting 1000-10000 yr, that burns only a small amount of C, a
thermonuclear runaway starts. The number of ignition sparks of the
burning front and their distribution are unknown and have a significant
impact on the characteristics of the explosion. The best agreement with
observations is achieved considering a combustion front propagating at
first subsonically (deflagration) then supersonically (detonation -
Blinnikov and Khokhlov 1986).
This so-called 'delayed detonation' allows the production of a layer of
intermediate-mass elements that encompasses almost all of the outer
ejecta, as required by observations. The transition from deflagration
to detonation is typically parametrized and not derived from first
principles. Variations of the flame ignition configuration and
transition to detonation can reproduce at least qualitatively the
observed luminosity-decline rate relation
(Kasen et al. 2009).
In the sub-Chandrasekhar mass scenario (see, i.e.,
Woosley and Weaver 1994)
the helium layer that surrounds the CO core increases its mass due to
accretion from the binary companion. When the mass of the He-layer
reaches a critical value, a detonation is triggered by compression. This
detonation burns the He-layer and drives a shock wave into the core,
triggering a detonation of carbon and the explosion of the WD.
In this scenario, a variation of the exploding WD mass could potentially
explain the luminosity-decline rate relation.
There are however problems related to the explosive nucleosynthesis, for
not enough stable Fe and Ni isotopes to match late time spectra are
produced (because of too low densities at explosion), and too
much 56Ni is made in the He-shell ashes
(Röpke et al
2011).
If the mass of the He-layer that detonates is
∼ 0.01M⊙, as possible for WDs
around 1M⊙
(Bildsten et al, 2007),
negligible 56Ni seems to be produced, although other
calculations do not confirm this result
(Röpke et al,
2011).
Both these WD mass+explosion mechanisms put forward to explain SN Ia
events need the presence of a companion in a binary system. We can
traditionally divide the progenitor systems into two broad classes,
namely single-degenerate (SD) and double-degenerate (DD) systems.
In a typical SD system
(Whelan and Iben 1973)
the WD accretes H from a non electron-degenerate companion. Hydrogen is
burned to He first, then to C, and the WD mass increases to the
Chandrasekhar limit. As shown by
Nomoto and Kondo (1991),
stable H-burning is possible only for a finely tuned accretion rate of
around 3 × 10⁻⁷ M⊙
yr−1. Lower rates ( < 10−8
M⊙ yr−1) produce a Nova
event, which expels the ashes of the accreted material and possibly even
some of the original WD material (e.g.
Yaron et al, 2005).
This may not be the case at intermediate rates, where recurrent Novae
systems retain some of the accreted mass (e.g.
Hachisu and Kato 2000).
If the accretion rate is too large, the WD is expected to expand to
giant-like dimensions, and engulf the donor star in a common envelope
which inhibits further accretion onto the WD.
Hachisu et al
(1996)
have proposed that an optically thick wind emerges from the WD
that stabilizes the mass transfer. In this way the mass accretion may
continue, but at a reduced rate. Generally, there is only a narrow range
of accretion rates in which the WD can retain the matter and grow in
mass.
If the non-degenerate companion is a He-star (produced by a previous
common envelope episode) the WD can accrete He leading to either a
Chandrasekhar or a sub-Chandrasekhar explosion (see, i.e.,
Woosley and Kasen 2011,
Piersanti et al, 2014),
depending on the accretion rate. Accretion rates of the order of
≈ 10−8 − 10−9
M⊙ yr−1 lead to a
He-detonation and a sub-Chandrasekhar explosion; in case of rates of the
order of ≈ 10−6 M⊙
yr−1 steady He-burning on the WD surface can
produce a Chandrasekhar mass WD that ignites C in the core.
In a DD system
(Tutukov and Yungelson
1981)
two WDs orbit each other and the system loses energy through
gravitational waves emission. As the two components come closer and
closer, eventually the least massive object fills its Roche-lobe and
mass transfer sets in, with the more massive WD accreting C-O from an
accretion disk/torus. If this WD can reach the Chandrasekhar mass a
delayed-detonation will ensue. It is however uncertain whether this
happens; even in case of a system where the combined mass of the two WDs
exceeds the Chandrasekhar limit, an off-centre carbon deflagration
followed by conversion to an O-Ne-Mg WD seems to be a likely
outcome. Nearing the Chandrasekhar mass the O-Ne-Mg WD undergoes an
electron induced collapse that leads to the formation of a neutron
star. An alternative path that could lead to a SN Ia explosion is a
so-called violent merger (see, i.e.,
Pakmor et al, 2010).
At the merger, an accretion stream can dynamically produce a high
temperature when hitting the WD surface. If high enough, this leads to
the WD explosion according to the sub-Chandrasekhar double-detonation
scenario. This scenario seems however efficient only for systems whose
primary WDs are massive (> 0.8−0.9
M⊙) and the mass ratio is high > 0.8.
Pakmor et al (2013)
find that the presence of helium facilitates the ignition.
Despite the enormous efforts of the astronomical community, there has
not yet been a convincing identification of a SN Ia progenitor
(Li et al, 2011a,
Nielsen et al,
2012).
Furthermore, none of the proposed formation channels are clear matches
to the observational constraints. Due to the uniformity and continuity
of the observed SN Ia properties, there has been a long-time focus to
find a single formation channel to explain all properties. However, from
the diversity and correlations among the spectral properties of SNe Ia
and their host galaxies, it is also possible that some combination of
formation channels is operating.
An advantage to the SD channel is that it naturally explains the
uniformity in luminosities as all WDs explode at the Chandrasekhar mass
in this channel. On the other hand, the masses of the merged remnants in
the DD channel display a broader range ( ∼ 1.4−2.0
M⊙). It is usually assumed that the DD systems
with super-Chandrasekhar masses are responsible for the super-luminous
SN Ia. Another expected signature of the SD channel, is that the
companion is expected to survive the explosion and with an
anomalous velocity, rotation, spectrum or composition.
No such object has been identified unambiguously, for example in Tycho's
SN remnant
(Ruiz-Lapuente et al,
2004,
Kerzendorf et
al, 2009,
Schaefer and
Pagnotta 2012).
Also, any mixing of the SN ejecta with that of the companion star during
the explosion, has not been observed conclusively
(Leonard 2007,
García-Senz et
al, 2012).
In a minority of cases, variable NaD absorption has been detected in the
SN spectra, which has been interpreted as circumstellar material from
the companion in the SD channel
(Patat et al, 2007,
Sternberg et al,
2011).
This signature, however, can also arise in the DD channel from a
post-merger, pre-explosion wind
(Shen et al, 2012).
Furthermore, one expects soft X-ray emission from SD systems produced by
the steady H-burning on the WD surface, but
not enough emission has been observed from resolved nor unresolved sources
(Gilfanov and Bogdán
2010,
Di Stefano 2010).
The emission might be shielded within optically thick outflows and
reprocessed to UV-emission
(Hachisu et al,
2010,
Nielsen et al,
2013,
Wheeler and Pooley
2013),
but so far a population of these sources has not yet been detected
(Woods and Gilfanov
2013,
Lepo and van Kerkwijk
2013).
Lastly, SN 2011fe is a recent and close SN Ia that is well
observed in optical, radio and X-ray wavelengths. These observations
have ruled out most types of donor stars in the SD channel, and
therefore favor a DD progenitor (e.g.
Chomiuk 2013);
see also
Maoz et al (2014)
for a review on the observational clues to the SN Ia progenitor problem.
Additional constraints on the SN Ia progenitor channels are provided by
the observed delay-time-distribution (DTD) of SN Ia events. The DTD is
defined as the time interval between a star formation episode and the
explosion of the related supernovae. It illustrates the distribution in
evolutionary timescales of the SN Ia progenitor, which vary for the
different progenitor scenarios. The DTD has been studied observationally
in a range of surveys, environments and redshifts, and the emerging
picture is remarkably coherent (for a review, see
Maoz and Mannucci
2012).
Type Ia SNe occur in young and in old stellar populations, reaching
delays as long as a Hubble time. The SN Ia rate peaks at short delays of
< 1 Gyr and declines at longer delay times.
The DTD is best described by a power-law with an index of about −1
for delays of 1 < t < 10 Gyr. At shorter delays, there
is still some uncertainty regarding the precise shape of the DTD.
Despite the consistency in the shape of the DTD from a variety of
methods, the normalization or time-integrated DTD
shows variations between rates in different galaxy types. SN Ia rates in
galaxy clusters are found to be a factor ∼ 5 higher
than rates based on volumetric galaxy samples. Further research is
needed to test if this is due to differences in the methods and samples,
or if there is indeed an enhancement of the SN Ia rate in cluster
environments (e.g.
Maoz et al, 2012,
Maoz and Graur
2017).
The DTDs for different progenitor channels have been estimated by
analytical approaches and by modeling the evolution of binary
populations (see
Wang and Han 2012
for a review). For the double degenerate channel, there is a good
agreement on the DTDs (e.g.
Nelemans et al,
2013).
The DD model gives rise to delay times ranging from a few Myr up to a
Hubble time. Within these delay times, the DTD shape is a continuous
power-law with a slope of roughly -1, which is remarkably similar to the
observed DTD. The time-integrated DTD from the DD channel is compatible
with the lower limit of the observed rate. The DTD from double WDs that
undergo a violent merger is similar to that of the classical DD channel
(Ruiter et al,
2013).
For the single degenerate channel, there is a large diversity in the
predicted SN Ia rates spanning over several orders of magnitude (e.g.
Nelemans et al,
2013).
Differences arise due to ill-constrained aspects of binary formation and
evolution, most importantly the accretion efficiency of WDs
Bours et al, 2013
and common-envelope evolution (e.g.
Claeys et al, 2014,
see
Ivanova et al, 2013
for a review). The predicted rates of the SD channel tend to be (far)
below that of the DD channel and the observed rate. Typically, the delay
times from the SD channel range from a few-hundred Myr to a few Gyr. The
models show that SD DTDs have a sharp drop after a few Gyr, in
contradiction with the observed DTD. The drop can be understood by the
limited range of donor masses ( ∼ 2−3
M⊙) that transfer matter to the WD at the
necessary rates to ensue WD mass growth.
If the donor star is a He-star, the delay times are very short
i.e. ∼ 50-200Myr
(Wang et al, 2009),
due to the fact that He-stars evolve from more massive main-sequence
stars with shorter evolutionary timescales than in the standard SD
channel.
An adaptation to the SD channel has been proposed that resolved some of
the observationally discrepant signatures. In the so-called
'spin-up/spin-down'-model
(Justham 2011,
Di Stefano et al,
2011),
WD rotation due to accretion onto the WD is invoked to support against
the collapse and ignition of the WD. The time that it takes for the WD
to spin down and explode leads to a prolonged delay time. This may solve
the issue that the classical SD progenitors do not have long delay times
that are observed. Furthermore, if the timescale for spin down is
sufficiently long, any traces of the mass transfer and even the
companion could disappear. Lastly, the 'spin-up/spin-down'-model also
allows for the possibility of super-Chandrasekhar SN Ia.
2.8. Extinction/Color Corrections for Type-Ia
Supernovae
A common perception exists that the dominant parameter driving the
standardization of SNe Ia for measuring distances
is related to the decline-rate or light-curve shape
(Phillips 1993,
Riess et al, 1995,
Hamuy et al, 1996,
Perlmutter et
al, 1997).
However,
corrections based on the color of the SN Ia are at least as important
(Riess et al,
1996,
Phillips et al,
1999).
A variety of approaches has been used for this correction, and these
differences ultimately relate to the cause of color variations in SN Ia,
something that has been difficult to pin down.
All SN Ia luminosity distance measurements must correct for extinction
by dust in the Milky Way, typically using the dust maps of
Schlegel et al
(1998),
or more recently,
Schlafly and
Finkbeiner (2011),
to provide an estimate of the reddening E(B −
V)MW along the line of sight. This reddening is
converted into an extinction in the observed passbands using the dust
law of
Cardelli et al
(1989),
with updates from
O'Donnell
(1994) and
Fitzpatrick
and Massa (2007),
typically assuming an extinction law parameter RV
≈ 3.1 as found in the diffuse ISM. Care must be taken to account
for the time-evolving spectral energy distribution (SED) of the
supernova. Uncertainties in the Milky Way extinction correction are
correlated across all observations of an individual supernova, and
systematic uncertainties in the Milky Way extinction correction can
have important effects on parameter inferences from a supernova
sample. Nonetheless, hereafter we discuss SN Ia extinction or color
corrections under the assumption that the Milky Way component has been
properly removed.
In analogy to Milky Way extinction, the light from distant SN Ia is
extinguished by dust in the supernova host galaxy (which acts on the
rest-frame light in contrast to the Milky Way extinction which acts
after the light has been redshifted to the observer frame). One
approach to this correction is to assume that the intrinsic colors (or
SED) of a SN Ia are strictly determined by its light curve shape,
i.e. that SN Ia are intrinsically a one-parameter family. Color
variation among SN Ia is then ascribed to intrinsic stochasticity
(random scatter around the nominal color) and extrinsic reddening by
host-galaxy dust. This is the approach used by the Multicolor Light
Curve Shape method
(Riess et al,
1996,
Riess et al,
1998b)
and as extended to MLCS2k2
(Jha et al, 2007),
as well as adaptations of the ∆m15 method
(Phillips et
al, 1999,
Burns et al,
2011).
Even if the intrinsic SN Ia light curves are described with a more complex
parameterization, extrinsic host-galaxy extinction can be treated
separately, as in the BayeSN methodology
(Mandel et al,
2011).
Applying this method gives a surprise: Hubble diagram residuals are
minimized when the ratio between the inferred
extinction AV and color excess E(B
− V) has a value RV ≈
1-2, significantly lower than the canonical RV
≈ 3.1 (e.g.,
Conley et al,
2007).
This could be interpreted as saying the typical
dust in SN Ia host galaxies has smaller grains on average than Milky
Way dust, with significantly more reddening for a given amount of
extinction.
Indeed, we find strong evidence for "weird" low-RV dust in
heavily extinguished SN Ia (e.g., host reddening
E(B − V) ≥ 1
mag). This has been inferred using near-UV through near-infrared
observations of reddened objects like SN 1999cl, 2002cv,
2003cg, 2006X, and SN 2014J
(Elias-Rosa et al,
2006,
Elias-Rosa et al,
2008,
Krisciunas et
al, 2006,
Krisciunas et
al, 2007,
Wang et al, 2008b,
Burns et al, 2014,
Amanullah et
al, 2014,
Amanullah et
al, 2015,
Foley et al, 2014,
Brown et al,
2015b,
Gao et al, 2015).
Independent, corroborating evidence comes from linear
polarization measurements; dust scattering imprints a wavelength
dependence to the continuum polarization fraction that reflects the
grain size distribution and RV. For several of these
heavily-reddened objects, the wavelength of the continuum polarization
peak implies RV ≲ 2
(Kawabata et
al, 2014,
Patat et al,
2015).
An intriguing possibility is that this strange dust is located near
the supernova, in the circumstellar environment of the progenitor
system, perhaps with multiple scattering playing a role
(Wang 2005,
Goobar 2008,
Foley et al,
2014).
This could help explain why such dust
is not evidently seen in the Milky Way ISM, for example. Indeed, some
of these heavily-reddened SN Ia show time-variable absorption lines
(Na I D, K I) in high-resolution spectra, interpreted as arising from
circumstellar gas interacting with the SN radiation field
(Patat et al, 2007,
Blondin et al,
2009,
Graham et al,
2015).
However, the preponderance of the evidence suggests this
low-RV dust is interstellar. Many of these SN
Ia show light echoes, with dust sheets > 10 pc away from the supernova
(i.e., not circumstellar
Wang et al, 2008a,
Crotts and
Yourdon 2008,
Crotts 2015,
Maeda et al, 2015,
Yang et al, 2017).
Moreover, the dust seems to correlate best with diffuse interstellar
bands (DIBs) rather than circumstellar gas absorption
(Phillips et al. 2013)
and moreover, for SN 2014J most of the gas absorption originates on
interstellar, not circumstellar scales
(Ritchey et al,
2015,
Jack et al, 2015,
Maeda et al,
2016).
Because of the difficulties in arriving at a physical understanding of
the relationship between the observed luminosity and color of SN Ia, a
leading approach is to make this an entirely empirical correction,
analogous to the light curve shape correction.
Tripp and Branch
(1999)
suggested a simple two-parameter empirical correction, with the SN Ia
B-band luminosity linearly regressed against a light curve shape
parameter and a color parameter. The SALT/SALT2
(Guy et al, 2005,
2007)
and SiFTO
(Conley et al,
2008)
light curve fitters adopt this
model. The single color coefficient (called β in these models)
is again found to be significantly lower (β ≈ 2.5) than
what would be expected by standard dust
(RV = 3.1 ↔ β = 4.1).
These fitters are aimed primarily at cosmological SN Ia samples,
i.e. objects typically with low extinction, not the heavily reddened
SN Ia for which there is more direct evidence of unusual
dust. Thus, it is not clear whether the low values of β in
cosmological samples arise from the same kind of unusual dust (just
less of it). For example, measurement uncertainties would lead to
color "noise" that was uncorrelated to SN luminosity; if this noise
level were comparable to the dust reddening (typically E(B
− V) ≤ 0.3 mag for these "cosmological" objects),
the effective (observed) value of β would be lowered
(della Valle
and Panagia 1992).
Similarly, if the SN Ia had intrinsic color variations, perhaps
also correlated to luminosity with some βintrinsic, the
effective β would be intermediate compared to βdust
(Mandel et al,
2016).
There is positive evidence that intrinsic color variations and the
error model for SN Ia colors may be playing a role. By using
spectroscopic indicators that are independent of color (line
equivalent widths or velocities), it is possible to ascribe an
intrinsic color to an individual SN Ia, and thus determine the color
excess (observed minus intrinsic). Correlating the SN Ia luminosity
against this color excess (rather than the observed color) yields an
extinction law consistent with normal dust (RV
≅ 3; β ≅ 4,
Chotard et al,
2011,
Foley and
Kasen 2011,
Foley et al, 2011,
Sasdelli et al,
2016)
for low-extinction objects. Similarly,
an intrinsic variation "color-smearing" model, combined with a
normal dust law, can explain the luminosity-color relation and its
scatter better than a single linear model can
(Scolnic et al,
2014,
Mandel et al,
2016).
Nonetheless, strange (strongly-reddening, low-RV) dust
is still necessary for highly-reddened SNe Ia
(Mandel et al,
2011).
The emerging picture to explain the relationship between SN Ia
luminosity and color has grown quite complex, including intrinsic
color variations that may depend on light-curve shape, spectral
features, or even host galaxy environment, normal Milky Way-like dust
(in the SN host galaxy and in the Milky Way), and strange, likely
interstellar but possibly also circumstellar, low-RV
host-galaxy dust. Achieving the most precise and accurate distances from
SN Ia will require modeling and disentangling all of these effects, and
perhaps more. These effects are likely to be more severe for
high-redshift SN Ia science, for which there might be significant
evolution relative to the Hubble-flow sample, and less severe in
measuring H0 from SNe Ia, where the calibrator sample
is better-matched. For example, using SNe Ia as near-infrared standard
candles, less sensitive to extinction corrections than in the optical,
does not significantly changed the derived value of H0
(Dhawan et al,
2017).
Future discoveries with SN Ia cosmology are now built on a framework of
large-scale, homogeneous follow-up that unite teams that (i) find, (ii)
classify, and then (iii) characterize the SN Ia.
There are differences in the follow-up for the `local' sample of SN Ia,
which are ultimately used to set the SN Ia absolute luminosity, those SN
Ia discovered in the Hubble Flow (to z ∼ 0.1), which are
used to determine the Hubble constant, and those found at higher
redshifts, which are used for understanding the acceleration of the
Universe. The low-redshift samples, however, remain the lens for
understanding the physics of SN Ia and projecting that back in time; of
key interest being how SN Ia properties may evolve with the decreasing
progenitor metallicity over cosmic time and the apparent star-formation
biases. Thus, further development of the `local' sample and bolstering
of the low-redshift sample remains as critical as the original questions
posed by
Shapley (1919)
as to the size of the Universe.
1 See also
Holoien et al
(2017d)
and
Holoien et al
(2017b)
for the 2013-2014 and 2016 statistics, respectively
Back.
2 Available:
http://www.rochesterastronomy.org/snimages/
Back.
3 Available:
https://sne.space/
Back.
4 Available
http://www.rochesterastronomy.org/supernova.html
Back.