Copyright © 2011 by Annual Reviews. All rights reserved
| Annu. Rev. Astron. Astrophys. 2011. 49:409-470
Copyright © 2011 by Annual Reviews. All rights reserved |


In this section we review briefly the physics underlying multiwavelength observations of galaxy clusters. We summarize efforts to construct cluster catalogs, with an emphasis on surveys that have led to cosmological constraints. We discuss techniques used to measure the masses of clusters, and observable proxies that correlate tightly with mass.
3.1. Multiwavelength Measurements of Galaxy Clusters
Most of the baryons in the Universe are in diffuse gas. Typically, this gas is very difficult to observe. Within galaxy clusters, however, gravity squeezes the gas, heating it to virial temperatures of 107 – 108 K, which causes it to shine brightly in X-rays. Galaxy clusters therefore ‘light up’ at X-ray wavelengths as luminous, continuous, spatially-extended sources (Figure 7).
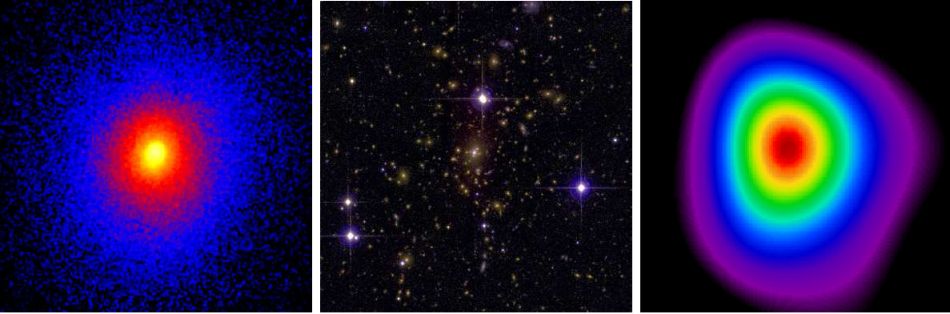 |
Figure 7. Images of Abell 1835 (z = 0.25) at X-ray, optical and mm wavelengths, exemplifying the regular multi-wavelength morphology of a massive, dynamically relaxed cluster. All three images are centered on the X-ray peak position and have the same spatial scale, 5.2 arcmin or ∼ 1.2Mpc on a side (extending out to ∼ r2500; Mantz et al. 2010a). Figure credits: Left: X-ray: Chandra X-ray Observatory/A. Mantz; Center, Optical: Canada France Hawaii Telescope/A. von der Linden et al.; Right, SZ: Sunyaev Zel’dovich Array/D. Marrone. |
The primary X-ray emission mechanisms from the diffuse ICM are collisional: free-free emission (bremsstrahlung); free-bound (recombination) emission; and bound-bound emission (mostly line radiation). The emissivities of these processes are proportional to the square of the electron density, which ranges from ∼ 10−1 cm−3 in the centers of bright ‘cool core’ clusters to ∼ 10−5 cm−3 in cluster outskirts. At these low densities, the X-ray emitting plasma is optically thin and in the coronal limit, which makes modeling straightforward.
For survey observations, the primary X-ray observables are flux, spectral hardness and spatial extent. Using deeper, follow-up observations of individual clusters, modern X-ray satellites allow the spatially-resolved spectra of clusters to be determined precisely, permitting measurements of the density, temperature and metallicity profiles of the ICM, and a host of derived thermodynamic quantities. For reviews of the principles underlying X-ray observations of clusters see, e.g., Sarazin (1988) and Böhringer & Werner (2010).
3.1.2. OPTICAL AND NEAR INFRARED OBSERVATIONS
The optical and near-IR emission from galaxy clusters is predominantly starlight. The galaxy populations of clusters are dominated by ellipticals and lenticulars (i.e. early-type galaxies). This is particularly true in the central regions, where the largest and most luminous galaxies are found (Figure 7).
The old and relatively homogeneous nature of their stellar populations leads to the majority of the galaxies in clusters occupying relatively tight loci in color-magnitude diagrams (e.g. Bower, Lucey & Ellis 1992). This characteristic has proved important to modern cluster finding algorithms.
For optical surveys of clusters, the main observables are the richness (i.e. the number of galaxies within the detection aperture), luminosity and color. For follow-up observations of individual clusters, aimed in particular at measuring their masses, the primary observables are the galaxy number density, luminosity, and velocity dispersion profiles. Typical velocity dispersions for large clusters are of order 1000 km s−1.
For reviews of optical studies of galaxy clusters including discussions of the development of the field, see Bahcall (1977) and Biviano (2000).
As CMB photons pass through a galaxy cluster they have a non-negligible chance to inverse Compton scatter off the hot ICM electrons. This scattering boosts the photon energy and gives rise to a small but significant frequency-dependent shift in the CMB spectrum observed through the cluster known as the thermal Sunyaev-Zel’dovich (hereafter SZ or tSZ) effect (Sunyaev & Zeldovich 1972). The magnitude of the effect is proportional to the line of sight integral of the product of the gas density and temperature. The kinetic SZ (kSZ) effect is an additional, smaller distortion of the CMB spectrum due to the peculiar motion of a cluster with respect to the Hubble Flow (i.e. the CMB rest frame). The magnitude of the kSZ effect is proportional to the peculiar velocity. For a review see Carlstrom, Holder & Reese (2002).
According to general relativity, the gravity associated with a mass concentration will bend light rays passing near to it in a phenomenon known as gravitational lensing. This can both magnify and distort the images of background galaxies. With modern data, gravitational lensing can be detected clearly in the statistical appearance of background galaxies observed through clusters (weak lensing), and in the field (often termed cosmic shear). Occasionally, lensing can also lead to strong distortions and multiple images of individual sources (strong lensing). For a galaxy cluster and background galaxies of known redshifts, the measured gravitational shear can be used to infer the cluster mass. For a recent review of gravitational lensing, see Bartelmann (2010).
3.2. Constructing Cluster Catalogs
A well-designed cluster survey should meet requirements in terms of angular scale, flux sensitivity and redshift coverage. The survey should be as complete (i.e. not have missed clusters that it should have detected) and pure (i.e. not have detected spurious clusters) as possible and the selection function describing the completeness and purity as a function of signal, position and redshift should be known precisely. The survey observables should correlate as tightly as possible with mass. In tension with these requirements, surveys must also be constructed within the context of limited resources.
X-ray observations currently offer the most mature and powerful technique for constructing cluster catalogs. The primary advantages of X-ray surveys are their exquisite purity and completeness, and the tight correlations between X-ray observables and mass.
Galaxy clusters are simple to identify at X-ray wavelengths, being the only X-ray luminous, continuous, spatially extended, extragalactic X-ray sources. Clusters have typical soft X-ray band luminosities of 1044 erg/s or more, and spatial extents of several arcmin or larger, even at high redshifts. Given modest angular resolution, e.g. Δθ ∼ 1 arcmin (full width half maximum, FWHM; easily achievable) and tens of detected counts, the X-ray emission from galaxy clusters can be detected against a background populated otherwise only sparsely with point-like active galactic nuclei.
The first X-ray cluster catalogs constructed for cosmological work (Edge et al. 1990, often called the ‘Brightest 50’ or B50 catalog; Gioia et al. 1990) were based on the Ariel V and HEAO-1 all-sky surveys, and pointed observations made with the Einstein Observatory and EXOSAT (see also Lahav et al. 1989). These catalogs provided early evidence for evolution in the X-ray luminosity function of clusters (Edge et al. 1990; Gioia et al. 1990; Henry et al. 1992) and were used subsequently in a series of pioneering cosmological works (e.g. Henry & Arnaud 1991; Viana & Liddle 1996; Kitayama & Suto 1996; Henry 1997; Eke et al. 1998).
These catalogs were eventually superseded by surveys carried out with the ROSAT satellite. This mission, launched in June 1990, had two main parts: the ROSAT All-Sky Survey (RASS; Voges et al. 1999), spanning the first 6 months; and pointed observations, which took place over the next 8 years. The main instrument aboard ROSAT, the Position Sensitive Proportional Counter, had a modest point spread function (PSF; ∼ 1 arcmin FWHM in survey mode), but low background and a wide field of view (∼ 2 degree diameter).
The main cluster catalogs constructed from the RASS and used in cosmological studies include the ROSAT Brightest Cluster Sample (BCS; Ebeling et al. 1998), which covered the northern hemisphere at high Galactic latitudes and low redshifts (z < 0.3) to a flux limit of 4.4 × 10⁻¹² erg cm−2 s−1(0.1–2.4 keV); the ROSAT-ESO Flux-Limited X-ray Galaxy Cluster Survey (REFLEX; Böhringer et al. 2004), which covered the southern sky at low redshifts to a flux limit of 3.0 × 10⁻¹² erg cm−2 s−1 in the same band; the HIFLUGCS sample (Reiprich & Böhringer 2002) of the X-ray brightest clusters at high Galactic latitudes, with FX > 2.0 × 10⁻¹¹ erg cm−2 s−1(0.1–2.4keV); and the Massive Cluster Survey (MACS; Ebeling et al. 2010), which extended this work to higher redshifts 0.3 < z < 0.5 and slightly fainter fluxes FX > 2.0 × 10⁻¹² erg cm−2 s−1. Other cluster surveys have been constructed from the RASS, or are in the process of being constructed, but have not yet been used to derive rigorous cosmological constraints.
A number of X-ray cluster catalogs have also been constructed based on serendipitous discoveries in the pointed phase of the ROSAT mission. Notable among these are the ROSAT Deep Cluster Survey (RDCS; Rosati et al. 1998) and the 400 Square Degree ROSAT PSPC Galaxy Cluster Survey (400d; Burenin et al. 2007), which have been used to derive cosmological constraints. These catalogs cover much smaller areas than the RASS, but reach an order of magnitude or more fainter in flux (Figure 8).
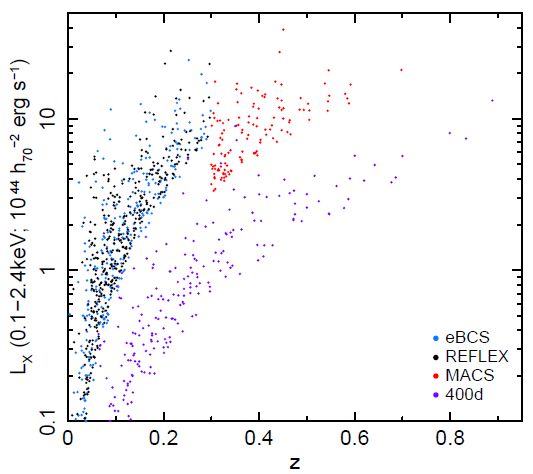 |
Figure 8. X-ray luminosities and redshifts for four ROSAT cluster catalogs – extended BCS (blue; Ebeling et al. 1998; 2000), REFLEX (black; Böhringer et al. 2004), MACS (red; Ebeling, Edge & Henry 2001; Ebeling et al. 2007; 2010), and 400d (purple; Burenin et al. 2007) – sub-samples of which have been used in cosmological studies. |
A second major advantage of X-ray surveys is the observed strong correlation between X-ray luminosity and mass across the entire flux and redshift range of interest. These quantities follow a simple power law relation (Section 4.1.3), with a dispersion in luminosity at a given mass of ∼ 40% and no significant outliers (Mantz et al. 2010a). The density-squared dependence also makes the X-ray survey signal from clusters relatively insensitive to projection effects. Thus, an X-ray survey of sufficient depth can be translated straightforwardly into statistical knowledge of the distribution of massive halos.
In principle, X-ray surveys could be constructed using even lower-scatter mass proxies (Section ) such as temperature or center-excised luminosity as the survey observable. However, given the ease and depth to which total X-ray luminosity can be measured, these lower-scatter mass proxies are typically used as auxiliary data (e.g. Mantz et al. 2010b; Wu, Rozo & Wechsler 2010).
The primary disadvantage of X-ray cluster surveys is that they can only be carried out from space, which makes their construction relatively expensive.
The first extensive cluster catalog was constructed at optical wavelengths by George Abell (Abell 1958) based on visual inspection of photographic plates from the Palomar Observatory Sky Survey. Abell identified clusters as concentrations of 50 or more galaxies in a magnitude range m3 to m3+2 (where m3 is the magnitude of the third brightest cluster member) and radius Ra = 1.5 h−1 Mpc (with distance estimated based on the magnitude of the tenth brightest galaxy). Clusters were further characterized into richness and distance classes. Abell's catalog was updated and extended to the southern sky by Abell, Corwin & Olowin (1989) (hereafter ACO). The final ACO sample has more than 4000 clusters. An additional, early optical cluster catalog extending to poorer systems was compiled by Zwicky and collaborators (see e.g. Zwicky, Herzog & Wild 1961), although the search criteria were less strict than Abell's.
Huchra & Geller (1982) applied a percolation algorithm to an early CfA redshift catalog to identify a set of 92 nearby groups and clusters. Using 4-m class telescopes and a mix of photographic plate and CCD observations, Gunn, Hoessel & Oke (1986) opened high redshift cluster studies by identifying 418 systems over ∼ 150 deg2 extending out to z = 0.92. Spatial and photometric matched filter methods (e.g., Postman et al. 1996) as well as the introduction of N-body simulations to calibrate projection effects (e.g., van Haarlem, Frenk & White 1997) marked the beginning of the modern era of optical cluster cosmology.
Because the cores of galaxy clusters are dominated by red, early-type galaxies, an effective way to reduce the impact of projection effects is to use color information to select for overdensities of red galaxies (e.g., Gladders & Yee 2005 and references therein). The Red-Sequence Cluster Survey (RCS), a sample of 956 clusters identified with a single (Rc − z′) color, provided the first modern cosmological constraints using optical selection (Gladders et al. 2007).
To cover a broad range of redshifts, multi-color photometry is needed to track the intrinsic 4000 angstrom break feature of old stellar populations as it reddens. The five-band photometry of the Sloan Digital Sky Survey (SDSS) enabled such selection. The maxBCG catalog (Koester et al. 2007) of 13,823 clusters with optical richness Ngal ≥ 10 was produced using g − r colors and spans the redshift range 0.1 < z < 0.3. Cosmological constraints from this sample (Rozo et al. 2010) are discussed below. Recently, larger SDSS clusters samples have become available, identified using photo-z clustering (Wen, Han & Liu 2009), a Gaussian mixture modeling extension of the maxBCG method (Hao et al. 2010), and an adaptive matched filtering approach (Szabo et al. 2010). These catalogs contain between 40000 and 69000 clusters spanning z ≲ 0.6, and cover roughly 8000 deg2 of sky.
A primary challenge to cosmological analysis using such catalogs is the definition of robust mass proxies that possess minimal and well-understood scatter across the full mass and redshift ranges of interest. Projection of filamentary structures and small groups along the line of sight has a greater impact on optical cluster catalogs than X-ray, and these effects introduce a degree of skewness into the mass-observable relations (Cohn et al., 2007). Uncertainty in modeling this and other selection effects currently limits the constraining power offered by the large sample sizes of optical cluster catalogs.
The first large catalogs of galaxy clusters selected from observations of the SZ effect are currently under construction, using measurements made with the South Pole Telescope (SPT; Vanderlinde et al. 2010; Carlstrom et al. 2011), the Atacama Cosmology Telescope (ACT; Kosowsky 2006; Marriage et al. 2010) and the Planck satellite (Bartlett et al. 2008; Planck Collaboration 2011a). The primary advantage of SZ surveys is that, in contrast to X-ray and optical measurements, the SZ signal of a cluster does not undergo surface brightness dimming. SZ surveys are therefore well-suited, in principle, to searches for massive clusters at high redshifts. The surveys mentioned above are each expected to produce catalogs of hundreds of massive systems at intermediate-to-high redshifts. Challenges for these projects include determining the optimal observables (i.e. the best mass proxies) to measure from the survey data in the current, low signal-to-noise ratio regime; calibrating the mass scaling for these observables; and understanding in detail the impact of contamination by radio and infrared sources (Sehgal et al. 2010). Projection effects are also expected to be more significant for SZ surveys than for X-rays (Shaw, Holder & Bode 2008).
3.3. Mass Measurements and Mass Proxies
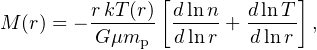
Accurate measurements of cluster masses provide a cornerstone of cosmological work. X-ray mass measurements are based on the assumption of hydrostatic equilibrium (HSE) in the ICM. For a spherically symmetric system in HSE, the measured gas density and temperature profiles can be related to the total mass (e.g. Sarazin 1988),
 |
(22) |
where M(r) is the mass within radius r, T(r) is the ICM temperature, n(r) is the gas particle density, G is Newton's constant, k is the Boltzmann constant, and µ mp is the mean molecular weight. Note that the mass within radius r depends more strongly on the temperature than the density at that radius.
Hydrostatic equilibrium requires that the gravitational potential remain stationary on a sound crossing time; that all motions in the gas be subsonic; and that forces other than gas pressure and gravity are unimportant. The hydrostatic method can therefore not be applied robustly to systems undergoing major merger events, nor to regions of otherwise relaxed clusters where these assumptions break down, e.g. in their central regions where strong AGN feedback effects are commonly observed (Fabian et al. 2003; Forman et al. 2005; McNamara & Nulsen 2007).
Out to intermediate radii, measurements of the gas temperature and density profiles with Chandra or XMM-Newton are straightforward. At large radii (r ≳ r500), however, where the X-ray emission is faint, such measurements become challenging. Recent advances in this regard have been made with the Suzaku satellite, and opportunities for additional progress remain (Section 6.3). Potentially increased levels of non-thermal pressure support (e.g., Nagai, Vikhlinin & Kravtsov 2007; Pfrommer et al. 2007; Mahdavi et al. 2008) and gas clumping (Simionescu et al. 2011) can also complicate measurements at large radii.
A number of approaches have been used in implementing the hydrostatic method. The most common, which employs relatively strong priors, uses parameterized fits to the observed, projected surface brightness and temperature profiles; these are then used to calculate the appropriate partial derivatives at each radius to determine the mass profile (e.g., Cavaliere & Fusco-Femiano 1976; Jones & Forman 1984; Pratt & Arnaud 2002; Vikhlinin et al. 2006). A second, arguably preferable, approach employs a non-parametric deprojection of the brightness and temperature data, but assumes that the mass distribution follows a well-motivated parameterized form (e.g. Equation 15; Allen, Ettori & Fabian 2001, Schmidt & Allen 2007); this approach simultaneously provides a framework for testing the validity of various mass models. In the case of very high quality X-ray data, a fully non-parametric deprojection of the surface brightness and temperature data can be employed, without additional, regularizing assumptions (e.g., Nulsen, Powell & Vikhlinin 2010).
X-ray mass measurements are relatively insensitive to triaxiality (Gavazzi 2005). For dynamically relaxed clusters, and for measurements out to intermediate radii, simulations indicate that hydrostatic X-ray masses should exhibit modest scatter ( ≲ 10%) and be biased low by ∼ 10−15% (e.g., Evrard 1990; Nagai, Vikhlinin & Kravtsov 2007; Meneghetti et al. 2010), due primarily to kinetic pressure arising from residual gas motions.
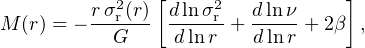
Like the X-ray method, optical-dynamical mass measurements are based on the assumption of dynamical equilibrium, with the galaxies used as test particles in the cluster. The mass enclosed within radius r is given by the Jeans equation (e.g., Binney & Tremaine 1987; Carlberg, Yee & Ellingson 1997)
 |
(23) |
Where ν(r) is the galaxy number density, σr(r) the 3-dimensional velocity dispersion, and β the velocity anisotropy parameter. These quantities can be determined under model assumptions from the projected galaxy number density and velocity dispersion profiles.
An advantage of the optical dynamical method over the X-ray method is that it is insensitive to several forms of non-thermal pressure support that affect X-ray mass measurements (e.g. magnetic fields, turbulence, and cosmic ray pressure). The galaxy population can also be observed at high contrast out to large radii. However, where the X-ray gas is a collisional fluid that returns rapidly to equilibrium following a disruption, the galaxies are collisionless and relax on a longer timescale (White, Cohn & Smit 2010). Whereas X-ray mass measurements are relatively insensitive to triaxiality, the galaxy velocity anisotropy must be accounted for. The precision of optical dynamical measurements is also limited by the finite number of galaxies. While identifying the center of a cluster is straightforward at X-ray wavelengths, at optical wavelengths this can be a source of significant uncertainty.
The infall regions of clusters form a characteristic trumpet-shaped pattern in radius-redshift phase-space diagrams, the edges of which are termed caustics. The identification of these caustics enables mass measurements out to larger radii (up to 10 h−1 Mpc), to an accuracy of ∼ 50% (e.g., Rines & Diaferio 2006).
In contrast to X-ray and optical dynamical methods, gravitational lensing offers a way to measure the masses of clusters that is free of assumptions regarding the dynamical state of the gravitating matter (Bartelmann 2010). Weak lensing methods have an important role in cosmological work: while triaxiality is expected to introduce scatter in individual (deprojected) mass measurements at the level of tens of per cent (Corless & King 2007; Meneghetti et al. 2010), for statistical samples of clusters and using suitable mass estimators, working over optimized radial ranges and with good knowledge of the redshift distribution of the background population, weak lensing measurements are expected to provide almost unbiased results on the mean mass (Clowe, De Lucia & King 2004; Corless & King 2009; Becker & Kravtsov 2010.
The most common technique employed in weak lensing mass measurements is fitting the observed, azimuthally-averaged gravitational shear profile with a simple parameterized mass model (e.g., Hoekstra, 2007). Stacking analyses of clusters detected in survey fields have also proved successful in calibrating the mean mass–observable scaling relations down to relatively low masses (e.g., Johnston et al. 2007; Rykoff et al. 2008; Leauthaud et al. 2010).
Strong lensing enables precise measurements of the projected masses through regions enclosed by gravitational arcs. In combination with weak lensing, strong lensing constraints can improve significantly the absolute calibration of projected mass maps (e.g., Bradac et al. 2005; Bradac et al. 2006; Meneghetti et al. 2010). Deprojected strong lensing measurements are particularly sensitive to triaxiality (e.g., Gavazzi 2005; Oguri et al. 2005). Nonetheless, detailed strong lensing studies of small samples of highly relaxed clusters have reported mass measurements in good agreement with X-ray results (e.g., Bradac et al. 2008a; Newman et al. 2009; 2011).
Some recent works have used clusters with multiple systems of strongly-lensed arcs to constrain the geometry of the Universe (Jullo et al., 2010 and references therein). This approach is related to the shear ratio test also discussed for weak lensing measurements with clusters (Taylor et al., 2007).
A good mass proxy should be straightforward to measure and correlate tightly with mass, exhibiting minimal dispersion across the mass and redshift range of interest. Robust, low-scatter mass proxy information for just a small fraction (appropriately selected) of the clusters in a survey can boost significantly its constraining power with respect to self-calibration alone (e.g., Mantz et al. 2010b; Wu, Rozo & Wechsler 2010).
The total X-ray luminosity has an intrinsic dispersion at fixed mass of ∼ 40% (Mantz et al. 2010a; Vikhlinin et al., 2009a). The scatter in optical richness at fixed mass for the MaxBCG catalog is also ∼ 40%, with a modest inferred non-Gaussian tail toward low masses (Rozo et al. 2010). The scatter in the projected, integrated SZ flux at fixed mass is expected to be somewhat smaller (20−30%; Hallman et al., 2007; Shaw, Holder & Bode 2008), although this is yet to be measured robustly from data. (Note that the scatter in the observed, projected SZ flux is significantly larger than for the predicted, intrinsic signal; Figure 4.) Since total X-ray luminosity, optical richness and integrated SZ flux are all survey observables, their scatter versus mass tends to play a significant role in tests based on cluster counts even when more precise mass measurements for a fraction of the clusters are available from follow-up data.
Although not the basis for cluster surveys, other observables that correlate tightly with mass can provide powerful mass proxies. For the most massive clusters, the X-ray emitting gas mass is strongly correlated with total mass, with an observed scatter < 10% at fixed mass (Allen et al. 2008). The X-ray temperature, and the product of gas mass and temperature (YX = kT Mgas), have observed scatters ≲ 15% (e.g. Arnaud, Pointecouteau & Pratt 2007; Vikhlinin et al. 2009a; Mantz et al. 2010a); it is thought that the tightness of the YX – M relation may extend to lower masses than for either the TX – M or Mgas – M relations (Kravtsov, Vikhlinin & Nagai 2006). Center-excised X-ray luminosity also traces mass extremely well, with an observed scatter < 10% (Mantz et al. 2010a; see Section 6.4). Weak lensing mass measurements exhibit larger scatter (tens of per cent). However, the minimal predicted bias in the mean mass for statistical samples of lensing measurements (Section 3.3.3) makes the combination with X-ray measurements particularly promising.
While the relation between the three-dimensional dark matter velocity dispersion and mass is predicted to be tight (Evrard et al. 2008), velocity anisotropy and projection effects cause the one-dimensional velocity dispersion to exhibit larger scatter (10−15%, implying a scatter in mass at fixed velocity dispersion of ∼ 40%; White, Cohn & Smit 2010). The relationship between galaxy and dark matter velocity dispersion, the velocity bias, also remains uncertain.