Copyright © 2011 by Annual Reviews. All rights reserved
| Annu. Rev. Astron. Astrophys. 2011. 49:409-470
Copyright © 2011 by Annual Reviews. All rights reserved |


6.1. Cluster Surveys on the Near and Mid-Term Horizons
In the near future (over the next 2–3 years), the completion of the SPT, ACT and Planck SZ catalogs will extend our detailed, statistical knowledge of galaxy clusters out to z > 1. Together, these projects expect to find ∼ 1000 new clusters, mostly at intermediate-to-high redshifts (Marriage et al. 2010; Vanderlinde et al. 2010). Used in combination with existing low-redshift X-ray and optical catalogs, they should provide significant improvements in our knowledge of cluster growth, and corresponding improvements in the constraints on dark energy and gravity models. As discussed in Section 3.2.3, challenges for these surveys will be defining and calibrating the optimal survey mass proxies, and understanding the impact of contamination from associated infrared sources and AGN. Looking further ahead, the development of experiments with improved spatial resolution, expanded frequency coverage and improved sensitivity, such as the Cerro Chajnantor Atacama Telescope (CCAT), will be of advantage.
At optical and near-infrared wavelengths, a suite of powerful, new ground-based surveys are about to come on-line. These include the Panoramic Survey Telescope and Rapid Response System (Pan-STARRS); the Dark Energy Survey (DES); the KIlo-Degree Survey (KIDS) and complementary VISTA Kilo-degree INfrared Galaxy survey (VIKING); the Subaru Hyper Suprime-Cam survey (HSC); and, later, the Large Synoptic Survey Telescope (LSST). These experiments offer significant potential for finding clusters, and will provide critical photometric redshift and lensing data. A primary challenge in constructing optical cluster catalogs will be the definition of robust mass proxies with minimal, well-understood scatter across the mass and redshift ranges of interest. Planned, space-based survey missions such as the Wide Field Infrared Survey Telescope (WFIRST) and Euclid also offer outstanding potential for cluster cosmology, complementing the ground-based surveys in providing lensing masses and photometric redshifts, and extending cluster search volumes out to higher redshifts.
In the near term, X-ray cluster samples constructed from serendipitous detections in Chandra and XMM-Newton observations offer the potential for important gains (e.g., Fassbender 2008; Sahlén et al. 2009). The main advances at X-ray wavelengths, however, will be provided by the eROSITA telescope on the Spektrum-Roentgen-Gamma Mission. Scheduled for launch in 2012, eROSITA will perform a four year all-sky survey that should detect an estimated 50,000–100,000 clusters with excellent purity and completeness. As discussed in Section 3.2.1, the unambiguous detection of clusters at X-ray wavelengths requires angular resolution to distinguish point sources from extended cluster emission. At modest redshifts and high fluxes, this should be straightforward for eROSITA; at high redshifts (z>1) and faint fluxes, however, separating cool-core clusters from AGN will be challenging and will require follow-up observations. Here, we note more than a dozen known examples of powerful AGN surrounded by X-ray bright clusters at intermediate-to-high redshifts (e.g. Belsole et al. 2007; Siemiginowska et al. 2010). Looking further ahead, the development of improved X-ray mirrors with high spatial resolution across a wide field of view, such as those proposed for the Wide Field X-ray Telescope, would be a major advance, rendering trivial the removal of contaminating AGN emission and allowing surveys to take full advantage of the center-excised X-ray luminosity as a low-scatter mass proxy (Section 6.4).
For all of these surveys, accurate calibration will be important; this is a particular challenge for space-based missions. In comparison to other cosmological probes, the demands on photo-z calibration will be relatively modest. This is due both to the pronounced 4000 Å break in early-type galaxy spectra and the ability to combine measurements for many galaxies per cluster. Fisher matrix studies by Cunha, Huterer & Doré (2010) suggest targets of < 0.003 for bias error and < 0.03 for error in the scatter in surveys with ∼ 105 clusters. For surveys with fewer counts, shot noise dominates, and photo-z errors become less important.
Extensive programs of follow-up observations using high resolution, high throughput telescopes will also be essential. X-ray observatories like Chandra, XMM-Newton, Suzaku and ASTRO-H are likely to remain cornerstones of this work, providing excellent, low-scatter mass proxy measurements for individual clusters. We note that such information need only be gathered for a fraction of the clusters in a survey to gain a significant boost in constraining power with respect to self-calibration alone (e.g., Wu, Rozo & Wechsler 2010). Statistical calibration of the mean masses of clusters in flux and redshift intervals from weak lensing measurements will also be critical: in order for the intrinsic power of large surveys not to be impacted severely, calibration of the mean mass at the few per cent level is required Wu, Rozo & Wechsler 2010. To achieve this accuracy, detailed redshift information for the lensed, background sources will be needed; indeed, the use of full redshift probability density functions rather than simple color cuts may be required. Detailed simulations will also be needed to probe the systematic limitations of these measurements, and to advise on the best analysis approaches (Section 6.5).
6.2. Footprints of Inflation: Primordial Non-Gaussianites
Inflation predicts a near scale invariant power spectrum and nearly Gaussian distribution for the primordial curvature inhomogeneities that seed LSS. For slow-roll, single-field inflation, departures from Gaussianity are currently unobservable (by at least four orders of magnitude; Acquaviva et al. 2003; Maldacena 2003). However, other multi-field and single-field inflation models predict observable non-Gaussianity (NG). Examples include certain brane models such as the Dirac-Born-Infeld (DBI) inflation; single-field models with non-trivial kinetic terms; ghost inflation; models in which density perturbations are generated by another field such as the curvaton; and models with varying inflation decay rate. (See Chen 2010 and Komatsu 2010 for recent reviews.) Any detection of NG would provide critical information about the physical processes taking place during inflation. In particular, a convincing detection of NG of the ‘local’ type (referring to particular configurations in Fourier space) would rule out not only slow-roll but all classes of single field inflation models (Creminelli & Zaldarriaga 2004).
Current measurements of CMB anisotropies and LSS are consistent with Gaussianity (Slosar et al. 2008; Komatsu et al. 2011). In principle, measurements of the clustering and abundance of galaxy clusters can also be used to place powerful, complementary constraints. Galaxy clusters trace the rare, high-mass tail of density perturbations in the Universe (Section 2) and are uniquely sensitive to NG. N-body simulations have been used to study cluster formation under non-Gaussian initial conditions (e.g., Desjacques, Seljak & Iliev 2009; Grossi et al. 2009; Pillepich, Porciani & Hahn 2010). Analytical mass functions have also been calculated using the Press-Schechter formalism (Lo Verde et al. 2008; D'Amico et al. 2011) or excursion set theory (Maggiore & Riotto 2010).
To date, CMB and LSS studies have only been used to place scale-independent constraints on NG. However, certain models that produce relatively large NG (see above) also present strong scale-dependence of the signal, due to, e.g., a changing (effective or otherwise) sound speed (Lo Verde et al. 2008). The addition of measurements at the smaller, galaxy cluster scale should provide important constraints on such models (Riotto & Sloth 2011; Shandera, Dalal & Huterer 2011). Several recent works (Oguri 2009; Cunha, Huterer & Doré 2010; Sartoris et al. 2010) have investigated quantitatively the potential of future optical and/or X-ray cluster surveys for constraining NG.
6.3. The Thermodynamics of Cluster Outskirts
To date, robust thermodynamic measurements have, in general, only been possible for the inner parts of clusters (r ≲ r500), where the X-ray emission is brightest and the SZ signal strongest; a large fraction of their volumes remain practically unexplored. Precise, accurate measurements of the density, temperature, pressure and entropy out to the virial radii of clusters provide important insight into the physics of clusters and (ongoing) large-scale structure formation, and can improve the precision and robustness of cosmological constraints.
Recently, the Japanese-US Suzaku satellite has opened a new window onto the outskirts of clusters. Due to its lower instrumental background than flagship X-ray observatories like Chandra and XMM-Newton, which orbit beyond the Earth's protective magnetic fields, Suzaku can study the faint, outer regions of clusters more reliably. The primary challenge with Suzaku is the relatively large point spread function of its mirrors, which limits detailed, spatially-resolved studies to systems at modest redshift (z ≲ 0.1).
Over the past two years, a series of ground breaking measurements of the outskirts of clusters with Suzaku have been reported (George et al. 2009; Reiprich et al. 2009; Bautz et al. 2009; Hoshino et al. 2010). These have confirmed the presence of smoothly decreasing density and temperature profiles out to large radii, as was qualitatively expected from theoretical models and earlier data (e.g., Markevitch et al. 1998; Frenk et al. 1999). Interestingly, these observations have also suggested a possible flattening of the outer entropy profiles.
Of particular interest are the advances made with the Suzaku Key Project study of the Perseus Cluster (z = 0.018), the nearest, massive galaxy cluster and brightest, extended extragalactic X-ray source. The temperature and metallicity profiles for the northwestern (NW) and eastern (E) arms of Perseus measured with Suzaku are shown in Figure 19 (Simionescu et al. 2011). Also plotted, for comparison, are the results from earlier, deep Chandra observations of the cluster core (Sanders & Fabian 2007). The Suzaku and Chandra data show excellent agreement where they meet, and measure the thermodynamic structure of the ICM over three decades in radius, out to r200.
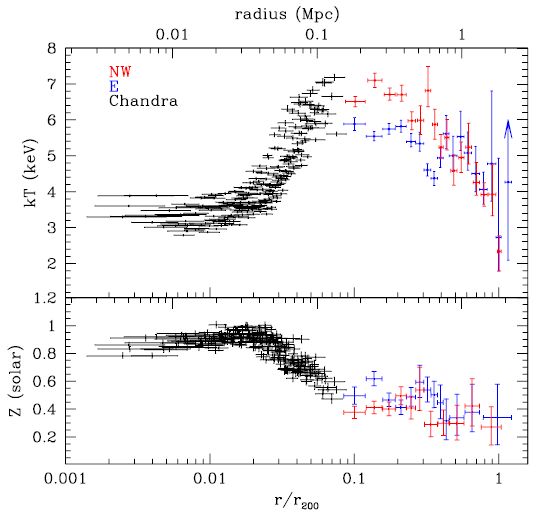 |
Figure 19. The observed, projected temperature (kT) and metallicity (Z) profiles in the Perseus Cluster, the nearest, massive galaxy cluster and brightest, extended extragalactic X-ray source. Suzaku results for the northwestern (NW) arm of the cluster are shown in red; and for the eastern (E) arm (approximately aligned with the major axis) in blue (Simionescu et al. 2011). Chandra measurements of the inner regions (Sanders & Fabian 2007) are shown in black. |
Models of large scale structure formation show that gas is shock heated as it falls into clusters. Entropy is an important tracer of this virialization process. Numerical simulations predict that in the absence of non-gravitational processes such as radiative cooling and feedback, the entropy, K, should follow a power-law with radius, K ∝∼ rβ, with β ∼ 1.1–1.2 (e.g., Voit, Kay & Bryan 2005). With the exception of a cold front seen along the eastern arm at r ∼ 0.3 r200, the entropy profile in Perseus roughly follows the expected trend out to r ∼ 0.6 r200 (Figure 20). Beyond this radius, however, both arms flatten away from the predicted power-law shape. The pressure profile shows good agreement between the NW and E arms. Within r ≲ 0.5r200, the Suzaku pressure results show good agreement with the predictions from numerical simulations (Nagai, Kravtsov & Vikhlinin 2007), and previous measurements with XMM-Newton (Arnaud et al. 2010). At larger radii, however, the observed pressure profile is shallower than a simple extrapolation of the XMM-Newton results.
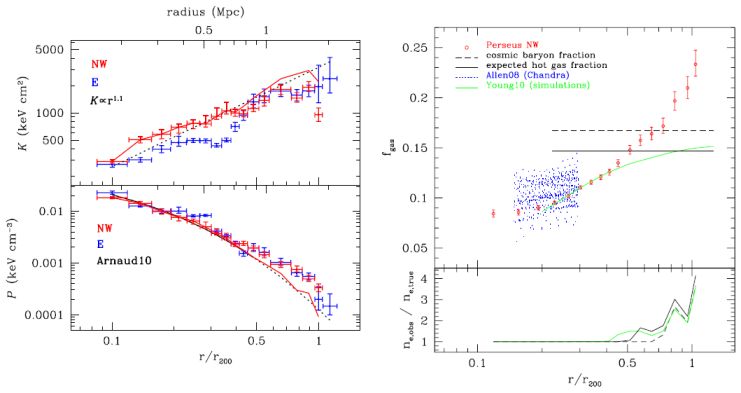 |
Figure 20. Left: Deprojected entropy (K) and pressure (P) profiles out to r200 for the NW (red) and E (blue) arms of Perseus. In the upper panel, the black dotted line shows the expected, power-law entropy profile determined from simulations of non-radiative, hierarchical cluster formation: K ∝ r1.1 (e.g., Voit, Kay & Bryan 2005). In the lower panel, the black solid line shows a parameterized pressure model, motivated by simulations (Nagai, Kravtsov & Vikhlinin 2007), that was fitted to the inner regions (r ≲ 0.5r200) of clusters studied with XMM-Newton (Arnaud et al. 2010). The dotted curve is the extrapolation of this model to larger radii. The solid, red curves show the entropy and pressure profiles measured for the NW arm by Suzaku after corrections for gas clumping, which agree with the model predictions. Right: The integrated gas mass fraction profile for the NW arm of the Perseus Cluster. The dashed black line denotes the mean cosmic baryon fraction measured by WMAP7 (Komatsu et al. 2011). Accounting for 12% of the baryons being in stars (Lin & Mohr 2004; Gonzalez, Zaritsky & Zabludoff 2007; Giodini et al. 2009) gives the expected fraction of baryons in the hot gas phase, marked with the solid black line. Previous results at r ≤ r2500 from Chandra (Allen et al. 2008) are shown in blue. Predictions from numerical simulations (Young et al. 2011) incorporating a simplified AGN feedback model are shown in green. The bottom panel shows the overestimation of the electron density as a function of radius due to gas clumping. See Simionescu et al. (2011) for details. |
Accurate estimates of the gas masses and total masses out to large radii are of particular importance for cosmological studies. The Suzaku observations of the Perseus Cluster provide the first such measurements for a massive cluster. The best-fit NFW mass model determined from a hydrostatic analysis of the (relatively relaxed) NW arm has parameters in good agreement with the predictions from cosmological simulations (c = 5.0 ± 0.5, M200 = 6.7 ± 0.5 × 10¹⁴ M⊙) and provides a good description of the data (Simionescu et al. 2011). Of particular interest is the cumulative fgas profile, shown in the right panel of Figure 20. Within r2500 (r ≲ 0.3 r200), the observed fgas profile is consistent with previous Chandra and SZ measurements for other massive, relaxed clusters (Allen et al. 2004; 2008; LaRoque et al. 2006). From 0.2–0.45 r200 (i.e. excluding the central cooling core) the fgas profile is also consistent with the predictions from recent numerical simulations, incorporating a simple model of AGN feedback (Young et al. 2011). At r ∼ 0.6 r200, the enclosed fgas value approximately matches the mean cosmic baryon fraction, as measured from the CMB (Komatsu et al. 2011). Beyond r ∼ 2/3r200, however, where the entropy also flattens away from the expected power-law behavior, the fgas apparently exceeds the mean cosmic value. The most plausible explanation for the apparent excess of baryons at large radii is gas clumping: in X-rays, the directly measurable quantity from the intensity of the emission is the average of the square of the electron density, rather than the average electron density itself. If the density is not uniform, i.e. the gas is clumpy, then the average electron density estimated from the X-ray intensity will overestimate the truth; this will lead to an overestimate of the gas mass and gas mass fraction, and will flatten the apparent entropy and pressure profiles.
The amount of gas clumping in Perseus, as inferred from comparison of the observed and expected fgas profiles, is shown in the lower panel of the right of Figure 20. Using this clumping profile to correct the pressure and entropy measurements gives the solid red curves in the left panel. The clumping-corrected entropy profile shows good agreement with the expected power-law form out to r200. Likewise, the clumping-corrected pressure profile matches the form predicted by simulations (Nagai, Kravtsov & Vikhlinin 2007).
Importantly, the Suzaku results provide no evidence for the puzzling deficit of baryons at r ∼ r500 inferred from some previous studies of massive clusters using lower quality X-ray data (at large radii) and stronger modeling priors (e.g., Vikhlinin et al. 2006; Gonzalez, Zaritsky & Zabludoff 2007; McCarthy, Bower & Balogh 2007; Ettori et al. 2009). The Perseus data suggest that beyond the innermost core but within r ≲ 0.5r200, X-ray measurements for massive, relaxed clusters can be used simply and robustly for cosmological work. At larger radii, the effects of gas clumping become increasingly important and must be accounted for.
In principle, the combination of X-ray and SZ observations can also be used measure gas clumping, offering an important cross-check of the Suzaku results. The origin of these density fluctuations is also an important, open question. Although numerical simulations predict that the gas in the outskirts of clusters should be clumpy (e.g., Mathiesen, Evrard & Mohr 1999), the degree of inhomogeneity predicted depends in detail on a range of uncertain physical processes, including cooling, conduction, viscosity, and the impact of magnetic fields.
Over the next few years, Suzaku and SZ studies of other bright, nearby clusters, complemented later by higher spectral resolution X-ray data from ASTRO-H, can be expected to stimulate significant progress. In particular, fgas measurements out to large radii for a statistical sample of nearby clusters, and measurements of the dispersion in this and other properties from region-to-region and system-to-system, should provide a robust low-redshift anchor for cosmological work and powerful constraints on astrophysical models.
6.4. Evolution of Cluster Cores
Cluster cores – typically describing the central region of r < 50–100 radius – often host a variety of astrophysical processes including efficient radiative cooling, AGN outbursts, modest star formation, and sloshing or other bulk motions (see, e.g., McNamara & Nulsen 2007 for a review). In the cores of even the most dynamically relaxed clusters, small-scale departures from hydrostatic equilibrium are often apparent (Fabian et al. 2003; Markevitch & Vikhlinin 2007; Allen et al. 2008).
The astrophysics of cluster cores is especially important for cosmological studies at X-ray wavelengths. In particular, clusters for which radiative cooling in the core is efficient form an easily distinguishable sub-population with significantly enhanced central gas density and luminosity, also commonly accompanied by a drop in ICM temperature (Fabian et al. 1994; Peterson & Fabian 2006). The sharp, central density peaks of these ‘cool core’ clusters enhance their detectability at X-ray wavelengths. However, without spatial resolution ≲ 10 arcsec or additional follow-up data, cool-core clusters at high redshift lying close to the survey flux limit cannot be distinguished easily from non-cluster X-ray point sources. (This selection bias has affected some studies in the literature.) The prevalence and evolution of cool cores in the cluster population thus plays a significant role in determining the shape and evolution of the scatter in X-ray luminosity at fixed mass.
Confirmation of this fact can be found in the dramatic reduction in scatter obtained when emission from a central region of radius 0.15r500 is excised from luminosity measurements in forming the LX – M scaling relation, from ∼ 40% to < 10% (Figure 21; see also Markevitch 1998; Allen & Fabian 1998; Zhang et al. 2007; Maughan 2007; Mantz et al. 2010a). (While the excision radius of 0.15 r500 has become somewhat conventional, a similar reduction in scatter is evident when excising a fixed metric radius of similar size, e.g. 150 kpc.) Mantz 2009 found that roughly half of the intrinsic scatter can be attributed to radii < 0.05 r500, the typical scale of cool, dense cluster cores, with most of the remainder due to variations in the gas density profile at 0.05 < r / r500 < 0.15. The fraction of the total flux coming from r < 0.05 r500 can be as large as 50%, and correlates strongly with other observable signatures of cool cores such as central cooling time and cuspiness of the surface brightness profile (Mantz 2009; see also Andersson et al. 2009). Interestingly, the fractions of cool-core systems identified using this criterion are comparable in X-ray flux-selected samples, at least within z < 0.5 (∼ 40%; see Figure 21; Peres et al. 1998; Bauer et al. 2005; Sanderson, Ponman & O'Sullivan 2006; Chen et al. 2007; Mantz 2009), although these fractions are biased relative to the full population due to selection effects. Cool cores are also common in X-ray selected samples at high redshift (Santos et al. 2008; 0.7 < z < 1.4).
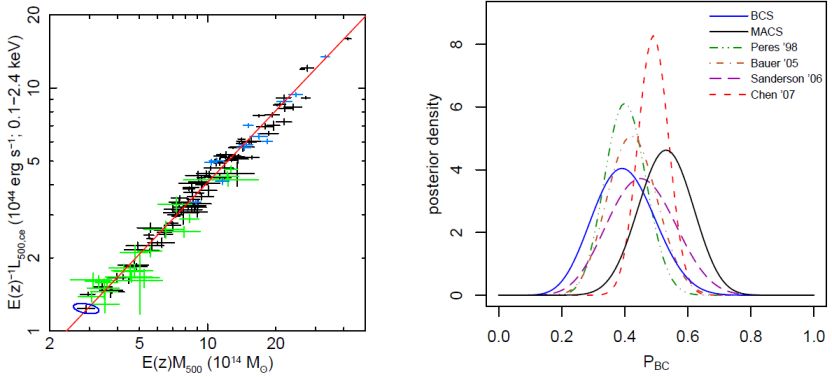 |
Figure 21. Left: Center-excised luminosity–mass relation, in which emission within 0.15r500 of cluster centers is excluded from the luminosity measurements. Error bars in the plot show statistical uncertainties only. The intrinsic scatter in this relation is < 10%, significantly reduced from ∼40% for the full luminosity–mass relation. Gray points are at redshifts z < 0.5, blue points are at 0.5 < z < 0.7, and green points are at 0.35 < z < 0.9. The blue ellipse shows the typical correlation of measurement errors, which is accounted for in the fit. The negative sense of the measurement correlation results from details of the center excision: larger mass implies larger r500 and thus a larger excised region. Since more flux is excised than is gained at large radius when r500 increases, there is a net reduction of luminosity with larger mass. From Mantz et al. (2010a). Right: Posterior probability distributions for the fraction of cool-core clusters based on the number identified in various X-ray selected samples at z < 0.5. Due to Malmquist bias, these must overestimate the fraction in the full cluster population. From Mantz (2009) (see also references therein). |
Although the number of massive clusters found in RASS is too small to detect evolution or departures from log-normality in the luminosity–mass scatter, future, deeper X-ray surveys such as eROSITA will provide the larger samples necessary for these investigations. Conversely, a better understanding of cluster cores will be required to fully exploit these surveys for cosmology. Such studies will need to employ the full statistical apparatus described in Section 4.1.1 to obtain unbiased results.
Due to the weaker dependence of the SZ signal on the central gas density (Section 3.1), SZ surveys are expected to be less sensitive to the presence of cool cores than X-ray surveys. This is consistent with the relatively low fraction of cool core systems observed among the newly discovered clusters in the Planck Early Release cluster catalog (Planck Collaboration 2011a; 2011d). We note, however, that current SZ surveys are not necessarily immune to biases associated with cool cores; depending on the selection techniques employed, infrared emission associated with star formation in the central regions of cool core clusters may actually diminish the measured SZ signal.
Unleashing the full statistical power of upcoming surveys will require careful control of theoretical uncertainties. For cluster abundance and evolution tests, uncertainties in scaling relation parameters are currently more important than uncertainties in the halo mass and bias functions (Cunha & Evrard 2010). With aggressive mass calibration efforts to reduce the former, the mass function and bias errors will need to be limited to the percent level in order to avoid significant degradation in cosmological parameter constraints (Wu, Zentner & Wechsler 2010). Simulation campaigns will be needed to address this challenge.
Over the next decade, increased computing power will enable models with new capabilities (e.g. multi-scale simulation in place of sub-grid models) and will vastly expand the size of current simulation suites. By densely sampling a large control space of cosmological and astrophysical parameters, simulation ensembles can support survey analysis via functional interpolation, a method termed emulation (Habib et al. 2007). An initial application of this technique uses 38 × 109-particle N-body simulations to predict the non-linear matter power spectrum to 1% accuracy (for k ≲ 1 h / Mpc) in a 5-dimensional space of cosmological parameters (Lawrence et al. 2010).
Precise N-body calibrations must be treated with some caution, as the baryons representing 17% of the total mass undergo different small-scale dynamics than CDM. Back-reaction effects of cooling and star formation could be important (Rudd, Zentner & Kravtsov 2008; Stanek, Rudd & Evrard 2009) and should be systematically investigated. As discussed in Sections 4.5 and 5, studies of LSS in non-standard cosmologies, including those for which dark energy may cluster or in which weak-field gravity is non-Newtonian, should also be pursued.
Full solution of the galaxy formation problem from first principles remains challenging. Direct simulation methods will continue to improve, though not likely to the point where multi-fluid simulations will offer definitive predictions for next-generation survey analysis. Semi-analytic methods are increasingly informative; for example, the frantic early merging that forms the central galaxies in clusters is becoming understood (De Lucia et al. 2006; Weinmann et al. 2010). But many elements required to predict the spectrophotometric properties of galaxies remain poorly understood, including stellar population synthesis and dust evolution (Conroy, White & Gunn 2010). Empirically tuned statistical approaches, essentially assigning galaxy properties to halos or sub-halos in a manner informed by observed clustering as a function of luminosity and/or color, will continue to provide a valuable complement to physical methods.
Upcoming surveys will require sophisticated, automated reduction and analysis pipelines for their large data streams, along with quality assurance to validate accuracy. Simulations of sky expectations, often referred to as ‘mock’ or ‘synthetic’ surveys, will be required to provide realistic testbeds in which the answers are known. Mock surveys provide key quality assurance support by: (i) incorporating line-of-sight projection effects on measured properties; (ii) including distortions and noise from telescope/camera optics and other sources; and (iii) validating image processing and data management pipelines. Since the effort involved in producing such data is non-trivial, mechanisms to publish and enable their broader use within the community need to be pursued.