


6.1. Escape of Ionizing Radiation from Galaxies
The intergalactic ionizing radiation field, a key ingredient in the development of reionization, is determined by the amount of ionizing radiation escaping from the host galaxies of stars and quasars. The value of the escape fraction as a function of redshift and galaxy mass remains a major uncertainty in all current studies, and could affect the cumulative radiation intensity by orders of magnitude at any given redshift. Gas within halos is far denser than the typical density of the IGM, and in general each halo is itself embedded within an overdense region, so the transfer of the ionizing radiation must be followed in the densest regions in the universe. Numerical simulations of reionization are limited in their resolution of the densest regions and in the accuracy of their treatment of radiative transfer.
The escape of ionizing radiation (h
 > 13.6eV,
 < 912
Å) from the disks of present-day galaxies has been studied in
recent years in the context of explaining the extensive diffuse
ionized gas layers observed above the disk in the Milky Way
(Reynolds et al. 1995)
and other galaxies (e.g.,
Rand 1996;
Hoopes, Walterbos, &
Rand 1999).
Theoretical models predict that of order 3-14% of the
ionizing luminosity from O and B stars escapes the Milky Way disk
(Dove & Shull 1994;
Dove, Shull, &
Ferrara 2000).
A similar escape fraction of fesc = 6% was determined by
Bland-Hawthorn &
Maloney (1999)
based on H
< 912
Å) from the disks of present-day galaxies has been studied in
recent years in the context of explaining the extensive diffuse
ionized gas layers observed above the disk in the Milky Way
(Reynolds et al. 1995)
and other galaxies (e.g.,
Rand 1996;
Hoopes, Walterbos, &
Rand 1999).
Theoretical models predict that of order 3-14% of the
ionizing luminosity from O and B stars escapes the Milky Way disk
(Dove & Shull 1994;
Dove, Shull, &
Ferrara 2000).
A similar escape fraction of fesc = 6% was determined by
Bland-Hawthorn &
Maloney (1999)
based on H measurements of the Magellanic
Stream. From Hopkins Ultraviolet Telescope observations of four
nearby starburst galaxies
(Leitherer et al. 1995;
Hurwitz, Jelinsky, &
Dixon 1997),
the escape fraction was estimated to be in the range
3% < fesc < 57%. If similar escape fractions
characterize high-redshift galaxies, then stars could have provided a major
fraction of the background radiation that reionized the IGM (e.g.,
Madau & Shull 1996;
Madau 1999).
However, the escape fraction from
high-redshift galaxies, which formed when the universe was much denser
(
measurements of the Magellanic
Stream. From Hopkins Ultraviolet Telescope observations of four
nearby starburst galaxies
(Leitherer et al. 1995;
Hurwitz, Jelinsky, &
Dixon 1997),
the escape fraction was estimated to be in the range
3% < fesc < 57%. If similar escape fractions
characterize high-redshift galaxies, then stars could have provided a major
fraction of the background radiation that reionized the IGM (e.g.,
Madau & Shull 1996;
Madau 1999).
However, the escape fraction from
high-redshift galaxies, which formed when the universe was much denser
(
 (1 +
z)3), may be significantly lower than that
predicted by models meant to describe present-day galaxies. Current
reionization calculations assume that galaxies are isotropic point
sources of ionizing radiation and adopt escape fractions in the range
5% < fesc < 60% (see, e.g.,
Gnedin 2000a,
Miralda-Escudé et al. 1999).
(1 +
z)3), may be significantly lower than that
predicted by models meant to describe present-day galaxies. Current
reionization calculations assume that galaxies are isotropic point
sources of ionizing radiation and adopt escape fractions in the range
5% < fesc < 60% (see, e.g.,
Gnedin 2000a,
Miralda-Escudé et al. 1999).
Clumping is known to have a significant effect on the penetration and escape of radiation from an inhomogeneous medium (e.g., Boissé 1990; Witt & Gordon 1996, 2000; Neufeld 1991; Haiman & Spaans 1999; Bianchi et al. 2000). The inclusion of clumpiness introduces several unknown parameters into the calculation, such as the number and overdensity of the clumps, and the spatial correlation between the clumps and the ionizing sources. An additional complication may arise from hydrodynamic feedback, whereby part of the gas mass is expelled from the disk by stellar winds and supernovae (Section 7).
Wood & Loeb (2000)
used a three-dimensional radiation transfer code
to calculate the steady-state escape fraction of ionizing photons from
disk galaxies as a function of redshift and galaxy mass. The gaseous
disks were assumed to be isothermal, with a sound speed
cs ~ 10 km s-1, and radially
exponential, with a scale-length
based on the characteristic spin parameter and virial radius of their
host halos. The corresponding temperature of ~ 104 K is typical
for a gas which is continuously heated by photo-ionization from stars.
The sources of radiation were taken to be either stars embedded in the
disk, or a central quasar. For stellar sources, the predicted increase
in the disk density with redshift resulted in a strong decline of the
escape fraction with increasing redshift. The situation is different
for a central quasar. Due to its higher luminosity and central
location, the quasar tends to produce an ionization channel in the
surrounding disk through which much of its ionizing radiation escapes
from the host. In a steady state, only recombinations in this
ionization channel must be balanced by ionizations, while for stars
there are many ionization channels produced by individual star-forming
regions and the total recombination rate in these channels is very
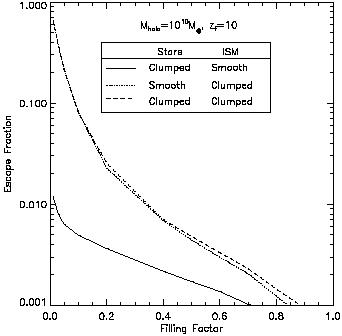
high. Escape fractions  10% were achieved for stars at z ~ 10 only if ~ 90% of the gas
was expelled from the disks or if
dense clumps removed the gas from the vast majority
( 80%) of
the disk volume (see Figure 20). This analysis
applies only to halos with virial temperatures
104 K.
Ricotti & Shull
(2000)
reached similar conclusions but for a quasi-spherical
configuration of stars and gas. They demonstrated that the escape
fraction is substantially higher in low-mass halos with a virial
temperature
10% were achieved for stars at z ~ 10 only if ~ 90% of the gas
was expelled from the disks or if
dense clumps removed the gas from the vast majority
( 80%) of
the disk volume (see Figure 20). This analysis
applies only to halos with virial temperatures
104 K.
Ricotti & Shull
(2000)
reached similar conclusions but for a quasi-spherical
configuration of stars and gas. They demonstrated that the escape
fraction is substantially higher in low-mass halos with a virial
temperature  104 K. However, the formation of stars in such
halos depends on their uncertain ability to cool via the efficient
production of molecular hydrogen (see Section 3.3).
104 K. However, the formation of stars in such
halos depends on their uncertain ability to cool via the efficient
production of molecular hydrogen (see Section 3.3).
|
Figure 20.
Escape fractions of stellar ionizing photons from a gaseous
disk embedded within a 1010
M |
The main uncertainty in the above predictions involves the distribution of the gas inside the host galaxy, as the gas is exposed to the radiation released by stars and the mechanical energy deposited by supernovae. Given the fundamental role played by the escape fraction, it is desirable to calibrate its value observationally. Recently, Steidel, Pettini, & Adelberger (2001) reported a preliminary detection of significant Lyman continuum flux in the composite spectrum of 29 Lyman break galaxies (LBG) with redshifts in the range z = 3.40±0.09. They co-added the spectra of these galaxies in order to be able to measure the low flux. Another difficulty in the measurement comes from the need to separate the Lyman-limit break caused by the interstellar medium from that already produced in the stellar atmospheres. After correcting for intergalactic absorption, Steidel et al. (2001) inferred a ratio between the emergent flux density at 1500Å and 900Å (rest frame) of 4.6±1.0. Taking into account the fact that the stellar spectrum should already have an intrinsic Lyman discontinuity of a factor of ~ 3-5, but that only ~ 15-20% of the 1500Å photons escape from typical LBGs without being absorbed by dust (Pettini et al. 1998a; Adelberger & Steidel 2000), the inferred 900Å escape fraction is fesc ~ 10-20%. However, the observed blue spectrum suggests that these 29 particular LBGs may have a very low dust content, and the escape fraction in these galaxies may be 50% or higher (Haehnelt et al. 2001). Thus, although the galaxies in this sample were drawn from the bluest quartile of the LBG spectral energy distributions, the measurement implies that this quartile may itself dominate the hydrogen-ionizing background relative to quasars at z ~ 3.
6.2. Propagation of Ionization Fronts in the IGM
The radiation output from the first stars ionizes hydrogen in a growing volume, eventually encompassing almost the entire IGM within a single H II bubble. In the early stages of this process, each galaxy produces a distinct H II region, and only when the overall H II filling factor becomes significant do neighboring bubbles begin to overlap in large numbers, ushering in the ``overlap phase'' of reionization. Thus, the first goal of a model of reionization is to describe the initial stage, when each source produces an isolated expanding H II region.
We assume a spherical ionized volume V, separated from the surrounding neutral gas by a sharp ionization front. In the case of a stellar ionizing spectrum, most ionizing photons are just above the hydrogen ionization threshold of 13.6 eV, where the absorption cross-section is high and a very thin layer of neutral hydrogen is sufficient to absorb all the ionizing photons. On the other hand, an ionizing source such as a quasar produces significant numbers of higher energy photons and results in a thicker transition region.
In the absence of recombinations, each hydrogen atom in the IGM would only have to be ionized once, and the ionized proper volume Vp would simply be determined by

| (61) |
where  H
is the mean number density of hydrogen and
N
H
is the mean number density of hydrogen and
N is the
total number
of ionizing photons produced by the source. However, the increased
density of the IGM at high redshift implies that recombinations cannot
be neglected. Indeed, in the case of a steady ionizing source (and
neglecting the cosmological expansion), a steady-state volume would be
reached corresponding to the Strömgren sphere, with recombinations
balancing ionizations:
is the
total number
of ionizing photons produced by the source. However, the increased
density of the IGM at high redshift implies that recombinations cannot
be neglected. Indeed, in the case of a steady ionizing source (and
neglecting the cosmological expansion), a steady-state volume would be
reached corresponding to the Strömgren sphere, with recombinations
balancing ionizations:
| (62) |
where the recombination rate depends on the square of the density
and on the case B recombination coefficient
B = 2.6 ×
10-13 cm3 s-1 for hydrogen at T
= 104 K. The exact
evolution for an expanding H II region, including a non-steady
ionizing source, recombinations, and cosmological expansion, is given by
(Shapiro & Giroux
1987)
| (63) |
In this equation, the mean density
H varies
with time as 1/a3(t). A critical feature of the
physics of
reionization is the dependence of recombination on the square of the
density. This means that if the IGM is not uniform, but instead the
gas which is being ionized is mostly distributed in high-density
clumps, then the recombination time is very short. This is often dealt
with by introducing a volume-averaged clumping factor C (in general
time-dependent), defined by
(4)
| (64) |
If the ionized volume is large compared to the typical scale of clumping, so that many clumps are averaged over, then C can be assumed to be approximately spatially uniform. In general, equation (63) can be solved by supplementing it with equation (64) and specifying C. Switching to the comoving volume V, the resulting equation is
| (65) |
where the present number density of hydrogen is
| (66) |
This number density is lower
than the total number density of baryons
b0 by a
factor of ~ 0.76, corresponding to the primordial mass fraction of
hydrogen. The solution for V(t) (generalized from
Shapiro & Giroux
1987)
around a source which turns on at t = ti is
| (67) |
where
| (68) |
At high redshift (equations (9) and (10) in Section 2.1), and with the additional assumption of a constant C, the function F simplifies as follows. Defining
| (69) |
we derive

| (70) |
where the last equality assumes
C = 10 and our standard choice of cosmological parameters:
 m = 0.3,
 = 0.7, and
b = 0.045 (see
the end of Section 1).
Although this expression for F(t', t) is in general
an accurate approximation at high redshift, in the particular case of the
CDM model (where
m +
= 1) we get the exact
result by replacing equation (69) with
= 0.7, and
b = 0.045 (see
the end of Section 1).
Although this expression for F(t', t) is in general
an accurate approximation at high redshift, in the particular case of the
CDM model (where
m +
= 1) we get the exact
result by replacing equation (69) with
| (71) |
The size of the resulting H II region depends on the halo which
produces it. Consider a halo of total mass M and baryon fraction
b /
m. To derive a
rough estimate, we assume that baryons
are incorporated into stars with an efficiency of
fstar = 10%,
and that the escape fraction for the resulting ionizing radiation is
also fesc = 10%. If the stellar IMF is similar to the one
measured locally
[Scalo 1998;
equation (97)], then
N
 4000 ionizing photons are
produced per baryon in stars (for a
metallicity equal to 1/20 of the solar value). We define a parameter
which gives the overall number of ionizations per baryon,
4000 ionizing photons are
produced per baryon in stars (for a
metallicity equal to 1/20 of the solar value). We define a parameter
which gives the overall number of ionizations per baryon,
| (72) |
If we neglect recombinations then we obtain the maximum comoving radius of the region which the halo of mass M can ionize,

| (73) |
for our standard set of parameters. Note that this radius is larger than the halo virial radius [equation (24)] by a factor of ~ 20, essentially independent of redshift and halo mass. The actual radius never reaches this size if the recombination time is shorter than the lifetime of the ionizing source. For an instantaneous starburst with the Scalo (1998) IMF [equation (97)], the production rate of ionizing photons can be approximated as (Haiman, personal communication)
| (74) |
where
N
= 4000,
= 4.5, and the most massive
stars fade away with the characteristic time-scale
ts = 3 × 10⁶ yr. In
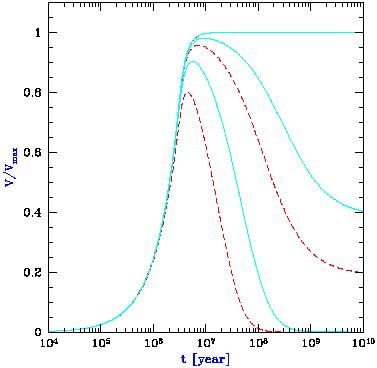
Figure 21 we show the time evolution of the
volume ionized by
such a source, with the volume shown in units of the maximum volume
Vmax which corresponds to rmax in
equation (73). We consider a source turning on at z = 10
(solid curves) or z = 15 (dashed curves), with three cases for each:
no recombinations, C = 1, and C = 10, in order from top to bottom
(Note that the result is independent of redshift in the case of no
recombinations). When recombinations are included, the volume rises
and reaches close to Vmax before dropping after the source
turns off. At large t recombinations stop due to the dropping
density, and the volume approaches a constant value (although
V << Vmax at large t if C = 10).
|
Figure 21.
Expanding H II region around an isolated ionizing
source. The comoving ionized volume V is expressed in units of the
maximum possible volume,
Vmax = 4 |
We obtain a similar result for the size of the H II region
around a galaxy if we consider a mini-quasar rather than stars. For
the typical quasar spectrum
(Elvis et al. 1994),
if we assume a radiative efficiency of ~ 6% then roughly 11,000 ionizing
photons are produced per baryon incorporated into the black hole
(Haiman, personal communication). The efficiency of incorporating the
baryons in a galaxy into a central black hole is low
( 0.6% in
the local universe, e.g.
Magorrian et al. 1998;
see also Section 8.2.2), but the escape
fraction for quasars is likely to be
close to unity, i.e., an order of magnitude higher than for stars (see
Section 6.1). Thus, for every baryon in
galaxies, up to ~ 65
ionizing photons may be produced by a central black hole and ~ 40
by stars, although both of these numbers for
Nion are highly
uncertain. These numbers suggest that in either case the typical size
of H II regions before reionization may be
1 Mpc or ~ 10 Mpc,
depending on whether 108
M halos or
1012
M halos dominate.
halos or
1012
M halos dominate.
In this section we summarize recent progress, both analytic and numerical, made toward elucidating the basic physics of reionization and the way in which the characteristics of reionization depend on the nature of the ionizing sources and on other input parameters of cosmological models.
The process of the reionization of hydrogen involves several distinct stages. The initial, ``pre-overlap'' stage (using the terminology of Gnedin 2000a) consists of individual ionizing sources turning on and ionizing their surroundings. The first galaxies form in the most massive halos at high redshift, and these halos are biased and are preferentially located in the highest-density regions. Thus the ionizing photons which escape from the galaxy itself (see Section 6.1) must then make their way through the surrounding high-density regions, which are characterized by a high recombination rate. Once they emerge, the ionization fronts propagate more easily into the low-density voids, leaving behind pockets of neutral, high-density gas. During this period the IGM is a two-phase medium characterized by highly ionized regions separated from neutral regions by ionization fronts. Furthermore, the ionizing intensity is very inhomogeneous even within the ionized regions, with the intensity determined by the distance from the nearest source and by the ionizing luminosity of this source.
The central, relatively rapid ``overlap'' phase of reionization begins when neighboring H II regions begin to overlap. Whenever two ionized bubbles are joined, each point inside their common boundary becomes exposed to ionizing photons from both sources. Therefore, the ionizing intensity inside H II regions rises rapidly, allowing those regions to expand into high-density gas which had previously recombined fast enough to remain neutral when the ionizing intensity had been low. Since each bubble coalescence accelerates the process of reionization, the overlap phase has the character of a phase transition and is expected to occur rapidly, over less than a Hubble time at the overlap redshift. By the end of this stage most regions in the IGM are able to see several unobscured sources, and therefore the ionizing intensity is much higher than before overlap and it is also much more homogeneous. An additional ingredient in the rapid overlap phase results from the fact that hierarchical structure formation models predict a galaxy formation rate that rises rapidly with time at the relevant redshift range. This process leads to a state in which the low-density IGM has been highly ionized and ionizing radiation reaches everywhere except for gas located inside self-shielded, high-density clouds. This marks the end of the overlap phase, and this important landmark is most often referred to as the `moment of reionization'.
Some neutral gas does, however, remain in high-density structures
which correspond to Lyman Limit systems and damped
Ly systems
seen in absorption at lower redshifts. The high-density regions are
gradually ionized as galaxy formation proceeds, and the mean ionizing
intensity also grows with time. The ionizing intensity continues to
grow and to become more uniform as an increasing number of ionizing
sources is visible to every point in the IGM. This ``post-overlap''
phase continues indefinitely, since collapsed objects retain neutral
gas even in the present universe. The IGM does, however, reach another
milestone (of limited significance) at
z ~ 1.6, the breakthrough
redshift (which is determined by the probability of intersecting Lyman
limit systems;
Madau, Haardt, &
Rees 1999).
Below this redshift, all
ionizing sources are visible to each other, while above this redshift
absorption by the Ly forest
clouds implies that only sources
in a small redshift range are visible to a typical point in the IGM.
Semi-analytic models of the pre-overlap stage focus on the evolution of the H II filling factor, i.e., the fraction of the volume of the universe which is filled by H II regions. We distinguish between the naive filling factor FH II and the actual filling factor or porosity QH II. The naive filling factor equals the number density of bubbles times the average volume of each, and it may exceed unity since when bubbles begin to overlap the overlapping volume is counted multiple times. However, as explained below, in the case of reionization the linearity of the physics means that FH II is a very good approximation to QH II up to the end of the overlap phase of reionization.
The model of individual H II regions presented in the previous
section can be used to understand the development of the total filling
factor. Starting with equation (65), if we assume a common
clumping factor C for all H II regions then we can sum each
term of the equation over all bubbles in a given large volume of the
universe, and then divide by this volume. Then V is replaced by the
filling factor and
N
by the total number of ionizing photons
produced up to some time t, per unit volume. The latter quantity
equals the mean number of ionizing photons per baryon times the mean
density of baryons b.
Following the arguments leading to
equation (73), we find that if we include only stars then
| (75) |
where the collapse fraction Fcol is the fraction of all the baryons in the universe which are in galaxies, i.e., the fraction of gas which settles into halos and cools efficiently inside them. In writing equation (75) we are assuming instantaneous production of photons, i.e., that the time-scale for the formation and evolution of the massive stars in a galaxy is short compared to the Hubble time at the formation redshift of the galaxy. In a model based on equation (65), the near-equality between FH II and QH II results from the linearity of this equation. First, the total number of ionizations equals the total number of ionizing photons produced by stars, i.e., all ionizing photons contribute regardless of the spatial distribution of sources; and second, the total recombination rate is proportional to the total ionized volume, regardless of its topology. Thus, even if two or more bubbles overlap the model remains an accurate approximation for QH II (at least until QH II becomes nearly equal to 1). Note, however, that there still are a number of important simplifications in the model, including the assumption of a homogeneous (though possibly time-dependent) clumping factor, and the neglect of feedback whereby the formation of one galaxy may suppress further galaxy formation in neighboring regions. These complications are discussed in detail below and in Section 6.5 and Section 7.
Under these assumptions we convert equation (65), which describes individual H II regions, to an equation which statistically describes the transition from a neutral universe to a fully ionized one (compare Madau et al. 1999 and Haiman & Loeb 1997):
| (76) |
where we assumed a primordial mass fraction of hydrogen of 0.76. The solution (in analogy with equation (67)) is
| (77) |
where F(t', t) is determined by equations (68)-(71).
A simple estimate of the collapse fraction at high redshift is the
mass fraction (given by equation (31) in the Press-Schechter
model) in halos above the cooling threshold, which is the minimum mass
of halos in which gas can cool efficiently. Assuming that only atomic
cooling is effective during the redshift range of reionization
(Section 3.3), the minimum mass corresponds
roughly to a halo of virial temperature
Tvir = 104 K, which can be converted to a
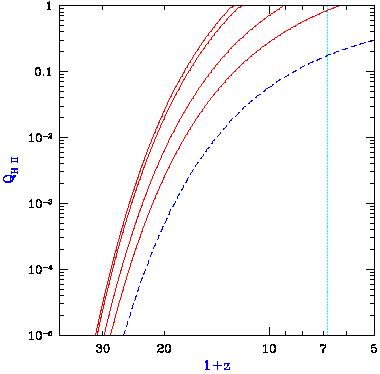
mass using equation (26). With this prescription we derive
(for Nion = 40) the reionization history shown in
Figure 22
for the case of a constant clumping factor C. The solid curves show
QH II as a function of redshift for a clumping factor
C = 0
(no recombinations), C = 1, C = 10, and C = 30, in
order from left to right. Note that if C ~ 1 then recombinations
are unimportant,
but if C 10
then recombinations significantly delay the
reionization redshift (for a fixed star-formation history). The dashed
curve shows the collapse fraction Fcol in this model. For
comparison, the vertical dotted line shows the z = 5.8 observational
lower limit
(Fan et al. 2000)
on the reionization redshift.
|
Figure 22. Semi-analytic calculation of the reionization of the IGM (for Nion = 40), showing the redshift evolution of the filling factor QH II. Solid curves show QH II for a clumping factor C = 0 (no recombinations), C = 1, C = 10, and C = 30, in order from left to right. The dashed curve shows the collapse fraction Fcol, and the vertical dotted line shows the z = 5.8 observational lower limit (Fan et al. 2000) on the reionization redshift. |
Clearly, star-forming galaxies in CDM hierarchical models are capable
of ionizing the universe at z ~ 6-15 with reasonable parameter
choices. This has been shown by a number of theoretical, semi-analytic
calculations
(Fukugita &
Kawasaki 1994;
Shapiro, Giroux, &
Babul 1994;
Kamionkowski, Spergel,
& Sugiyama 1994
Tegmark, Silk, &
Blanchard 1994;
Haiman & Loeb 1997;
Valageas & Silk
1999;
Chiu & Ostriker 2000;
Ciardi et al. 2000)
as well as numerical simulations
(Cen & Ostriker 1993;
Gnedin & Ostriker
1997;
Gnedin 2000a).
Similarly, if a small fraction
( 1%) of the gas in each
galaxy accretes onto a central black hole, then the resulting
mini-quasars are also able to reionize the universe, as has also been
shown using semi-analytic models
(Fukugita &
Kawasaki 1994;
Haiman & Loeb 1998;
Valageas & Silk
1999).
Note that the prescription whereby
a constant fraction of the galactic mass accretes onto a central black
hole is based on local observations (see
Section 8.2.2) which
indicate that z = 0 galaxies harbor central black holes of mass equal
to ~ 0.2-0.6% of their bulge mass. Although the bulge
constitutes only a fraction of the total baryonic mass of each galaxy,
the higher gas-to-stellar mass ratio in high-redshift galaxies, as
well as their high merger rates compared to their low-redshift
counterparts, suggest that a fraction of a percent of the total gas
mass in high-redshift galaxies may have contributed to the formation
of quasar black holes.
Although many models yield a reionization redshift around 7-12, the exact value depends on a number of uncertain parameters affecting both the source term and the recombination term in equation (76). The source parameters include the formation efficiency of stars and quasars and the escape fraction of ionizing photons produced by these sources. The formation efficiency of low-mass galaxies may also be reduced by feedback from galactic outflows. These parameters affecting the sources are discussed elsewhere in this review (see Section 5.2, 8.2.2, 6.1, and 7). Even when the clumping is inhomogeneous, the recombination term in equation (76) is generally valid if C is defined as in equation (64), where we take a global volume average of the square of the density inside ionized regions (since neutral regions do not contribute to the recombination rate). The resulting mean clumping factor depends on the density and clustering of sources, and on the distribution and topology of density fluctuations in the IGM. Furthermore, the source halos should tend to form in overdense regions, and the clumping factor is affected by this cross-correlation between the sources and the IGM density.
Valageas & Silk
(1999)
and Chiu & Ostriker
(2000)
calculated the
clumping factor semi-analytically by averaging over the IGM on the one
hand and virialized halos on the other hand, with the average weighed
according to the gas fraction in halos. The semi-analytic methods used
in these two detailed calculations of reionization have different
advantages:
Valageas & Silk
(1999)
included a model for clumping and
absorption by Ly clouds, but
Chiu & Ostriker
(2000)
used a generally more realistic two-phase model with separate ionized and
neutral regions.
Miralda-Escudé,
Haehnelt, & Rees (2000)
went further in their modeling of the clumping factor by attempting to
account for the geometry of ionized regions. They presented a simple
model for the distribution of density fluctuations, and more generally
they discussed the implications of inhomogeneous clumping during
reionization. They noted that as ionized regions grow, they more
easily extend into low-density regions, and they tend to leave behind
high-density concentrations, with these neutral islands being ionized
only at a later time. They therefore argued that, since at
high-redshift the collapse fraction is low, most of the high-density
regions, which would dominate the clumping factor if they were
ionized, will in fact remain neutral and occupy only a tiny fraction
of the total volume. Thus, the development of reionization through the
end of the overlap phase should occur almost exclusively in the
low-density IGM, and the effective clumping factor during this time
should be ~ 1, making recombinations relatively unimportant (see
Figure 22). Only in the post-reionization phase,
Miralda-Escudé et
al. (2000)
argued, do the high density clouds and
filaments become gradually ionized as the mean ionizing intensity
further increases.
The complexity of the process of reionization is illustrated by the
recent numerical simulation by
Gnedin (2000a)
of stellar reionization (in
CDM with
m = 0.3). This
simulation uses a formulation
of radiative transfer which relies on several rough approximations;
although it does not include the effect of shadowing behind
optically-thick clumps, it does include for each point in the IGM the
effects of an estimated local optical depth around that point, plus a
local optical depth around each ionizing source. This simulation helps
to understand the advantages of the various theoretical approaches,
while pointing to the complications which are not included in the
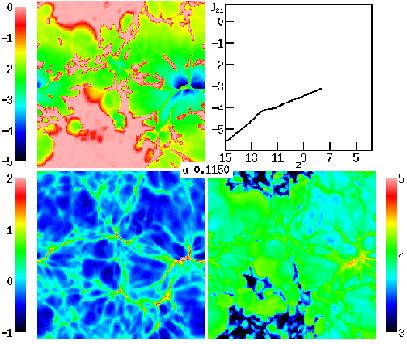
simple models. Figures 23 and
24, taken from Figure 3 in
Gnedin (2000a),
show the state of the simulated universe
just before and just after the overlap phase, respectively. They show
a thin (15 h-1 comoving kpc) slice through the box,
which is 4
h-1 Mpc on a side, achieves a spatial resolution of
1h-1
kpc, and uses 1283 each of dark matter particles and baryonic
particles (with each baryonic particle having a mass of
5 × 10⁵
M). The
figures show the redshift evolution of the mean
ionizing intensity J21 (upper right panel), and visually the
logarithm of the neutral hydrogen fraction (upper left panel), the gas
density (lower left panel), and the gas temperature (lower right
panel). Note the obvious features resulting from the periodic boundary
conditions assumed in the simulation. Also note that the intensity
J21 is defined as the intensity at the Lyman limit,
expressed in units of 10-21 erg cm-2 s-1
sr-1Hz-1. For a given source emission, the intensity
inside H II regions depends on absorption and radiative transfer
through the IGM (e.g.,
Haardt & Madau 1996;
Abel & Haehnelt 1999).
|
Figure 23. Visualization at z = 7.7 of a numerical simulation of reionization, adopted from Figure 3c of Gnedin (2000a). The panels display the logarithm of the neutral hydrogen fraction (upper left), the gas density (lower left), and the gas temperature (lower right). These panels show a two-dimensional slice of the simulation (not a two-dimensional projection). Also shown is the redshift evolution of the logarithm of the mean ionizing intensity in the simulation volume (upper right). Note the periodic boundary conditions. |
Figure 23 shows the two-phase IGM at z = 7.7, with ionized bubbles emanating from many independent sources, although there is one main concentration (located at the right edge of the image, vertically near the center; note the periodic boundary conditions). The bubbles are shown expanding into low density regions and beginning to overlap at the center of the image. The topology of ionized regions is clearly complex: While the ionized regions are analogous to islands in an ocean of neutral hydrogen, the islands themselves contain small lakes of dense neutral gas. One aspect which has not been included in theoretical models of clumping is clear from the figure. The sources themselves are located in the highest density regions (these being the sites where the earliest galaxies form) and must therefore ionize the gas in their immediate vicinity before the radiation can escape into the low density IGM. For this reason, the effective clumping factor is of order 100 in the simulation and also, by the overlap redshift, roughly ten ionizing photons have been produced per baryon. As emphasized by Gnedin (2000a), some of these numbers are resolution dependent, since the clumping factor accounts only for absorption by gas at the highest resolvable density. A higher-resolution simulation would have higher-density gas clumps and - depending on the geometry of those clumps - a higher or possibly lower clumping factor than the low-resolution simulation. Figure 24 shows that by z = 6.7 the low density regions have all become highly ionized along with a rapid increase in the ionizing intensity. The only neutral islands left are the highest density regions (compare the two panels on the left). However, we emphasize that the quantitative results of this simulation must be considered preliminary, since the effects of increased resolution and a more accurate treatment of radiative transfer are yet to be explored. Methods are being developed for incorporating a more complete treatment of radiative transfer into three dimensional cosmological simulations (e.g., Abel, Norman, & Madau 1999; Razoumov & Scott 1999).
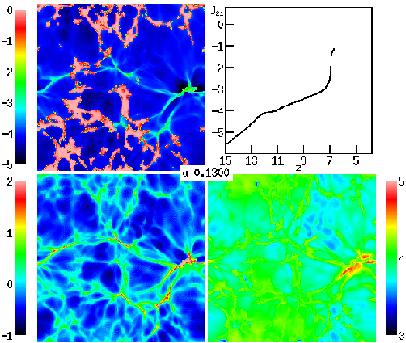
|
Figure 24. Visualization at z = 6.7 of a numerical simulation of reionization, adopted from Figure 3e of Gnedin (2000a). The panels display the logarithm of the neutral hydrogen fraction (upper left), the gas density (lower left), and the gas temperature (lower right). These panels show a two-dimensional slice of the simulation (not a two-dimensional projection). Also shown is the redshift evolution of the logarithm of the mean ionizing intensity in the simulation volume (upper right). Note the periodic boundary conditions. |
Gnedin, Ferrara, & Zweibel (2000) investigated an additional effect of reionization. They showed that the Biermann battery in cosmological ionization fronts inevitably generates coherent magnetic fields of an amplitude ~ 10-19 Gauss. These fields form as a result of the breakout of the ionization fronts from galaxies and their propagation through the H I filaments in the IGM. Although the fields are too small to directly affect galaxy formation, they could be the seeds for the magnetic fields observed in galaxies and X-ray clusters today.
If quasars contribute substantially to the ionizing intensity during reionization then several aspects of reionization are modified compared to the case of pure stellar reionization. First, the ionizing radiation emanates from a single, bright point-source inside each host galaxy, and can establish an escape route (H II funnel) more easily than in the case of stars which are smoothly distributed throughout the galaxy (Section 6.1). Second, the hard photons produced by a quasar penetrate deeper into the surrounding neutral gas, yielding a thicker ionization front. Finally, the quasar X-rays catalyze the formation of H2 molecules and allow stars to keep forming in very small halos (Section 3.3).
Oh (2000) showed that star-forming regions may also produce significant X-rays at high redshift. The emission is due to inverse Compton scattering of CMB photons off relativistic electrons in the ejecta, as well as thermal emission by the hot supernova remnant. The spectrum expected from this process is even harder than for typical quasars, and the hard photons photoionize the IGM efficiently by repeated secondary ionizations. The radiation, characterized by roughly equal energy per logarithmic frequency interval, would produce a uniform ionizing intensity and lead to gradual ionization and heating of the entire IGM. Thus, if this source of emission is indeed effective at high redshift, it may have a crucial impact in changing the topology of reionization. Even if stars dominate the emission, the hardness of the ionizing spectrum depends on the initial mass function. At high redshift it may be biased toward massive, efficiently ionizing stars (see Section 4.1.1), but this remains very much uncertain.
Semi-analytic as well as numerical models of reionization depend on an extrapolation of hierarchical models to higher redshifts and lower-mass halos than the regime where the models have been compared to observations. These models have the advantage that they are based on the current CDM paradigm which is supported by a variety of observations of large-scale structure, galaxy clustering, and the CMB. The disadvantage is that the properties of high-redshift galaxies are derived from those of their host halos by prescriptions which are based on low-redshift observations, and these prescriptions will only be tested once abundant data is available on galaxies which formed during the reionization era. An alternative approach to analyzing the possible ionizing sources which brought about reionization is to extrapolate from the observed populations of galaxies and quasars at currently accessible redshifts. This has been attempted, e.g., by Madau et al. (1999) and Miralda-Escudé et al. (2000). The general conclusion is that a high-redshift source population similar to the one observed at z = 3-4 would produce roughly the needed ionizing intensity for reionization. A precise conclusion, however, remains elusive because of the same kinds of uncertainties as those found in the models based on CDM: The typical escape fraction, and the faint end of the luminosity function, are both not well determined even at z = 3-4, and in addition the clumping factor at high redshift must be known in order to determine the importance of recombinations. Future direct observations of the source population at redshifts approaching reionization may help resolve some of these questions.
The sources that reionized hydrogen very likely caused the single
reionization of helium from He1 to He II. Neutral helium is
ionized by photons of 24.6 eV or higher energy, and its recombination rate
is roughly equal to that of hydrogen. On the other hand, the ionization
threshold of He II is 54.4 eV, and fully ionized helium recombines
5 times faster than
hydrogen. This means that for both quasars and
galaxies, the reionization of He II should occur later than the
reionization of hydrogen, even though the number of helium atoms is smaller
than hydrogen by a factor of 13. The lower redshift of He II
reionization makes it more accessible to observations and allows it to
serve in some ways as an observational preview of hydrogen reionization.
The Ly absorption by
intergalactic He II (at wavelength
304Å) has been observed in four quasars at redshifts
2.4 < z < 3.2
(Jakobsen et al. 1994;
Davidsen et al. 1996;
Hogan et al. 1997;
Reimers et al. 1997;
Anderson et al. 1999;
Heap et al. 2000).
The results are consistent among the different quasars, and we
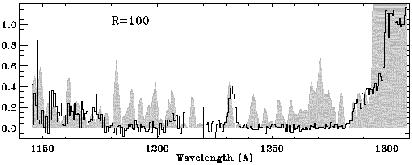
illustrate them here with one particular spectrum. In
Figure 25, adopted from Figure 4 of
Heap et al. (2000),
we show a portion of the spectrum of the z = 3.286 quasar
Q302 - 003, obtained with the Space Telescope
Imaging Spectrograph
on-board the Hubble Space Telescope. The observed spectrum
(solid line) is compared to a simulated spectrum (gray shading) based
on the H I Ly forest
observed in the same quasar. In
deriving the simulated spectrum, Heap et al. assumed a ratio of
He II to H I column densities of 100, and pure turbulent
line broadening. The wavelength range shown in the figure corresponds
to He II Ly in the redshift
range 2.8-3.3.
|
Figure 25.
Ly |
The observed flux shows a clear break short-ward of the quasar emission
line at an observed
= 1300 Å. Relatively
near the quasar, at
= 1285-1300Å, a
shelf of relatively high transmission is
likely evidence of the `proximity effect', in which the emission from
the quasar itself creates a highly ionized local region with a reduced
abundance of absorbing ions. In the region at
= 1240-1280
Å (z = 3.08-3.21), on the other hand, the very low flux level
implies an average optical depth of
 ~ 4.5-5. Another large
region with average
~ 4, a region spanning ~ 100
comoving Mpc along the line of sight, is evident at
= 1180-1210Å
(z = 2.88-2.98). The strong continuous absorption in
these large regions, and the lack of correlation with the observed
H I Ly forest, is evidence
for a He II
Gunn-Peterson absorption trough due to the diffuse IGM. It also
suggests a rather soft UV background with a significant stellar
contribution, i.e., a background that ionizes the diffuse hydrogen
much more thoroughly than He II. Significant emission is
observed in between the two regions of constant high absorption. A
small region around 1216Å is contaminated by geo-coronal
Ly, but the emission at
1230-1235Å apparently corresponds
to a real, distinct gap in the He II abundance, which could be
caused by a local source photo-ionizing a region of radius ~ 10
comoving Mpc. The region at
= 1150-1175Å
(z = 2.78-2.86)
shows a much higher overall transmission level than the regions at
slightly higher redshift. Heap et al. measure an average
= 1.9
in this region, and note that the significant correlation of the
observed spectrum with the simulated one suggests that much of the
absorption is due to a He II
Ly forest while the
low-density IGM provides a relatively low opacity in this region. The
authors conclude that the observed data suggest a sharp opacity break
occurring between z = 3.0 and 2.9, accompanied by a hardening of the UV
ionizing background. However, even the relatively high opacity at z
3 only requires
~ 0.1% of helium atoms not to be fully
ionized, in a region at the mean baryon density. Thus, the overlap
phase of full helium reionization may have occurred significantly
earlier, with the ionizing intensity already fairly uniform but still
increasing with time at z ~ 3.
~ 4.5-5. Another large
region with average
~ 4, a region spanning ~ 100
comoving Mpc along the line of sight, is evident at
= 1180-1210Å
(z = 2.88-2.98). The strong continuous absorption in
these large regions, and the lack of correlation with the observed
H I Ly forest, is evidence
for a He II
Gunn-Peterson absorption trough due to the diffuse IGM. It also
suggests a rather soft UV background with a significant stellar
contribution, i.e., a background that ionizes the diffuse hydrogen
much more thoroughly than He II. Significant emission is
observed in between the two regions of constant high absorption. A
small region around 1216Å is contaminated by geo-coronal
Ly, but the emission at
1230-1235Å apparently corresponds
to a real, distinct gap in the He II abundance, which could be
caused by a local source photo-ionizing a region of radius ~ 10
comoving Mpc. The region at
= 1150-1175Å
(z = 2.78-2.86)
shows a much higher overall transmission level than the regions at
slightly higher redshift. Heap et al. measure an average
= 1.9
in this region, and note that the significant correlation of the
observed spectrum with the simulated one suggests that much of the
absorption is due to a He II
Ly forest while the
low-density IGM provides a relatively low opacity in this region. The
authors conclude that the observed data suggest a sharp opacity break
occurring between z = 3.0 and 2.9, accompanied by a hardening of the UV
ionizing background. However, even the relatively high opacity at z
3 only requires
~ 0.1% of helium atoms not to be fully
ionized, in a region at the mean baryon density. Thus, the overlap
phase of full helium reionization may have occurred significantly
earlier, with the ionizing intensity already fairly uniform but still
increasing with time at z ~ 3.
The properties of helium reionization have been investigated numerically by a number of authors. Zheng & Davidsen (1995) modeled the He II proximity effect, and a number of authors (Miralda-Escudé et al. 1996; Croft et al. 1997; Zhang et al. 1998) used numerical simulations to show that the observations generally agree with cold dark matter models. They also found that helium absorption particularly tests the properties of under-dense voids which produce much of the He II opacity but little opacity in H I. According to the semi-analytic model of inhomogeneous reionization of Miralda-Escudé, Haehnelt, & Rees (2000; see also Section 6.3.1), the total emissivity of observed quasars at redshift 3 suffices to completely reionize helium before z = 3. They find that the observations at z ~ 3 can be reproduced if a population of low-luminosity sources, perhaps galaxies, has ionized the low-density IGM up to an overdensity of around 12, with luminous quasars creating the observed gaps of transmitted flux.
The conclusion that an evolution of the ionization state of helium has
been observed is also strengthened by several indirect lines of evidence.
Songaila & Cowie
(1996)
and Songaila (1998)
found a rapid increase in the Si4/C4 ratio with decreasing redshift
at z = 3, for intermediate column density hydrogen
Ly
absorption lines. They interpreted this evolution as a sudden
hardening below z = 3 of the spectrum of the ionizing background.
Boksenberg et al. (1998)
also found an increase in the Si4/C4 ratio, but their data implied a much more
gradual increase from z = 3.8 to z = 2.2.
The full reionization of helium due to a hard ionizing spectrum should
also heat the IGM to 20,000 K or higher, while the IGM can only reach
~ 10,000 K during a reionization of hydrogen alone (although a
temperature of ~ 15,000 K may be reached due to Compton heating by
the hard X-ray background:
Madau & Efstathiou
1999).
This increase in
temperature can serve as an observational probe of helium
reionization, and it should also increase the suppression of dwarf
galaxy formation (Section 6.5). The temperature of
the IGM can be
measured by searching for the smallest line-widths among hydrogen
Ly absorption lines
(Schaye et al. 1999).
In general, bulk
velocity gradients contribute to the line width on top of thermal
velocities, but a lower bound on the width is set by thermal
broadening, and the narrowest lines can be used to measure the
temperature. Several different measurements
(Ricotti et al. 2000;
Schaye et al. 2000;
Bryan & Machacek 2000;
McDonald et al. 2000)
have found a nearly isothermal IGM at a temperature of ~ 20,000 K
at z = 3, higher than expected in ionization equilibrium and
suggestive of photo-heating due to ongoing reionization of
helium. However, the measurement errors remain too large for a firm
conclusion about the redshift evolution of the IGM temperature or its
equation of state.
Clearly, the reionization of helium is already a rich phenomenological subject. Our knowledge will benefit from measurements of increasing accuracy, made toward many more lines of sight, and extended to higher redshift. New ways to probe helium will also be useful. For example, Miralda-Escudé (2000) has suggested that continuum He II absorption in soft X-rays can be used to determine the He II fraction along the line of sight, although the measurement requires an accurate subtraction of the Galactic contribution to the absorption, based on the Galactic H I column density as determined by 21 cm maps.
6.4. Photo-evaporation of Gaseous Halos After Reionization
The end of the reionization phase transition resulted in the emergence
of an intense UV background that filled the universe and heated the
IGM to temperatures of ~ 1-2 × 10⁴K (see the previous
section). After ionizing the rarefied IGM in the voids and filaments
on large scales, the cosmic UV background penetrated the denser
regions associated with the virialized gaseous halos of the first
generation of objects. A major fraction of the collapsed gas had been
incorporated by that time into halos with a virial temperature
104K,
where the lack of atomic cooling prevented the formation of
galactic disks and stars or quasars. Photoionization heating by the
cosmic UV background could then evaporate much of this gas back into
the IGM. The photo-evaporating halos, as well as those halos which did
retain their gas, may have had a number of important consequences just
after reionization as well as at lower redshifts.
In this section we focus on the process by which gas that had already
settled into virialized halos by the time of reionization was
evaporated back into the IGM due to the cosmic UV background. This
process was investigated by
Barkana & Loeb (1999)
using semi-analytic
methods and idealized numerical calculations. They first considered an
isolated spherical, centrally-concentrated dark matter halo containing
gas. Since most of the photo-evaporation occurs at the end of overlap,
when the ionizing intensity builds up almost instantaneously, a sudden
illumination by an external ionizing background may be assumed.
Self-shielding of the gas implies that the halo interior sees a
reduced intensity and a harder spectrum, since the outer gas layers
preferentially block photons with energies just above the Lyman limit.
It is useful to parameterize the external radiation field by a
specific intensity per unit frequency,
,
| (78) |
where L is the Lyman
limit frequency, and J21 is the
intensity at L
expressed in units of 10-21 erg
cm-2 s-1 sr-1Hz-1. The intensity
is normalized to an expected post-reionization value of around unity
for the ratio of ionizing photon density to the baryon density.
Different power laws can be used to represent either quasar spectra
( ~ 1.8) or stellar spectra
( ~ 5).
Once the gas is heated throughout the halo, some fraction of it
acquires a sufficiently high temperature that it becomes unbound. This
gas expands due to the resulting pressure gradient and eventually
evaporates back into the IGM. The pressure gradient force (per unit
volume) kB
 (T / µ
mp) competes with the gravitational force of
GM /
r2. Due to the density gradient, the ratio between the
pressure force and the gravitational force is roughly equal to the ratio
between the thermal energy ~ kBT and the
gravitational binding energy
~ µ mpGM/r (which is
~ kBTvir at the virial radius
rvir) per particle. Thus, if the kinetic energy exceeds the
potential energy (or roughly if
T > Tvir), the repulsive pressure
gradient force exceeds the attractive gravitational force and expels the
gas on a dynamical time (or faster for halos with
T >> Tvir).
(T / µ
mp) competes with the gravitational force of
GM /
r2. Due to the density gradient, the ratio between the
pressure force and the gravitational force is roughly equal to the ratio
between the thermal energy ~ kBT and the
gravitational binding energy
~ µ mpGM/r (which is
~ kBTvir at the virial radius
rvir) per particle. Thus, if the kinetic energy exceeds the
potential energy (or roughly if
T > Tvir), the repulsive pressure
gradient force exceeds the attractive gravitational force and expels the
gas on a dynamical time (or faster for halos with
T >> Tvir).
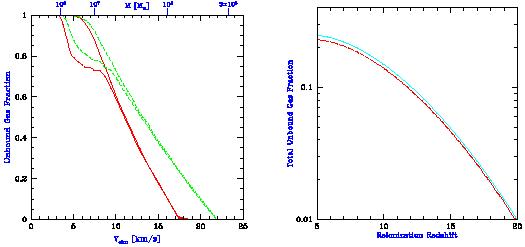
The left panel of Figure 26 (adopted from Figure 3 of
Barkana & Loeb 1999)
shows the fraction of gas within the virial
radius which becomes unbound after reionization, as a function of the
total halo circular velocity, with halo masses at z = 8 indicated at
the top. The two pairs of curves correspond to spectral index
= 5 (solid) or
= 1.8 (dashed). In each pair, a
calculation which assumes an optically-thin halo leads to the upper
curve, but including radiative transfer and self-shielding modifies
the result to the one shown by the lower curve. In each case
self-shielding lowers the unbound fraction, but it mostly affects only
a neutral core containing ~ 30% of the gas. Since high energy
photons above the Lyman limit penetrate deep into the halo and heat
the gas efficiently, a flattening of the spectral slope from
= 5 to
= 1.8 raises the unbound
gas fraction. This
Figure is essentially independent of redshift if plotted in terms of
circular velocity, but the conversion to a corresponding mass does
vary with redshift. The characteristic circular velocity where most of
the gas is lost is ~ 10-15 km s-1, but clearly the
effect of photo-evaporation is gradual, going from total gas removal
down to no effect over a range of a factor of ~ 100 in halo mass.
|
Figure 26.
Effect of photo-evaporation on individual halos and on the
overall halo population. The left panel shows the unbound gas fraction
(within the virial radius) versus total halo velocity dispersion or
mass, adopted from Figure 3 of
Barkana & Loeb
(1999).
The two pairs of curves correspond to spectral index
|
Given the values of the unbound gas fraction in halos of different masses, the Press-Schechter mass function (Section 2.4) can be used to calculate the total fraction of the IGM which goes through the process of accreting onto a halo and then being recycled into the IGM at reionization. The low-mass cutoff in this sum over halos is given by the lowest mass halo in which gas has assembled by the reionization redshift. This mass can be estimated by the linear Jeans mass MJ in equation (41) in Section 3.1. The Jeans mass does not in general precisely equal the limiting mass for accretion (see the discussion in the next section). Indeed, at a given redshift some gas can continue to fall into halos of lower mass than the Jeans mass at that redshift. On the other hand, the larger Jeans mass at higher redshifts means that a time-averaged Jeans mass may be more appropriate, as indicated by the filtering mass. In practice, the Jeans mass is sufficiently accurate since at z ~ 10-20 it agrees well with the values found in the numerical spherical collapse calculations of Haiman, Thoul, & Loeb (1996).
The right panel of Figure 26 (adopted from Figure 7 of
Barkana & Loeb 1999)
shows the total fraction of gas in the universe
which evaporates from halos at reionization, versus the reionization
redshift. The solid line assumes a spectral index
= 1.8, and
the dotted line assumes =
5, showing that the result is
insensitive to the spectrum. Even at high redshift, the amount of gas
which participates in photo-evaporation is significant, which suggests
a number of possible implications as discussed below. The gas fraction
shown in the figure represents most (~ 60-80% depending on
the redshift) of the collapsed fraction before reionization, although
some gas does remain in more massive halos.
The photo-evaporation of gas out of large numbers of halos may have interesting implications. First, gas which falls into halos and is expelled at reionization attains a different entropy than if it had stayed in the low-density IGM. The resulting overall reduction in the entropy is expected to be small - the same as would be produced by reducing the temperature of the entire IGM by a factor of ~ 1.5 - but localized effects near photo-evaporating halos may be more significant. Furthermore, the resulting ~ 20 km s-1 outflows induce small-scale fluctuations in peculiar velocity and temperature. These outflows are usually well below the resolution limit of most numerical simulations, but some outflows were resolved in the simulation of Bryan et al. (1998). The evaporating halos may consume a significant number of ionizing photons in the post-overlap stage of reionization (e.g., Haiman, Abel, & Madau 2000), but a definitive determination requires detailed simulations which include the three-dimensional geometry of source halos and sink halos.
Although gas is quickly expelled out of the smallest halos,
photo-evaporation occurs more gradually in larger halos which retain
some of their gas. These surviving halos initially expand but they
continue to accrete dark matter and to merge with other halos. These
evaporating gas halos could contribute to the high column density end
of the Ly forest
(Bond, Szalay, &
Silk 1988).
Abel & Mo (1998)
suggested that, based on the expected number of surviving
halos, a large fraction of the Lyman limit systems at z ~ 3 may
correspond to mini-halos that survived reionization. Surviving halos
may even have identifiable remnants in the present universe, as
discussed in Section 9.3. These ideas thus
offer the possibility
that a population of halos which originally formed prior to
reionization may correspond almost directly to several populations
that are observed much later in the history of the universe. However,
the detailed dynamics of photo-evaporating halos are complex, and
detailed simulations are required to confirm these ideas.
Photo-evaporation of a gas cloud has been followed in a two dimensional
simulation with radiative transfer, by
Shapiro & Raga
(2000).
They found that an evaporating halo would indeed appear in absorption as a
damped Ly system initially,
and as a weaker absorption system
subsequently. Future simulations will clarify the contribution to
quasar absorption lines of the entire population of photo-evaporating
halos.
6.5. Suppression of the Formation of Low Mass Galaxies
At the end of overlap, the cosmic ionizing background increased
sharply, and the IGM was heated by the ionizing radiation to a
temperature
104 K. Due to the substantial increase in the IGM
temperature, the intergalactic Jeans mass increased dramatically,
changing the minimum mass of forming galaxies
(Rees 1986;
Efstathiou 1992;
Gnedin & Ostriker
1997;
Miralda-Escudé
& Rees 1998).
Gas infall depends sensitively on the Jeans mass. When a halo more
massive than the Jeans mass begins to form, the gravity of its dark
matter overcomes the gas pressure. Even in halos below the Jeans mass,
although the gas is initially held up by pressure, once the dark
matter collapses its increased gravity pulls in some gas
(Haiman, Thoul, &
Loeb 1996).
Thus, the Jeans mass is generally higher than
the actual limiting mass for accretion. Before reionization, the IGM
is cold and neutral, and the Jeans mass plays a secondary role in
limiting galaxy formation compared to cooling. After reionization, the
Jeans mass is increased by several orders of magnitude due to the
photoionization heating of the IGM, and hence begins to play a
dominant role in limiting the formation of stars. Gas infall in a
reionized and heated universe has been investigated in a number of
numerical simulations.
Thoul & Weinberg
(1996)
inferred, based on a
spherically-symmetric collapse simulation, a reduction of ~ 50%
in the collapsed gas mass due to heating, for a halo of circular
velocity Vc ~ 50 km s-1 at
z = 2, and a complete
suppression of infall below Vc ~ 30 km
s-1.
Kitayama & Ikeuchi
(2000)
also performed spherically-symmetric simulations but
included self-shielding of the gas, and found that it lowers the
circular velocity thresholds by ~ 5 km s-1. Three
dimensional numerical simulations
(Quinn, Katz, &
Efstathiou 1996;
Weinberg, Hernquist,
& Katz 1997;
Navarro & Steinmetz
1997)
found a significant suppression of gas infall in even larger halos
(Vc ~ 75 km s-1), but this was
mostly due to a suppression of late infall at z
2.
When a volume of the IGM is ionized by stars, the gas is heated to a temperature TIGM ~ 104 K. If quasars dominate the UV background at reionization, their harder photon spectrum leads to TIGM ~ 2 × 10⁴ K. Including the effects of dark matter, a given temperature results in a linear Jeans mass (see Section 3.1) corresponding to a halo circular velocity of
| (79) |
where we used equation (25) and assumed
µ = 0.6. In halos with Vc >
VJ, the gas fraction in infalling gas
equals the universal mean of
b /
m, but gas infall is
suppressed in smaller halos. Even for a small dark matter halo, once
it collapses to a virial overdensity of
 c /
mz
relative to
the mean, it can pull in additional gas. A simple estimate of the
limiting circular velocity, below which halos have essentially no gas
infall, is obtained by substituting the virial overdensity for the
mean density in the definition of the Jeans mass. The resulting
estimate is
c /
mz
relative to
the mean, it can pull in additional gas. A simple estimate of the
limiting circular velocity, below which halos have essentially no gas
infall, is obtained by substituting the virial overdensity for the
mean density in the definition of the Jeans mass. The resulting
estimate is
| (80) |
This value is in rough agreement with the numerical simulations mentioned above (see also the related discussion in Section 3.2).
Although the Jeans mass is closely related to the rate of gas infall at a given time, it does not directly yield the total gas residing in halos at a given time. The latter quantity depends on the entire history of gas accretion onto halos, as well as on the merger histories of halos, and an accurate description must involve a time-averaged Jeans mass. Gnedin (2000b) showed that the gas content of halos in simulations is well fit by an expression which depends on the filtering mass, a particular time-averaged Jeans mass (Gnedin & Hui 1998; see also Section 3.1). Gnedin (2000b) calculated the Jeans and filtering masses using the mean temperature in the simulation to define the sound speed, and found the following fit to the simulation results:
| (81) |
where  g is
the average gas mass of all objects with a total mass M,
fb =
b /
m is the
universal baryon fraction, and the
characteristic mass MC is the total mass of objects which on
average retain 50% of their gas mass. The characteristic mass was
well fit by the filtering mass at a range of redshifts from z = 4 up
to z ~ 15.
g is
the average gas mass of all objects with a total mass M,
fb =
b /
m is the
universal baryon fraction, and the
characteristic mass MC is the total mass of objects which on
average retain 50% of their gas mass. The characteristic mass was
well fit by the filtering mass at a range of redshifts from z = 4 up
to z ~ 15.
4 The recombination rate depends on the number density of electrons, and in using equation (64) we are neglecting the small contribution caused by partially or fully ionized helium. Back.
 rmax3 / 3 [with
rmax given in equation (73)], and the time is
measured after an instantaneous starburst which produces ionizing photons
according to equation (74). We consider a source turning on at
z = 10 (solid curves) or z = 15 (dashed curves), with
three cases for each:
no recombinations, C = 1, and C = 10, in order from top to
bottom. The
no-recombination curve is identical for the different source redshifts.
rmax3 / 3 [with
rmax given in equation (73)], and the time is
measured after an instantaneous starburst which produces ionizing photons
according to equation (74). We consider a source turning on at
z = 10 (solid curves) or z = 15 (dashed curves), with
three cases for each:
no recombinations, C = 1, and C = 10, in order from top to
bottom. The
no-recombination curve is identical for the different source redshifts.