


B.5.4. Results: The Hubble Constant and Dark Matter
With our understanding of the theory and observations of the lenses we will now explore their implications for H0. We focus on the "simple" lenses PG1115+080, SBS1520+530, B1600+434, and HE2149-2745. We only comment on the interpretation of the HE1104-1805 delay because the measurement is too recent to have been interpreted carefully. We will briefly discuss the more complicated systems B0218+357, RXJ0911+0551, Q0957+561, and B1608+656, and we will not discuss the systems with problematic time delays or astrometry.
The most common, simple, realistic model of a lens consists of a singular
isothermal ellipsoid (SIE) in an external (tidal) shear field (see
Section B.4).
The model has 7 parameters (the lens position, mass, ellipticity, major axis
orientation for the SIE, and the shear amplitude and orientation).
It has many degrees of freedom associated with the angular
structure of the potential, but the radial structure is fixed with
< >
>
 1/2. For comparison, a
two-image (four-image) lens
supplies 5 (13) constraints on any model of the potential: 2 (6) from the
relative positions of the images, 1 (3) from the flux ratios of the images,
0 (2) from the inter-image time delay ratios, and 2 from the lens position.
With the addition of extra components (satellites/clusters) for the
more complex lenses, this basic model provides a good fit to all the
time delay lenses except Q0957+561. Although a naive counting of the
degrees of freedom (Ndof = - 2 and 6, respectively)
suggests that estimates of H0 would be under
constrained for two-image lenses and
over constrained for four-image lenses, the uncertainties are actually
dominated by those of the time delay measurements and the astrometry in
both cases. This is what we expect from
Section B.5.1 - the
model has no degrees of freedom that change
<> or
1/2. For comparison, a
two-image (four-image) lens
supplies 5 (13) constraints on any model of the potential: 2 (6) from the
relative positions of the images, 1 (3) from the flux ratios of the images,
0 (2) from the inter-image time delay ratios, and 2 from the lens position.
With the addition of extra components (satellites/clusters) for the
more complex lenses, this basic model provides a good fit to all the
time delay lenses except Q0957+561. Although a naive counting of the
degrees of freedom (Ndof = - 2 and 6, respectively)
suggests that estimates of H0 would be under
constrained for two-image lenses and
over constrained for four-image lenses, the uncertainties are actually
dominated by those of the time delay measurements and the astrometry in
both cases. This is what we expect from
Section B.5.1 - the
model has no degrees of freedom that change
<> or
 , so there
will be little contribution to the uncertainties in H0
from the model for the potential.
, so there
will be little contribution to the uncertainties in H0
from the model for the potential.
If we use a model that includes parameters to control
the radial density profile (i.e.,
<>),
for example by adding a halo truncation radius a to the SIS profile
[the pseudo-Jaffe model,

 r-2(r2 +
a2)-1; e.g.,
Impey et al. 1998;
Burud et al. 2002a],
5
then we find the expected correlation between a and
H0 - as we make the
halo more concentrated (smaller a), the estimate of
H0 rises from the value for the SIS profile
(<> = 1/2 as
a
r-2(r2 +
a2)-1; e.g.,
Impey et al. 1998;
Burud et al. 2002a],
5
then we find the expected correlation between a and
H0 - as we make the
halo more concentrated (smaller a), the estimate of
H0 rises from the value for the SIS profile
(<> = 1/2 as
a 
 )
to the value for a point mass
(<> = 0 as
a 0),
with the fastest changes occurring when a is similar
to the Einstein radius of the lens. We show an example of such
a model for PG1115+080 in Figure B.36.
This case is somewhat
more complicated than a pure pseudo-Jaffe model because there is an
additional contribution to the surface
density from the group to which the lens galaxy belongs.
As long as the structure of the radial density profile is
fixed (constant a), the uncertainties are again dominated by the
uncertainties in the time delay. Unfortunately, the goodness of fit,
)
to the value for a point mass
(<> = 0 as
a 0),
with the fastest changes occurring when a is similar
to the Einstein radius of the lens. We show an example of such
a model for PG1115+080 in Figure B.36.
This case is somewhat
more complicated than a pure pseudo-Jaffe model because there is an
additional contribution to the surface
density from the group to which the lens galaxy belongs.
As long as the structure of the radial density profile is
fixed (constant a), the uncertainties are again dominated by the
uncertainties in the time delay. Unfortunately, the goodness of fit,
 2(a),
shows too little dependence on a to determine
H0 uniquely. In general, two-image lenses have too
few constraints, and the extra constraints supplied by a four-image
lens constrain the angular structure rather than the
radial structure of the potential.
This basic problem holds for all
existing models of the current sample of time delay lenses.
2(a),
shows too little dependence on a to determine
H0 uniquely. In general, two-image lenses have too
few constraints, and the extra constraints supplied by a four-image
lens constrain the angular structure rather than the
radial structure of the potential.
This basic problem holds for all
existing models of the current sample of time delay lenses.
 |
Figure B.36. H0 estimates
for PG1115+080. The lens galaxy is
modeled as an ellipsoidal pseudo-Jaffe model,
|
The inability of the present time delay lenses to directly constrain the
radial density profile is the major problem for using them to determine
H0. Fortunately, it is a consequence of the available
data on the current sample rather than a fundamental limitation.
It is, however, a simple trade-off - models with less dark matter
(lower <>, more
centrally concentrated densities) produce higher
Hubble constants than those with more dark matter.
We do have some theoretical limits on the value of
<>. In particular, we
can be confident that the surface density is bounded by
two limiting models. The mass distribution should not be more compact
than the luminosity distribution, so a constant mass-to-light ratio
(M / L)
model should set a lower limit on
<>
 <>M/L
0.2, and
an upper limit on estimates of H0. We are also confident
that the typical lens should not have a rising rotation curve at 1-2
optical effective radii from the center of the lens galaxy.
Thus, the SIS model is probably the least concentrated reasonable
model, setting an upper bound on
<>
<>M/L
0.2, and
an upper limit on estimates of H0. We are also confident
that the typical lens should not have a rising rotation curve at 1-2
optical effective radii from the center of the lens galaxy.
Thus, the SIS model is probably the least concentrated reasonable
model, setting an upper bound on
<>
 <>SIS =
1/2, and a lower limit on estimates of H0.
Figure B.37
shows joint estimates of H0 from the four simple
lenses for these two limiting mass distributions (Kochanek 2003b). The
results for the individual lenses are mutually consistent and are
unchanged by the new
0.149 ± 0.004 day delay for the A1-A2 images
in PG1115+080 (Chartas
[2003]).
For galaxies with isothermal profiles we find
H0 = 48 ± 3 km s-1
Mpc-1, and for galaxies with constant M / L
we find H0 = 71 ± 3 km s-1
Mpc-1. While our best prior estimate for the
mass distribution is the isothermal profile (see
Section B.4.6),
the lens galaxies would have to have constant M / L to match
Key Project estimate of
H0 = 72 ± 8 km s-1 Mpc-1
(Freedman et al.
[2001])
or the WMAP estimate of
H0 = 72 ± 5 km s-1 Mpc-1
for a flat universe with a cosmological constant (Spergel et al.
[2003]).
<>SIS =
1/2, and a lower limit on estimates of H0.
Figure B.37
shows joint estimates of H0 from the four simple
lenses for these two limiting mass distributions (Kochanek 2003b). The
results for the individual lenses are mutually consistent and are
unchanged by the new
0.149 ± 0.004 day delay for the A1-A2 images
in PG1115+080 (Chartas
[2003]).
For galaxies with isothermal profiles we find
H0 = 48 ± 3 km s-1
Mpc-1, and for galaxies with constant M / L
we find H0 = 71 ± 3 km s-1
Mpc-1. While our best prior estimate for the
mass distribution is the isothermal profile (see
Section B.4.6),
the lens galaxies would have to have constant M / L to match
Key Project estimate of
H0 = 72 ± 8 km s-1 Mpc-1
(Freedman et al.
[2001])
or the WMAP estimate of
H0 = 72 ± 5 km s-1 Mpc-1
for a flat universe with a cosmological constant (Spergel et al.
[2003]).
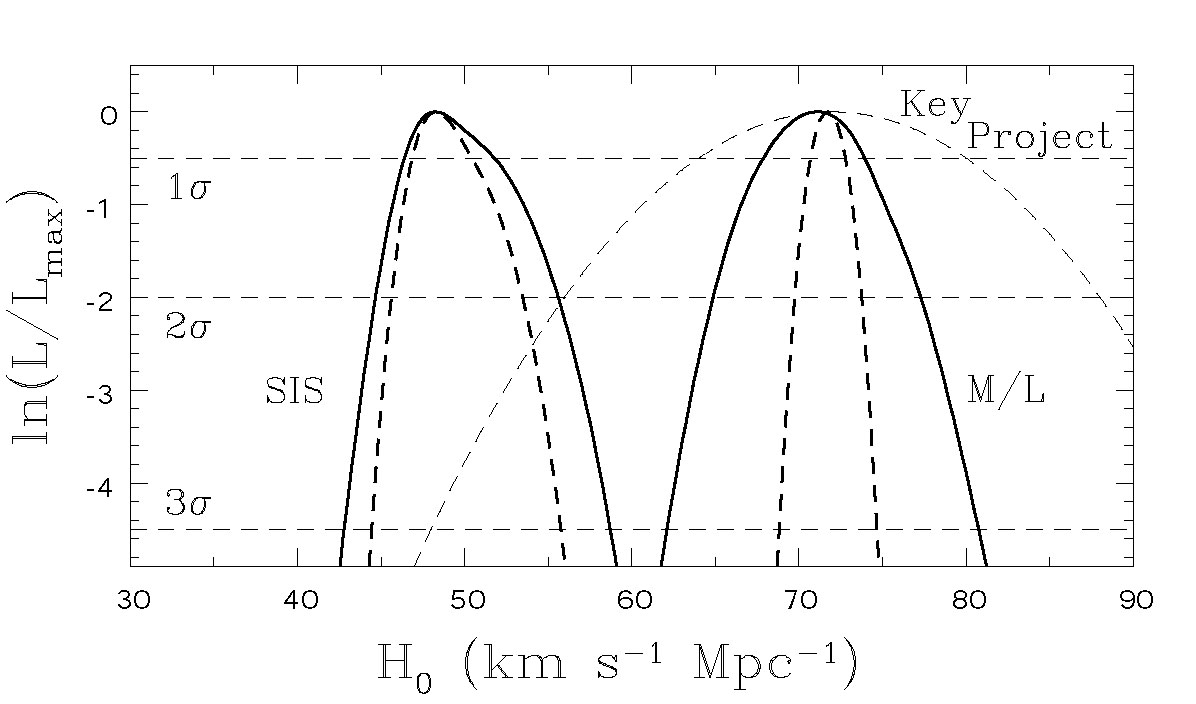 |
Figure B.37. H0 likelihood
distributions. The curves show the joint
likelihood functions for H0 using the four simple
lenses PG1115+080, SBS1520+530, B1600+434, and HE2149-2745 and assuming either an SIS model (high
< |
The difference between these two limits is entirely explained by the
differences in
<> and
between the
SIS and constant M / L models. In fact, it is possible to
reduce the H0 estimates
for each simple lens to an approximation formula,
H0 = A(1 -
<>) +
B<>( - 1). The
coefficients, A and
| B|  A
/ 10, are derived from the image positions and the time delay using
the simple theory from Section B.5.1.
These approximations reproduce numerical results using ellipsoidal
lens models to accuracies of 3 km s-1 Mpc-1 (Kochanek
[2002a]).
For example, in Figure B.36 we also show
the estimate of
H0 computed based on the simple theory of
Section B.5.1 and the annular surface density
(<>) and slope
() of the
numerical models. The agreement
with the full numerical solutions is excellent, even though the
numerical models include both the ellipsoidal lens galaxy and
a group. No matter what the mass distribution is, the five lenses
PG1115+080, SBS1520+530, B1600+434, PKS1830-211,
6 and HE2149-2745 have very
similar dark matter halos. For a fixed slope
, the five
systems are consistent with a common value for the surface density of
A
/ 10, are derived from the image positions and the time delay using
the simple theory from Section B.5.1.
These approximations reproduce numerical results using ellipsoidal
lens models to accuracies of 3 km s-1 Mpc-1 (Kochanek
[2002a]).
For example, in Figure B.36 we also show
the estimate of
H0 computed based on the simple theory of
Section B.5.1 and the annular surface density
(<>) and slope
() of the
numerical models. The agreement
with the full numerical solutions is excellent, even though the
numerical models include both the ellipsoidal lens galaxy and
a group. No matter what the mass distribution is, the five lenses
PG1115+080, SBS1520+530, B1600+434, PKS1830-211,
6 and HE2149-2745 have very
similar dark matter halos. For a fixed slope
, the five
systems are consistent with a common value for the surface density of
 |
(B.99) |
where H0 = 100h km s-1
Mpc-1 and there is an upper limit of
 0.07 on the
intrinsic scatter of
<>. Thus,
time delay lenses provide a new window into the structure and homogeneity
of dark matter halos, regardless of the actual value of
H0.
0.07 on the
intrinsic scatter of
<>. Thus,
time delay lenses provide a new window into the structure and homogeneity
of dark matter halos, regardless of the actual value of
H0.
There is an enormous range of parametric models that can illustrate
how the extent of the halo affects
<> and hence
H0 - the
pseudo-Jaffe model we used above is only one example. It is
useful, however, to use a physically motivated model where the lens
galaxy is embedded in a standard NFW
(Navarro, Frenk, & White 1996)
profile halo as we discussed at the end of
Section B.4.1.
The lens galaxy consists of the baryons that have cooled to form stars,
so the mass of the visible galaxy can be parameterized using the cold baryon
fraction fb, cold of the halo, and for these CDM halo
models the value of
<> is controlled
by the cold baryon fraction (Kochanek
[2003a]).
A constant M/L model is the limit fb, cold
1 (with
<>
0.2,
3).
Since the baryonic mass fraction of a CDM halo should not exceed
the global fraction of
fb
0.17 ± 0.03 (e.g., Spergel et al.
[2003]),
we cannot use constant M / L models without also
abandoning CDM. As we reduce
fb, cold, we are adding mass to an extended
halo around the lens, leading to an increase in
<> and a decrease
in . For
fb, cold
0.02 the model closely
resembles the SIS model
(<>
1/2,
2). If we reduce
fb, cold
further, the mass distribution begins to approach that of the NFW halo
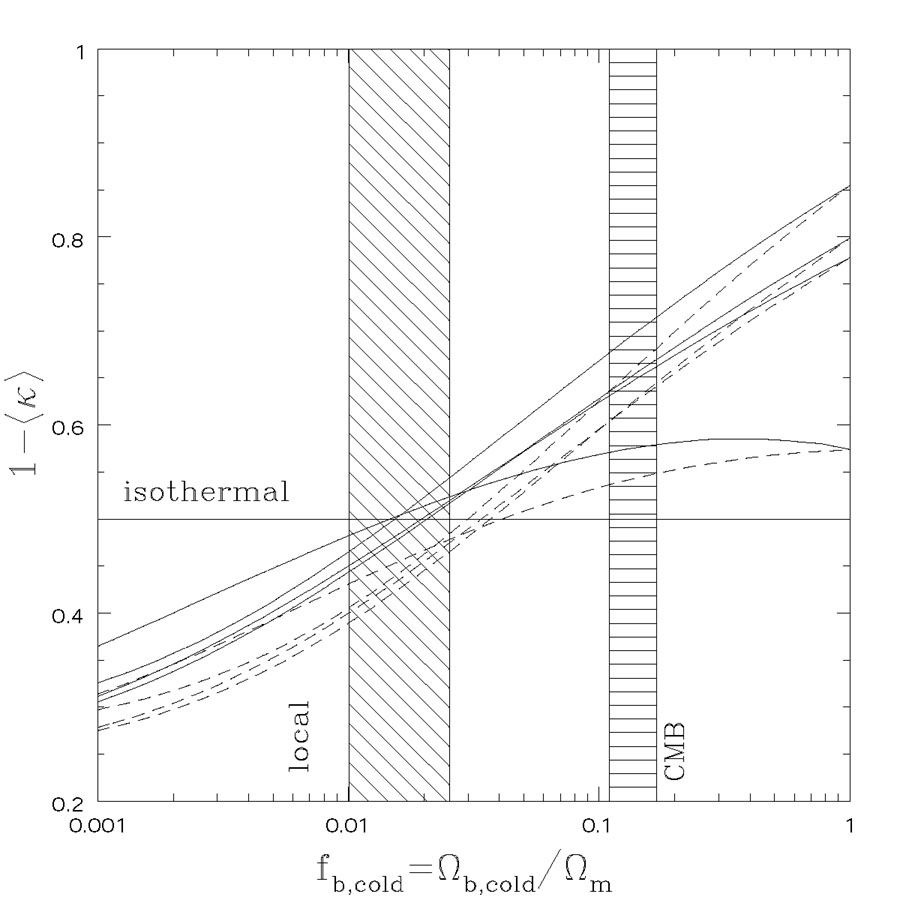
without any cold baryons. Figure B.38 shows
how <> and
H0 depend on
fb, cold for PG1115+080, SBS1520+530, B1600+434 and
HE2149-2745. When fb, cold
0.02, the CDM models
have parameters very similar to the SIS model, and we obtain a very
similar estimate
of H0 = 52 ± 6 km s-1 Mpc-1
(95% confidence). If all baryons cool, and
fb, cold = fb, then we obtain
H0 = 65 ± 6 km s-1 Mpc-1
(95% confidence), which is still lower than the Key Project estimates.
 |
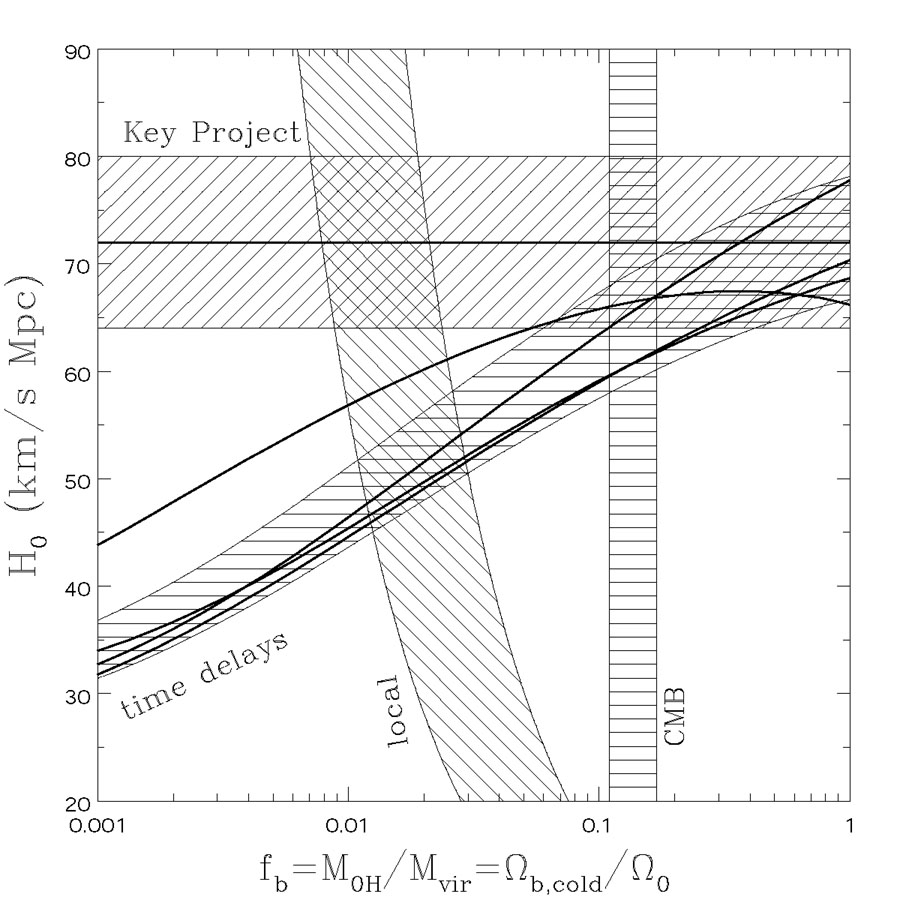 |
Figure B.38. H0 in CDM
halo models. The top panel shows
1 - < |
We excluded the lenses requiring significantly
more complicated models with multiple lens galaxies or very strong
perturbations from clusters. If we have yet
to reach a consensus on the mass distribution of relatively isolated
lenses, it seems premature to extend the discussion to still more
complicated systems. We can, however, show that the clusters lenses
require significant contributions to
<> from the
cluster in
order to produce the same H0 as the more isolated systems.
As we discussed in Section B.2 the three
more complex systems are RXJ0911+0551, Q0957+561 and B1608+656.
RXJ0911+0551 is very strongly perturbed by the
nearby X-ray cluster (Morgan et al.
[2001];
Hjorth et al.
[2002]).
Kochanek
([2003b])
found
H0 = 49 ± 5 km s-1 Mpc-1 if
the primary lens and its satellite were isothermal and
H0 = 67 ± 5 km s-1 Mpc-1 if
they had constant mass-to-light ratios. The higher value of
H0 = 71 ± 4 km s-1 Mpc-1
obtained by Hjorth et al.
([2002])
can be understood by combining
Section B.5.1 and
Section B.5.2
with the differences in the models. In particular, Hjorth et al.
([2002])
truncated the halo of the primary lens near the Einstein radius
and used a lower mass cluster, both of which lower
<> and
raise H0. The Hjorth et al.
([2002])
models also included many
more cluster galaxies assuming fixed masses and halo sizes.
Q0957+561 is a special case because the primary lens galaxy is the brightest cluster galaxy and it lies nearly at the cluster center (Keeton et al. [2000]; Chartas et al. [2002]). As a result, the lens modeling problems are particularly severe, and Keeton et al. ([2000]) found that all previous models (most recently, Barkana et al. [1999]; Bernstein & Fischer [1999]; and Chae [1999], see Section B.4.6) were incompatible with the observed geometry of the lensed host galaxy. While Keeton et al. ([2000]) found models consistent with the structure of the lensed host, they covered a range of almost ± 25% in their estimates of H0. A satisfactory treatment of this lens remains elusive.
HE1104-1805 has the most recently measured time
delay (Ofek & Maoz
[2003],
Wyrzykowski et al.
[2003]).
Given the
 t = 161
± 7 day delay,
a standard SIE model of this system predicts a very high
H0 90
km s-1 Mpc-1. The geometry of this system and the
fact that the inner image is brighter than the outer image both
suggest that HE1104-1805 lies in an anomalously high tidal shear
field, while the standard model includes a prior to keep the
external shear small. A prior is needed because a two-image lens
supplies too few constraints to determine both the
ellipticity of the main lens and the external shear simultaneously.
Since the images and the lens in HE1104-1805 are nearly collinear,
the anomalous H0 estimate for the standard model may be an
example of the shear degeneracy we briefly mentioned in
Section B.5.1.
At present the model surveys needed to understand the new delay
have not been made. Observations of the geometry of the host
galaxy Einstein ring will resolve any ambiguities due to the shear
in the near future (see Section B.10).
t = 161
± 7 day delay,
a standard SIE model of this system predicts a very high
H0 90
km s-1 Mpc-1. The geometry of this system and the
fact that the inner image is brighter than the outer image both
suggest that HE1104-1805 lies in an anomalously high tidal shear
field, while the standard model includes a prior to keep the
external shear small. A prior is needed because a two-image lens
supplies too few constraints to determine both the
ellipticity of the main lens and the external shear simultaneously.
Since the images and the lens in HE1104-1805 are nearly collinear,
the anomalous H0 estimate for the standard model may be an
example of the shear degeneracy we briefly mentioned in
Section B.5.1.
At present the model surveys needed to understand the new delay
have not been made. Observations of the geometry of the host
galaxy Einstein ring will resolve any ambiguities due to the shear
in the near future (see Section B.10).
The lens B1608+656 consists of two interacting galaxies, and, as we discussed in Section B.2, this leads to a greatly increased parameter space. Fassnacht et al. ([2002]) used SIE models for the two galaxies to find H0 = 61 - 65 km s-1 Mpc-1, depending on whether the lens galaxy positions are taken from the H-band or I-band lens HST images (the statistical errors are negligible). The position differences are probably created by extinction effects from the dust in the lens galaxies. Like isothermal models of the "simple" lenses, the H0 estimate is below local values, but the disagreement is smaller. These models correctly match the observed time delay ratios. Koopmans et al. ([2003]) obtain a still higher estimate of H0 = 75 ± 7 km s-1 Mpc-1 largely because the lens galaxy positions shift after they include extinction corrections. They use a foreground screen model to make the extinction corrections, which is a better approximation than no extinction corrections, but is unlikely allow precise correction in a system like B1608+656 where the dust and stars are mixed and there is no simple relation between color excess and optical depth (e.g. Witt, Thronson & Capuano [1992]).
Despite recent progress both in modeling the VLBI structure (Wucknitz et al.
[2004])
and obtaining deep images (York et al.
[2004])
it is unclear whether B0218+357 has escaped its problems with astrometry
and models. While York et al.
([2004])
have clearly measured the position of the lens galaxy,
the dependence of the position on the choice of the PSF model remains a
significant source of uncertainty for estimates of
H0. Models of the system using
power law models find a slope very close to isothermal
= 2.04 ± 0.02
(
r-). Unfortunately, these models have too few degrees
of freedom given the small astrometric uncertainties in the VLBI
structures providing the constraints (because the only angular structure
in the model is the ellipsoidal
potential used for the main lens galaxy), and this makes
the limits on the power slope suspect (see
Section B.4.6). For example, while
it is true that Lehár et al.
([2000])
estimated that the environmental shear near B0218+357 was small, even a
 = 0.01
external tidal shear produces deflections (3 milli-arcseconds) that are
large compared to the accuracy of the constraints used for the models
and so must be included for the models to be reliable.
With these caveats, B0218+357 (like the models of B1608+656 with
significant extinction corrections) support a nearly isothermal mass
distribution with
H0 = 73 ± 8 km s-1 Mpc-1.
= 0.01
external tidal shear produces deflections (3 milli-arcseconds) that are
large compared to the accuracy of the constraints used for the models
and so must be included for the models to be reliable.
With these caveats, B0218+357 (like the models of B1608+656 with
significant extinction corrections) support a nearly isothermal mass
distribution with
H0 = 73 ± 8 km s-1 Mpc-1.
5 This is simply an example. The same behavior would be seen for any other parametric model in which the radial density profile can be adjusted. Back.
6 PKS1830-211 is included based on the Winn et al. ([2002b]) model of the HST imaging data as a single lens galaxy. Courbin et al. ([2002]) prefer an interpretation with multiple lens galaxies which would invalidate the analysis. Back.
 1 -
1 -