To appear in the Proceedings of the XI Canary Islands
Winter School Of Astrophysics on "Galaxies at High Redshift", Tenerife
November 1999, I. Perez-Fournon, M. Balcells, F. Moreno-Insertis and
F. Sanchez Eds., Cambridge University Press;
astro-ph/0009121
High-Redshift Galaxies:
The Far-Infrared and Sub-Millimeter View
Alberto Franceschini
Dipartimento di Astronomia, University of Padova, I-35122 Padova, IT
Abstract. Observations at long wavelengths, in the wide interval
from a few to 1000 µm,
are essential to study diffuse media in galaxies, including all kinds of
atomic,
ionic and molecular gases and dust grains. Hence they are particularly
suited
to investigate the early phases in galaxy evolution, when a very rich ISM
is present in the forming systems.
During the last few years a variety of observational campaigns in the
far-IR/sub-mm,
exploiting both ground-based and space instrumentation,
have started to provide results of relevant cosmological impact.
Most crucial among these have been the
discovery of an intense diffuse background in the far-IR/sub-mm of
extragalactic
origin, and the deep explorations from space in the far-IR and with
large millimetric
telescopes on ground. These results challenge those obtained
from optical-UV observations, by revealing luminous to very luminous phases
in galaxy evolution at substantial redshifts, likely corresponding to
violent
events of star-formation in massive systems. This is bringing to significant
refinements of the present schemes of galaxy formation, as far as the
history of baryon transformations is concerned.
Table of Contents
 INTRODUCTION
- The history of baryon transformations
- Long-wavelength observations of galaxies: a view on
the diffuse media and on the "active" phases in galaxy evolution
- Observational issues
- These lectures
- DUST IN GALAXIES
- Generalities
- Dust grains in the ISM
- Grain production
- Grain destruction
- The evolution of the dust content in a galaxy
- Interactions between dust and radiation
- Alternative heating mechanisms for dust
- The interstellar extinction curve
- Models of the interstellar dust
- EVALUATING THE DUST EMISSION SPECTRA
- Radiative transfer in thick dusty media
- Numerical solutions based on iterative schemes
- Monte Carlo solutions
- GENERALIZED SPECTRO-PHOTOMETRIC MODELS OF GALAXIES
- Semi-empirical approaches
- Detailed self-consistent spectro-photometric
models
- Chemical evolution of the ISM
- Geometrical distributions of gas and stars
- Models of the molecular clouds (MC)
- Models of diffuse dust (cirrus)
- Modelling the SEDs of normal and starburst
galaxies
- INFRARED AND SUB-MM LINE SPECTRA
- The cold molecular gas
- The cold neutral gas
- The ionized component of the ISM
- IR STARBURST AND ULTRA-LUMINOUS GALAXIES IN THE LOCAL
UNIVERSE
- The infrared-radio correlation
- Estimates of the star formation rate (SFR)
- Gas reservoirs, depletion times, starburst
duration
- Starburst-driven super-winds
- Starburst models
- Statistical properties of active galaxy
populations
- Starburst triggering
- Ultra-luminous IR galaxies (ULIRGs)
- Origin of elliptical galaxies and galaxy spheroids
- IR GALAXIES IN THE DISTANT UNIVERSE: PRE-ISO/SCUBA
RESULTS
- THE BREAKTHROUGHS: DISCOVERY OF THE CIRB
- Observational status about the CIRB
- Constraints from observations of the cosmic
high-energy opacity
- Contribution of cosmic sources to the CIRB: the
formalism
- Source contribution to the background
intensity
- Small scale intensity fluctuations
- DEEP SKY SURVEYS WITH THE INFRARED SPACE OBSERVATORY
(ISO)
- Motivations for deep ISO surveys
- Overview of the main ISO surveys
- The ISOCAM Guaranteed Time (GT) Extragalactic
Surveys
- The European Large Area ISO Survey (ELAIS)
- The ISOCAM observations of the two Hubble Deep
Fields
- ISOCAM survey of two CFRS fields
- The ISOPHOT FIRBACK survey program
- The Lensing Cluster Surveys
- The Japanese Guaranteed Time surveys
- Data reduction
- Mid-IR and far-IR source counts from ISO surveys
- EXPLORATIONS OF THE DEEP UNIVERSE BY LARGE
MILLIMETRIC TELESCOPES
- INTERPRETATIONS OF FAINT IR/MM GALAXY COUNTS
- Predictions for non-evolving source populations
in the mid-IR
- Evidence for a strongly evolving population of
mid-IR galaxies
- A panchromatic view of IR galaxy evolution
- NATURE OF THE FAST EVOLVING SOURCE POPULATION
- Tests of the evolving IR population in the HDFs
and CFRS fields
- Optical and NIR spectral properties: nature
of the IR sources
- Evaluating baryonic masses and the SFR of the
IR population
- What are the FIRBACK 175 µm
sources?
- The nature of the high-z galaxies detected in the
millimeter
- AGN contribution to the energetics of the faint IR
sources
- Discussion
- GLOBAL PROPERTIES: THE SFR DENSITY AND CONTRIBUTIONS TO
THE CIRB
- Evolution of the comoving luminosity density
and SFR
- Energy constraints from background observations
- Constraints from the integrated optical
background
- Explaining the CIRB background
- Galactic winds and metal pollution of the
inter-cluster medium
- A two-phase star-formation: origin of
galactic disks and spheroids
- Contribution by gravitational accretion to the
global energetics
- CONCLUSIONS
- REFERENCES
1. INTRODUCTION
1.1. The history of baryon transformations
Although baryons contribute a negligible fraction of the global mass density
of the universe,
their transformations and the associated energy releases are key elements
of the complex, puzzling history bringing from the
primeval undifferentiated plasma to the highly structured present-day
universe.
Two main driving mechanisms are able to circulate and transform
baryons in astrophysical systems:
one is related with stars and thermonuclear processes occurring therein,
the other
with gravitational contraction of gas - an important aspect of which,
able to
generate vast amounts of energy and producing spectacular effects in Active
Galactic Nuclei and quasars, is gravitational accretion onto supermassive
black holes.
Obviously, these two fundamental motors of the baryon cycle produce very
different outcomes. While gravitational BH accretion irreversibly destroys
baryons to produce energy, gas cycling into stars has (more beneficial)
effects originating beautiful stellar systems,
producing soft-energy photons, heavy elements, dust, and planetary systems
in the proper amounts to bring eventually to the life.
A basic aim of the present studies of the distant universe,
exploiting the current most powerful astronomical instrumentation,
is indeed to clarify the history of baryon circulation, and in particular
the paths through which the various different galaxy populations,
which we observe in the local universe, have built their stellar content,
created their hosted nuclear BH's and accumulated material in them.
While the overall story is driven by the evolving background of dark matter
distribution, baryons are the observable traces of the evolving
large scale structure.
The history of star formation, in particular, is a fundamental descriptor
of cosmic evolution.
Different cosmogonic scenarios predict very different timetables for the
formation of stars and structures.
For example, some models predict substantially different formation epochs
for stars among the various morphological classes of galaxies,
in particular between early-type and late-type galaxy systems.
Some others, notably some specializations of the Cold Dark Matter-dominated
models, do not.
1.2. Long-wavelength observations of galaxies: a view
on the diffuse media and on the "active" phases in galaxy
evolution
The build up of stellar populations in high-redshift galaxies is most
usually
investigated by looking at the optical/UV/near-IR emission from already
formed stars in distant galaxies.
The complementary approach, less frequently used, is to look at the
diffuse media - atomic and molecular gas and dust - in high-z systems, and
their progressive transformation into stars.
While observations of the redshifted starlight emission in the
optical/near-IR can
exploit large telescopes on ground and very efficient photon detectors,
reliable
probes of the diffuse media require longer-wavelength observations in
the far-IR and sub-millimeter: a large variety of lines from
atomic species and molecules in the Inter-Stellar Medium (ISM) at all
ionization levels are observable there. Another fundamental
component of the ISM, dust grains present in all astrophysical settings
ranging from
planetary disks to nuclear accretion torii around quasars, have the property
to emit at these wavelengths, typically between a few
µm to 1000 µm.
Observations at long-  are then essential to study diffuse media in galaxies
and are particularly suited [and needed] to study the early
phases in galaxy evolution, when a very rich ISM is present in the
forming system.
are then essential to study diffuse media in galaxies
and are particularly suited [and needed] to study the early
phases in galaxy evolution, when a very rich ISM is present in the
forming system.
Under the generic definition of galaxy activity we indicate
transient phases
in the secular evolution of a galaxy during which the various
transformations
of the baryons undergo a significant enhancement with respect to the
average rate,
for reasons to be ascertained. These phenomena concern both enhanced rates
of conversion of the ISM gas into stars (the starburst phenomenon),
and phases of increased activity of the nuclear emission following an
event of
fast accretion of gas into the super-massive BH (the so-called AGN phase,
reaching parossistic levels of photon production of up to
 1050erg/s in
some high-z quasars).
1050erg/s in
some high-z quasars).
As we will describe in this paper, IR and sub-mm wavelengths provide a
privileged
viewpoint to investigate galaxy "activity" in general, for two main reasons:
(a) in many cases this -interval includes a dominant fraction of the
whole bolometric output of active objects; (b) at long wavelengths the
screening
effect of diffuse dust, present in large amounts in "active" galaxies,
is no more effective and an impeded access to even the most extreme
column-density regions is possible.
1.3. Observational issues
Unfortunately, the IR and sub-millimeter constitute a very difficult
domain to access for astronomy:
from ground this is possible only in a few narrow bands from 2.5 to 30
µm and at
> 300 µm. From 30 to 300
µm observations are only possible from
space platforms, the atmosphere being completely opaque.
In any case, however, infrared observations even from space are
seriously limited by
several factors. The most fundamental limitation is intrinsic in the
energies  of photons we are looking at: the quantum-mechanics uncertainty principle
sets a boundary to the best achievable angular resolution
of photons we are looking at: the quantum-mechanics uncertainty principle
sets a boundary to the best achievable angular resolution  due to diffraction of
photons in the primary mirror of a telescope of size D:
[FWHM]
due to diffraction of
photons in the primary mirror of a telescope of size D:
[FWHM]  1.4*57.3*3600/D [arcsec], ( = ch/).
For a typical cooled space telescope of 1 meter diameter working at
= 100 µm
this corresponds to
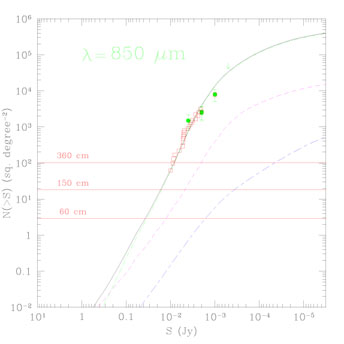
30 arcsec. For deep surveys of high-redshift
IR galaxies this limited spatial resolution implies a limiting flux
detectable above the
noise due to confusion of several faint sources in the same elementary
sky pixel. This confusion limit sets in at flux levels corresponding to
0.04 sources/area element, or
0.16 sources/arcmin2 = 570
sources/degree2 in the above example
(see eq. [8.26] and further details below).
On this regard, recent surveys (see Sects. 10
and 11) have revealed that the far-IR sky
is very much populated by luminous extragalactic sources, which implies
that confusion
starts to manifest already at relatively bright fluxes for even large
space observatories.
1.4*57.3*3600/D [arcsec], ( = ch/).
For a typical cooled space telescope of 1 meter diameter working at
= 100 µm
this corresponds to
30 arcsec. For deep surveys of high-redshift
IR galaxies this limited spatial resolution implies a limiting flux
detectable above the
noise due to confusion of several faint sources in the same elementary
sky pixel. This confusion limit sets in at flux levels corresponding to
0.04 sources/area element, or
0.16 sources/arcmin2 = 570
sources/degree2 in the above example
(see eq. [8.26] and further details below).
On this regard, recent surveys (see Sects. 10
and 11) have revealed that the far-IR sky
is very much populated by luminous extragalactic sources, which implies
that confusion
starts to manifest already at relatively bright fluxes for even large
space observatories.
Other limiting factors for IR observations come from the difficulty to
reduce the
instrumental background of (even space) telescopes due to photons
generated by the optics.
This adds to the ambient photon backgrounds, due to Zodiacal light from
interplanetary dust,
dust emission from the Milky Way, and the terrestrial atmospheric emission.
The instrumental backgrounds are reduced by cooling the instrumentation,
in particular
for space IR observatories, but this requires either inserting the
whole telescope in
large dewars (ISO, SIRTF), or by passively cooling the telescope with a very
efficient Sun-shielding (FIRST, NGST). All this is technologically very
much demanding
and tends to limit the duration of space IR missions (because of the
finite reservoir of coolant) and the size of the primary photon collector.
Finally, photon detection is not as easy in the IR as it is in the
optical, and limited performances are offered by bolometers
in the sub-mm and by photo-conductors in the mid- and far-IR. Furthermore,
the need to cool detectors to fundamental temperatures entails problems of
response hysteresis and detector instabilities due to slow reaction of
the electrons to the incoming signal.
1.4. These lectures
In spite of the mentioned difficulties to observe at long wavelengths,
it was clear
since the IRAS survey in 1984 that very important phenomena can be
investigated here.
Only recently, however, pioneering explorations of the high-redshift
universe at
these long-wavelengths have been made possible by new space and
ground-based
facilities, and a new important chapter of observational cosmology has
been opened.
These lectures are dedicated to a preliminary assessment of some results
in the
field. Because of the very complex, often still elusive, nature of many
of the
discovered sources, and because of the complicated astrophysical processes
involved, we dedicate a significant fraction of this paper to
review properties of diffuse media (particularly dust) in local
galaxies, and
of their relation with stars (Sects. 2,
3, 4 and
5). We also devote a
substantial
chapter (Sect. 6) to the description of local
IR starbursts and ultra-luminous
IR galaxies, to improve our chances of understanding their high-redshift
counterparts.
Then after a brief mention of historical (IRAS) results in the field
(Sect. 7),
we come to discuss in Sect. 8 the discovery and
recent findings about the Cosmic Infrared
Background (CIRB), in Sect. 9 the deep IR
surveys by the Infrared Space
Observatory (ISO), and in Sect. 10 the
pioneering observations by
millimetric
telescopes (SCUBA, IRAM). Interpretations of the deep counts are given
in Sect. 11, and
the question of the nature of the fast-evolving IR source populations is
addressed in
Sect. 12. Sect. 13
is dedicated to discuss the global properties of the
population and
some constraints set by the CIRB observations. A concise summary is given in
Sect. 14. A Hubble constant
H0 = 50 Km/s/Mpc will be adopted
unless otherwise stated.
2. DUST IN GALAXIES
2.1. Generalities
Dust is one of the most important components of the ISM, including
roughly half of heavy elements synthesized by stars.
The presence of dust is relevant in many astrophysical environments
and has a crucial role in shaping the spectra of many cosmic bodies.
However, its existence has been inferred from very indirect evidences
up untill recently.
The first evidence came from the discovery of a tenuous screen of small
particles around the Earth producing the zodiacal light.
Other evidences came from observations of
dust trails of comets, circumstellar dust envelopes around evolved stars,
diffuse dust in the MW producing the interstellar extinction,
the discovery of IR emission by galaxies and ultra-luminous IR galaxies
in the IRAS era, circumnuclear dust in AGNs (essential ingredient of the
unified model for
AGNs), the cosmological IR background (COBE, 1996-1998), and eventually
the discovery of sites of extremely active star formation at high redshifts
(SCUBA and ISO, 1998-2000).
Accounting for the effects of dust is essential not only to
understand the erosion of optical light, but, even more importantly,
to evaluate the energy re-emitted by dust at longer wavelengths,
typically at
5 to 1000 µ.
This is crucial for estimating all basic properties of distant galaxies:
the Star Formation Rate (SFR) from various optical and IR
indicators,
the ages of stellar populations, which, based as they are on
optical colours, have to
distinguish the reddening of the spectrum due to aging from that due to
dust extinction,
and finally to constrain the stellar initial mass function (IMF).
2.2. Dust grains in the ISM
Rather than by stars, the available volume in a galaxy is occupied by the
ISM, which in local late-type
systems amounts to 10% of the baryonic mass. The ISM includes gas mixed
with tiny solid particles, the dust, with sizes ranging from a few
Å (the PAH molecules) up to
10 µm. The mass in dust is typically 0.5 to
1% of the ISM mass.
2.2.1. Grain production
The mechanisms of birth, growth and destruction of grains are very
complex and
poorly understood. It is believed that condensation nuclei for dust grains
mostly form in dense regions of the ISM, which are better shielded from
UV photons. Main dust production sites are hereby listed.
Envelopes of protostars: during the process leading to the birth
of a star a solar nebula is produced, where silicate grains can be formed
and then blown away by a Pre-Main Sequence wind (T Tauri phase).
Cold evolved stars: in the cold atmospheres of evolved giants,
dust grains can form
and drive a strong stellar wind, in particular graphite grains
from carbon stars and silicate grains in OH-IR stars. Stars with
M < 8M are important dust producers; higher-M stars, like Wolf-Rayets
with high mass-loss rates, are too rare.
are important dust producers; higher-M stars, like Wolf-Rayets
with high mass-loss rates, are too rare.
Type-II supernovae are probably the most important contributors, as
revealed by a variety of tests, like those provided by the IR excesses
in the light-curve and the extinction of background stars in SN ejecta.
Direct evidences of dust production came from the case-study of SN 1987a
(CO and SiO molecules found in the ejecta),
the dark spots observed in the synchrotron nebula of Crab,
the IR mapping by ISO of Cas-A which resolved
clumpy emission associated with the fast moving knots
(Lagage et al. 1996).
Type-I supernovae have an uncertain role, with no evidence yet
for dust formation
(which would be otherwise relevant to solve the problem of the Fe
depletion).
The general interstellar medium is also the site of a slow growth
around
pre-existent condensation nuclei (refractory cores); it is in this way
that dirty icy grains are produced.
2.2.2. Grain destruction
Grain survival is another, uncertain, chapter of the complex story of
dust enrichment
of the ISM. Grain destruction is not likely a problem in stellar winds,
the grain should survive the injection into the ISM, while
it is more a problem for SN ejecta (which have typical velocities in
excess of 1000 Km/s).
Even after the ejection phase, the ISM is in any case a difficult
environment for grain survival: grains can be destroyed there by
evaporation, thermal sublimation in intense radiation fields,
evaporation in grain-grain collisions, and by radiative SN shocks.
2.2.3. The evolution of the dust content in a
galaxy
Modelling the complex balance between grain production and destruction
is also guided by
observations of isotopic anomalies in meteorites and of the elemental
depletion pattern.
A detailed account of most plausible intervening processes in the dust
life cycle can be found in
Dwek (1998).
The author also discusses evolution paths of the elemental abundances
in the gas and dust phases in a typical spiral galaxy, based on standard
assumptions for the infall of primordial gas and chemical evolution.
Type-II SN are found to be the main producers of silicate dust in a
galaxy, while carbon
dust is due to lower mass (2-5 M) stars. The different lifetimes of
the two imply
likely anomalous abundance ratios between the various dust grain types
during the course of
galaxy evolution, naturally evolving from an excess of silicate to an
excess of carbon grains with galactic time.
Altogether, the dust mass is found to be linearly proportional to the
gas metallicity
and equal to 40% of the total mass in heavy elements in a present-day
galaxy. Although the details can depend to some extent on the evolution
of the SFR with
time (e.g. in the case of elliptical galaxies this evolution could have
been more rapid, see
Mazzei, De Zotti & Xu
1994),
these general results are not believed to be much affected.
2.3. Interactions between dust and radiation
Dust particles interact with photons emitted by astrophysical sources by
absorbing,
scattering, and polarizing the light (the combined effect of absorption and
scattering takes the name of extinction). They also emit photons at
wavelengths typically much greater than those of the absorbed photons.
The total intensity radiation field
I (
( , t) (defined as usual by
dE
, t) (defined as usual by
dE  Id
Id d
d dAdt, dE being the differential amount of
radiant energy) is related to the field sources by the transfer
equation:
dAdt, dE being the differential amount of
radiant energy) is related to the field sources by the transfer
equation:
| (2.1)
|
where
d
 ds is the differential optical depth
corresponding to a spatial path ds,
S j/ is the source function,
and j being the extinction (true
absorption
+ scattering) and emission (true emission + scattering) coefficients.
A medium is said optically thin or thick if
along a typical path trough the medium is
<< 1 or >> 1.
Absorption includes those processes in which the energy of photons
is turned into other forms (may be internal energy of matter or fields),
true emission is the opposite processe, whilst in scattering the energy
of photons is simply deviated into other directions.
Dust scattering is usually elastic. A formal solution to eq.(1) [e.g.
Rybicki & Lightman
1979] is given by:
ds is the differential optical depth
corresponding to a spatial path ds,
S j/ is the source function,
and j being the extinction (true
absorption
+ scattering) and emission (true emission + scattering) coefficients.
A medium is said optically thin or thick if
along a typical path trough the medium is
<< 1 or >> 1.
Absorption includes those processes in which the energy of photons
is turned into other forms (may be internal energy of matter or fields),
true emission is the opposite processe, whilst in scattering the energy
of photons is simply deviated into other directions.
Dust scattering is usually elastic. A formal solution to eq.(1) [e.g.
Rybicki & Lightman
1979] is given by:
| (2.2)
|
If each dust grain has a -dependent effective cross section
 and spatial density n, then
= n or
= N , where N is
the column density. For dust grains it is common to write
and spatial density n, then
= n or
= N , where N is
the column density. For dust grains it is common to write
where  is the geometrical cross section (
 a2 for spheres)
and Q, e is the extinction efficiency (true
absorption + scattering).
At short- (UV), diffraction effects in the photon-grain
interaction become
negligible, and the effective cross-section coincides with the geometric
one,
Q, e 1. Altogether:
= Q, e n.
a2 for spheres)
and Q, e is the extinction efficiency (true
absorption + scattering).
At short- (UV), diffraction effects in the photon-grain
interaction become
negligible, and the effective cross-section coincides with the geometric
one,
Q, e 1. Altogether:
= Q, e n.
The albedo
a = Q, s/Q, e is the fraction
of extinguished light being scattered by the grain rather than absorbed.
The emission coefficient j includes a true emission
j, e and an elastic scattering
component, j, s, given by:
where f is the phase function, depending
on the incidence-scattering angle.
The true emission of dust grains is thermal.
From Kirchoff's law [j = B(T)]:
| (2.3)
|
It is clear that both terms of the emission coefficient depend on
the radiation field I. In particular j, e depends on it trough the dust grain
temperature T: grain heating is almost always dominated by the
radiation field.
Thus a primary task is to compute T. Two situations apply.
(a) Grains sufficiently large and massive don't cool in the time
interval between absorption of two photons: they are in thermal
equilibrium with the radiation field. Their temperature can
be determined by solving for T an energy conservation equation
absorbed energy = emitted energy:
| (2.4)
|
where
J = 1/4 I(,
I(, )d is the angle-averaged I.
(b) Small grains fluctuate in temperature at any acquired photon.
They never reach thermodynamic equilibrium (the cooling time is shorter than
that between two photons arrivals).
A probability distribution P(T)dT to find a grain
between T and T + dT can then be computed based on
a statistical approach
(Puget et al. 1985;
Guhathakurta & Draine
1989,
Siebenmorgen & Kruegel
1992).
Basic ingredients for this computation are:
- the specific heat C(T, a) per C-atom of PAH's of
size a and the number Nc
of C atoms in the grain;
- the maximum T a PAH can attain after absorption of a photon h, and
given by the relation:
- the cooling rate of a PAH after being heated to Tmax is
where
F(T, a) = Qabs(, a)B(, T)d
is the power radiated per unit grain surface.
The total IR spectrum radiated during the cooling down is:
In any case, dust grains are destroyed by radiation-induced temperatures
above 1000 ÷ 2000 K (depending mainly on
composition). This is
the reason why their emission is relevant only longwards a few
µm.
For mixtures of different species of particles
the equations must be summed over all the species. For spherical
grains of different compositions and sizes a and density
ni(a):
The interaction of a dusty medium with the radiation field then requires
the knowledge of the quantities Q, a, Q, s and f.
The Mie (1908)
theory provides analytic solutions for homogeneous spheres and infinite
cilinders. Otherwise, for irregularly shaped and inhomogeneous grains good
approximations can be obtained by simple generalizations of the exact
solutions for spheres and cylinders (e.g.
Hoyle & Wickramasinghe
1991;
Bohren and Huffman 1983).
As a source of scattering (like the e-), another
important effect of dust is
to induce polarization in the emitted light. Two ways for dust to
produce this
are through (a) light transmission in a dusty medium including
oriented bipolar components; or (b) dust reflection (e.g. in AGNs).
Should we be interested in modelling these effects of dust on
polarization, then
solutions of the transfer equation (2.1) for all four Stokes parameters
would be required.
2.4. Alternative heating mechanisms for dust
Two other heating mechanisms for dust grains can operate
(Xu 1997).
(a) Collisional heating for dust mixed with thermal gases.
In the HI component of the solar neighbourhood the ratio of collisional
heating Gcoll to radiative heating
Grad turns out to be
i.e. the collisional is 5 orders of magnitude less than radiative
heating! Only in very hot
plasmas (IC plasmas at T > 107) the two can get
comparable.
(b) Chemical heating, a process occurring typically in the cold
gas component of the ISM,
e.g. when an H2 molecule is formed on the
surface of a grain from the combination of 2 H atoms:
Most of this chemical energy is absorbed by the grain (the rest is taken
by the molecule).
The released energy turns out comparable with the collisional one (hence
negligible).
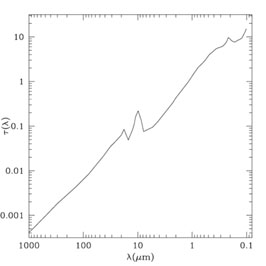
2.5. The interstellar extinction curve
Before IRAS, the properties of interstellar dust were mainly inferred
from the dimming of optical light of stars inside the Galaxy.
If we observe the light from a source through a dust screen, dust
emission is negligible in the optical (dust emits significantly only in
the IR), offline scattering is unimportant, and the formal solution
(eq. 2.1) simplifies to
I = I(0)e-  . Given a source with
unextinguished flux
m
. Given a source with
unextinguished flux
m (0), the extinction in magnitudes is:
The knowledge of the intrinsic colors for a source population allows to
determine the wavelength dependence of the extinction curve.
The mean extinction curve along most line-of-sights in the Milky Way has
been studied by many authors (see references in
Hoyle & Wickramasinghe
1991;
and see Figure 1).
Its main properties are:
(a) a growth in the optical-near UV, more than linear with
frequency,


 (0.6 - 5 µm);
(b) a bump around 2175 Å;
(c) a steeper rise in the far-UV;
(d) two features in the mid-IR at 9.7 and 18µm.
(0.6 - 5 µm);
(b) a bump around 2175 Å;
(c) a steeper rise in the far-UV;
(d) two features in the mid-IR at 9.7 and 18µm.
The extinction curve is not universal: in the Milky Way it depends on
the line of sight.
Data on other stellar systems (LMC and SMC for example) suggest a
variable behaviour, in particular in UV.
More recently it has been possible to evaluate indirectly the extinction
curve is distant galaxies, by means of accurate photometric observations
in narrow-band filters.
Gordon et al. (1997)
(see also
Calzetti 1997)
analyze colour-colour plots for 30 starburst galaxies,
inferring starburst ages and extinction properties. The 2175 Å
bump is absent and the rise in the far-UV slower than observed for the
Milky Way.
The authors suggest that the starburst has modified the grain
distribution, in particular suppressing the 2175Å feature observed
in the MW. Alternatively,
Granato et al. (2000)
reproduce the observed extinction law
in starbursts as a purely geometrical effect, by using the same dust
grain mixture than
for the MW and accounting for differential extinction for young and old
stars (see Sect. 4 below).
2.6. Models of the interstellar dust
The extinction curve, whose main features are reported in
Fig. 1,
can be explained by a mixture of grains with different sizes and
compositions. The curve in the optical is reproduced by grains with
a 0.1µm,
while the fast growth of the extinction curve in UV requires smaller
particles with
a 0.01µm. Silicate grains explain the 9.7
µm
and 18 µm emission features, whose large widths
suggest the presence of many impurities (dirty or
astronomical silicates).
|
Figure 1. The galactic extinction curve, in
optical depth per unit value
of E(B - V). The two silicate features at 10 and 18
µm and that of
carbonaceous grains at 2175 Å can be recognised.
|
On the contrary, silicates cannot explain the optical extinction, because of
their excessive albedo. Here carbonaceous grains (graphite or amorphous
carbon)
are proposed as main absorbers, their
resonance at 2175 Å nicely fitting the observed UV bump.
The non-linear growth in the FUV is probably due to very small grains
and PAH molecules (required also to explain the interstellar IR emission
bands, e.g.
Puget & Leger 1989).
Unfortunately, the extinction curve does not constrain enough the
properties of interstellar dust. For this reason, a variety of models,
all with the above
basic ingredients, have been proposed to reproduce it.
Draine and Lee (1984)
adopt a power law size distribution of silicate and graphite grains
dn/da nHa-3.5 for 0.005
µm < a < 0.25µm.
A quite more complex model by
Siebenmorgen & Krugel
(1992)
includes five classes of
grains (amorphous carbon, silicates, very small grains, small PAH
and clusters PAH), providing an impressive fit to the extinction
curve. The one by
Rowan-Robinson (1992)
with a discrete set of nine kinds of grain (amorphous carbon size
a = 30µm and
a = 0.1µm; graphites with a = 0.03,
0.01, 0.002 and 0.0005 µm; amorphous silicate
a = 0.1µm and silicates with a = 0.03
and 0.01 µm)
explains also the FIR emission from circumstellar envelopes.
The population of very big grains is assumed here to explain the
sub-mm emission of carbon stars.
The most relevant recent improvement with respect to the classical models by
Drain & Lee is the addition to the grain mixture of
very small particles and macro-molecules reaching temperatures higher than
equilibrium because of their small size, as described above.
Two regions of the extinction curve are particularly sensitive to the
presence of these small particles: the mid-IR spectrum (including the
emission bands
at 3.28, 6.2, 7.7, 8.6 and 11.3 µm, and appreciable
continuum), and the fast far-UV rise.
The mid-IR emission bands, in particular, are
most commonly interpreted as due to a family of very stable planar
molecules, the PAH's (polyciclyc aromatic hydrocarbons), whose
vibrational spectra closely
resemble, according to laboratory tests, those of emission bands.
PAH emission features originate mainly in the so-called
photo-dissociation
regions, i.e. in the interfaces between molecular clouds and the HII
regions, where the cloud surfaces are illuminated by the
high energy field of the young stars.
There are evidences that in denser environments and stronger UV
field intensities the PAHs (and the associated mid-IR bands) could be
depleted.
In the circum-nuclear dusty regions around AGNs PAH emission is not
observed.
PAH emission features have been observed by ISO to display Lorentian
profiles, whose broad overlapping wings may mimic a kind of continuum
(Boulanger et al. 1998).
This may possibly explain the observed underlying mid-IR continuum in
many astrophysical objects.
3. EVALUATING THE DUST EMISSION SPECTRA
Knowing, or guessing, the optical properties of dust, one can predict
the spectra of dusty systems. From a computational point of view,
we have to distinguish two cases.
- If the IR dust emission is not self-absorbed (
 << 1),
the emitted spectrum is simply the volume integral of the local
emissivity.
An ambient of this kind is the diffuse dust in the IR galactic
cirrus.
Solution of the energy balance equation (2.4) provides the T
distribution for the various grain species. Since, in particular,
Q,(a, s) 1 in UV
and Q,(a, s) a/
<< 1),
the emitted spectrum is simply the volume integral of the local
emissivity.
An ambient of this kind is the diffuse dust in the IR galactic
cirrus.
Solution of the energy balance equation (2.4) provides the T
distribution for the various grain species. Since, in particular,
Q,(a, s) 1 in UV
and Q,(a, s) a/ in the far-IR,
and considering that the left-hand side is dominated
by absorption of UV photons while the right hand by emission at long
wavelengths, eq. (2.4) can be re-written for a given grain specie as:
in the far-IR,
and considering that the left-hand side is dominated
by absorption of UV photons while the right hand by emission at long
wavelengths, eq. (2.4) can be re-written for a given grain specie as:
| (3.5)
|
Since B[Tg(a)]d = aTg4 and because of the
additional dependence implied by Q,(a)  T1.5 - 2, the grain
equilibrium temperature Tg is found to depend very
weakly on the intensity of the local radiation field:
T1.5 - 2, the grain
equilibrium temperature Tg is found to depend very
weakly on the intensity of the local radiation field:
| (3.6)
|
This implies that dust emission spectra in a variety of galactic
environments
(from quiescent to actively starbursting galaxies and AGNs)
are quite stable and robust, with peak emission mostly confined to the
wavelength interval 
 100 to 30
  m.
Longward of and after eq. (2.3), dust spectra converge
according to the RJ law as
m.
Longward of and after eq. (2.3), dust spectra converge
according to the RJ law as
in agreement with mm observations of local IRAS galaxies by
Andreani & Franceschini
(1996)
and Chini et al. (1995).
- Otherwise, in the presence of IR-thick media (e.g. dense molecular
clouds and dusty torii
in AGNs), one is faced by the difficult task to solve the transfer
equation.
We expect that in thick media the IR spectrum will be erased at the
short wavelengths (typically in the near- and mid-IR, but sometimes even
in the far-IR) by self-absorption.
3.1. Radiative transfer in thick dusty media
In most practical cases, the radiative transfer equation can be solved
only with numerical techniques. We mention in this Section a couple of such
approaches quite often used.
3.1.1. Numerical solutions based on iterative
schemes
A first class of solutions adopt an iterative numerical scheme based on
applications of the formal solution of the transfer equation (eq.[2]).
This was originally developed for interpreting AGN spectra
(Granato & Danese 1994;
Pier & Krolick 1992;
Granato, Danese &
Franceschini 1997),
but is useful to treat more generally radiative transfer in thick media.
Although the source function can be any kind in principle, we discuss
here an application
by Granato & Danese for a central point-source and for a planar and
azimuthal symmetry
of the dust distribution within a minimum rm and
maximum rM radii.
A condition is set on rm because of dust sublimation:
it cannot be lower than
rm = L460.5
T1500-2.8 (pc) to avoid exceeding
an equilibrium grain temperature of
Tgr = 1500 for graphite and Ts =
1000 for silicates.
The two fields to solve for are the radiation field intensity
I(r, ,,
,, )
and the grain temperature distribution
T(r,).
The solution is found by representing the field intensity as the
contribution of two terms
)
and the grain temperature distribution
T(r,).
The solution is found by representing the field intensity as the
contribution of two terms

| (3.7)
|
the first term being the radiation field emitted by the central source
and estinguished by the dust, with trivial solution from eq. (2.1):
| (3.8)
|
L() becoming dependent on direction because of differential
extinction, being the optical depth to the point (r, ,  ).
The second term originates from thermal emission by dust, and may be
expressed at the
zero-th order as the formal solution (eq. 2.2) of the transfer equation:
).
The second term originates from thermal emission by dust, and may be
expressed at the
zero-th order as the formal solution (eq. 2.2) of the transfer equation:
| (3.9)
|
The quantity S is the source function
j/ which,
if the scattering is isotropic, can be expressed as a weigthed average
of the scattering and absorption
(Rybicki and Lightman 1979)
summed over all grain species:
| (3.10)
|
The function J is the direction-averaged radiation
field intensity
Id: this integral obviously includes both contributions
to the total intensity in eq. (3.7).
Finally, assuming radiative equilibrium for the dust grains, the grain
temperature
distribution is found from eq. (2.4). The following iterative scheme is
used to obtain a solution for I:
(1) the zero-th order approximation for I1 in eq. (3.7) is obtained from
eq. (3.8) given L and the adopted dust distribution;
(2) then a zero-th value for the T-field is found from eq. (2.4);
(3) the source function S is then computed from eq. (3.10)
including the contribution from thermal dust emission;
(4) after eq. (3.9) the second term I2 of the radiation field is
computed
and the total field intensity in eq. (3.7) is updated;
(5) convergence is achieved when e.g. dT from one step to the other
is less than a small fixed amount.
Suitable scaling rules are usually adopted to accelerate the
convergence.
3.1.2. Monte Carlo solutios
The advantage of brute-force solutions like a Monte Carlo simulation is
that it is better suited
to treat complex situations for the geometries of the source function
and of the spatial distribution of the absorber.
Also velocity fields can be naturally considered in the code to map the
kinematical structure of the emission lines (e.g.
Jimenez et al. 2000).
The usual approach is to assume a given geometrical distribution for the
absorber,
possibly including a velocity field, and to generate inside (or outside) it
photons according to a given source function (plus a background photon
distribution).
All these fields are usually discretized into appropriate spatial grids.
Each photons are then followed through the distribution of the absorber,
their
interaction being ruled by the optical depth, albedo and scattering
phase functions at that point.
The simplest geometrical distributions adopted are (e.g.
Disney et al. 1989;
Gordon et al. 1997):
the mixed, in which the source and absorber are homogeneously
distributed;
the shell, where the source and absorber are separated, typically
the former inside and the latter outside acting as a screen.
However, much more complex situations can be described this way, up to
fully 3D distributions without any symmetries
(Jimenez et al. 2000).
4. GENERALIZED SPECTRO-PHOTOMETRIC MODELS OF GALAXIES
Twenty years after the first serious models of stellar population synthesis
(Tinsley 1977;
Bruzual 1983),
the most relevant recent progresses have been
the attempts to provide a self-consistent description of the effects of
dust (and gas) in galaxy spectra and spectral evolution. We review in
this Section some recent efforts
of generalized spectral synthesis of galaxies from the UV to the sub-mm,
including dust effects (as for both the extinction of the primary
optical spectrum, and dust re-radiation at longer ) in the various galactic environments.
Dust plays an important role in all relevant galactic sites:
(1) the neutral interstellar medium, whose associated dust is
heated by the general
radiation field (infrared cirrus, prominent in the 100µm
IRAS band);
(2) the dense cores of molecular clouds, where dust optical-depth
is very high and prevents light from very young stars to be observed;
(3) dust in the external layers of molecular clouds (PRD
regions), heated by the
interstellar radiation field and OB associations formed in the clouds;
(4) dust around protostars;
(5) dust around evolved giants and young planetary nebulae;
(6) hot dust associated with HII regions.
The inclusion of dust means a dramatic complication of
spectro-photometric
models: the usual assumption of population-synthesis codes -
that the global emission of a whichever complex stellar system is simply the
addition of the integrated flux of all components independently on the
geometry of the system - is no more valid:
not only the extinction process depends in a complex way on the relative
distributions of stars and dust, but also
dust emission itself, at high dust column densities and according to
geometry, may be optically thick.
In principle, accounting for dust effects in detail may require a very
complex
description of: (1) the physical-chemical-geometrical properties of grains,
determining their interactions with the radiation field (e.g.
amorphous, porous low-albedo grains vs. highly reflective grains);
(2) the chemical composition of the ISM where grains have condensed
(which affects
the dust composition), given by the integrated contribution of all
previously
active stellar populations in the galaxy;
(3) the modifications that grains and molecules undergo during the course of
evolution, i.e. sublimation in strong UV radiation fields, sputtering, etc.
(see Sect. 2.2).
These complications of the classical purely stellar evolutionary
codes cannot be avoided, if we want a complete and reliable description
of physical processes
inside galaxies. As we will discuss in later Sections, this turns
out to be
particularly critical when describing what we called the active
phases
during galaxy evolution: neglecting dust effects in such cases would
bring to entirely wrong conclusions.
On the other hand, the uncertainties introduced by the large number of
new parameters
are largely reduced by adopting a multi-wavelength (UV through mm)
approach, which balances the unknowns with the number of
constraints coming from a wide-band observed spectrum.
4.1 Semi-empirical approaches
A phenomenological approach to a global spectrophotometric description of
galaxy evolution was recently discussed by
Devriend, Guiderdoni &
Sadat (1999).
This paper elaborates separately the code for stellar population
synthesis from
that of dust emission. The former is treated with the most recent
prescriptions. The dust emission is schematically represented
as the contribution of four different components:
the PAH emission features, very small grains, big grains illuminated by the
general galactic radiation field (cold dust), and big grains illuminated
by young stars in starburst regions.
These four components are modelled using typical parameter values for
the dust composition, radiation field intensity, mass, etc.
Relative normalizations of the four components are finally calibrated
using the observed relationship between the IRAS colours of
galaxies and the bolometric luminosity.
This approach is quite fast as for computation time (in particular it
overcomes the problem of solving the radiative transfer equation),
and is particularly useful for statistical analyses of large galaxy
databases.
4.2. Detailed self-consistent spectro-photometric
models
More physically detailed descriptions of the galactic dust emission are
discussed by several teams. These models interface two logical procedures:
- (1)
the first is to describe, given a prescription for the IMF, the history of
star-formation in the galaxy as a function
 (t) detailing the mass in stars formed
per unit time t, the actual gas metallicity
Z(t), the abundances of various elements produced by stars
during evolution,
and the residual gas fraction g(t) as a function of time;
(t) detailing the mass in stars formed
per unit time t, the actual gas metallicity
Z(t), the abundances of various elements produced by stars
during evolution,
and the residual gas fraction g(t) as a function of time;
- (2)
the second step is to sum up, at any galactic age t, the fluxes
from all populations
of stars, by solving the radiative transfer equation taking into account
how stars and the residual gas and dust are geometrically distributed.
4.2.1. Chemical evolution of the ISM
While point (1) above is addressed in detail by other contributions to
these Book (Bruzual), we remind here a few basic concepts.
A galaxy is usually modelled from the chemical point of view as a single
environment
where primordial gas flows in according to an exponential law

| (4.11)
|
The SFR follows a general Schmidt law

| (4.12)
|
with the addition of one or more bursts of star-formation to describe
starburst episodes possibly triggered by galaxy interactions or mergers.
The typically adopted value for k is 1.
For the initial mass function (IMF) the usual assumption is a Salpeter law

| (4.13)
|
with typically
Mmin = 0.1 M (but higher values may apply for example
in the case of starbursts). The observed photometric properties of
galaxies of various types and morphologies are reproduced by varying in
particular
tinf and .
Given the above parameters, the solution of the equations of chemical
evolution allow to
compute at any given galactic time all basic quantities, in particular
the functions
g(t) and Z(t), and then, after eq. (4.12),
the number of
stars generated at that time with metallicity Z(t).
The integrated spectrum of each stellar generation
(Single Stellar Population, SSP) then evolves according to the
prescriptions of stellar evolution, defining a 2D sequence (spectral
intensity
L[, t] vs. frequency as a function of time, t).
4.2.2. Geometrical distributions of gas and
stars
In the model by
Silva et al. (1998)
three different stellar and ISM components are
considered in the generic galaxy:
(a) star-forming regions, comprising molecular clouds (MC), with
young stars, gas and dust in a dense phase, and HII regions;
(b) young stars escaped from the MC complexes;
(c) diffuse dust ("cirrus") illuminated by the general
interstellar radiation field.
For disk galaxies the adopted geometry is a flattened system with azimuthal
simmetry and a density distribution for the 3 above components described
by double exponentials:
 =
=  exp(- r/rd)
exp(- |z|/zd).
exp(- r/rd)
exp(- |z|/zd).
For spheroidal galaxies, spherical symmetry is adopted with King profiles
= ((1 + [r /
rc]2)- - (1 +
[rt/rc]2)- ),
with
- (1 +
[rt/rc]2)- ),
with
 = 3/2,[rt/rc] 200, rc 300pc as typical values.
4.2.3. Models of the molecular clouds
(MC)
High-resolution CO and radio observations show that MCs are highly
structured objects containing very dense cores where stars are actually
formed. Typical values for the MCs are: size 10 pc, mass
106 M.
All star-formation in the Galaxy
happens in dusty MCs, the early evolution phases of young star clusters
occurr inside such dusty regions, hence are optically hidden.
Later, on the lifetime of OB stars (106 - 107
yrs), the radiation power of
young stars, stellar winds and the first SNs destroy the parent MCs
and allow the young stellar population to appear in the optical.
Note that, bacause of the clumpiness of MCs, this is in any case a
statistical
process: in some clouds even the emission of the youngest OB stars is
already visible, while in others all young stars are completely embedded
in dust.
Silva et al. (1998)
describe schematically this transition of the MC from a
dust-embedded phase to the
optically dominated phase, as a process in which the fraction f
of the light from the SSP generated within the cloud still embedded into
dust decreases linearly with time as
f (t) = 2 - t / t0,
t0 being the time interval during which the SSP is
entirely extinguished.
The spectrum emitted by the MC and filtered by dust is computed by
solving the
transfer equation, e.g. by assuming that the primary SSP spectrum
comes from
a point source in the center of the cloud (this rather crude assumption
allows substantial semplifications in the numerical code, see above).
A more detailed description of molecular cloud structure and emission is
provided by
Jimenez et al. (2000).
Their model is based on fully three-dimensional simulations of the
density
and velocity fields obtained by solving 3D compressible
magneto-hydrodynamical
(MHD) equations in supersonic turbolent flows, as typical of the motions in
Galactic molecular clouds
(Padoan et al. 1998).
The MHD turbolence generates a large density contrast, with the density
field spanning
a range of 4 to 5 orders of magnitude. This brings to a highly
filamentary and clumpy morphology.
All this is consistent with observed properties of the clouds.
Young stars with
M > 15 - 20 M in this model are heavily
extinguished for virtually all their live.
A detailed Monte Carlo approach is required to solve the radiative
transfer equation.
The simultaneous knowledge of the density and velocity fields allows also
to estimate in great detail the molecular emission lines (CO).
4.2.4. Models of diffuse dust (cirrus)
Diffuse dust in the galaxy is responsible for a general attenuation of
the light emitted by all stars and MC complexes.
In this case the dust column density is not so high to require a detailed
solution of the transfer eq. ( for IR photons is small).
One can express an effective optical depth to account for combined
absorption and scattering
(Rybicky and Lightman
1979):
 =
=  ( +
( +  ).
The galaxy is divided into small volume elements Vi,
such that the local
radiation field in this elementary volume is
).
The galaxy is divided into small volume elements Vi,
such that the local
radiation field in this elementary volume is
r2i, k being the distance between the i-th
and k-th volumes.
This determines the temperature of the local diffuse dust, whose
integrated flux seen by an observer in a direction is a
simple sum over all volume elements of the diffuse dust emissivity:
being the optical depth from the V-element to the
outskirts in that direction and
j()k = j()kmc + j()kstar + j()kcirrus.
4.2.5. Modelling the SEDs of normal and starburst
galaxies
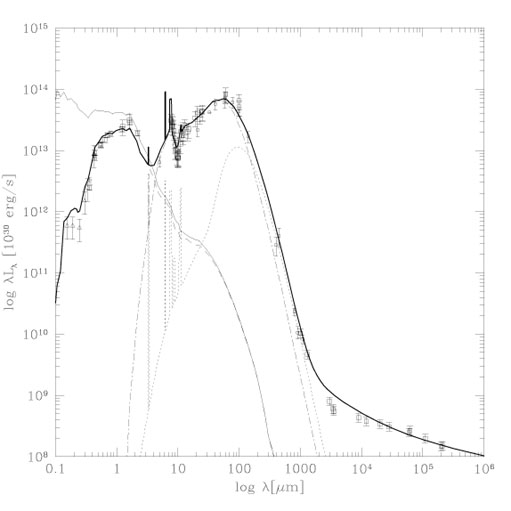
Figure 2 shows the broad-band (UV through radio)
spectrum of the prototype
starburst galaxy M82, a closeby well studied object at 3.2 Mpc.
The lines in the figure come from the fit obtained by
Silva et al. (1998).
The thin (cyan colored) continuous line peaking at 0.1
µm corresponds to the
unextinguished integrated spectrum of all stellar population, while the
long-dashed line
is the reddened stellar continuum. The dot-dashed line is the
contribution of dust in
molecular clouds, while the dotted line comes from diffuse dust in the
"cirrus".
In this model, the optical-NIR spectrum of the galaxy is contributed mostly
by old stellar populations unrelated to the ongoing starburst, whereas
the starburst emission is mostly observable at
> 4 µm in the form of dust
re-radiation, radio SN and free-free emissions.

|
Figure 2. The broad-band (UV through radio)
data on the prototype nearby starburst galaxy M82.
The ordinate axis is normalized to
1030 erg/sec.
[Courtesy of G.L. Granato].
|
Equal areas in the
L() plot of Fig. (2) subtend
equal amounts of
radiant energy: it is then clear from the figure that in this moderate
starburst
80% of the bolometric flux emerges as dust re-radiation
above 5 µm.
In higher luminosity starbursts and in Ultra-Luminous IR Galaxies
(ULIRGs, e.g. Arp 220)
this fraction gets close to 100%.
On the contrary, for local normal galaxies the average fraction is only 30%,
as found from comparison of the far-IR with the optical luminosity
functions of galaxies
(Saunders et al. 1990).
5. INFRARED AND SUB-MM LINE SPECTRA
IR/sub-mm spectroscopy offers unique opportunities to probe the physical
conditions
(n[atoms], P, T, extinction, ionization
state) in the various components of the ISM, because:
- the widespread presence of dust makes optical-UV-NIR line diagnostics
completely unreliable;
- most of the line emission by MCs is extinguished and does not appear
in the optical;
- lines from molecular phases (including most of the ISM mass)
appear in the FIR-mm;
- several fundamental cooling lines of gas happen in the FIR;
- lines from an extremely wide range of ionization states are
observable in the IR.
Table 1 summarizes IR tracers of the various ISM
components.
Clearly, IR spectroscopy is essential for studies of galaxy activity, though
it requires a continuous coverage of the IR spectrum, possible only from
space. While ISO allowed to invertigate spectroscopically nearby IR active
galaxies, future missions (SIRTF, NGST, FIRST) will make possible
similar studies for galaxies at any redshifts.
Table 1.Relevant components and line tracers of
the ISM
|
| Component
| Temperature
| Density
| Tracers and IR lines
|
|
| Cold gas
| 10-100 K
| 1-1000 cm-3
| H2, CO, PAH's
|
| Diffuse HI
| 100-1000 K
| 1 cm-3
| HI 21cm, [CII], [OI]
|
| HII regions
| 1000-10000 K
| 3-300 cm-3
| H , [OII], [OIII] , [OII], [OIII]
|
|
5.1. The cold molecular gas
Looking at the mm/sub-mm spectral lines is the usual way to study the cold
molecular gas, which typically includes the largest mass fraction of the
ISM.
The lines come from rotational and vibrational transitions of
diatomic and polyatomic molecules.
The very many molecules observable allow to accurately sample the
various regimes of
, T and elemental abundance.
Unfortunately, the most abundant molecule (H2) is not
easily observed directly.
It is seen in absorption in UV, or in the NIR roto-vibrational
transitions at 2.121 and 2.247 µm.
Only with mid-IR spectroscopy by ISO it was possible to observe the
fundamental rotational lines at 17 µm (S[1]), 28.2
µm (S[0]),
and 12.3 µm (S[2]) in
NGC6946, Arp220, Circinus, NGC3256,
NGC4038 / 39).
These observations indicate very cool gas to be present with very high
column densities (the transition probabilities of the lines are very low).
Because of the difficulty of a direct measure, the amount of molecular
gas (H2)
is often inferred from easier measurement of CO emission lines, assumed
an H2/CO conversion.
CO rotational transitions allow excellent probes of cold ISM in
galaxies: the CO brightness temperature ( line intensity) is almost independent on z at
z = 1 to 5,
due to the additional (1 + z)2 factor with respect to
the usual scaling with the luminosity distance
(Scoville et al. 1996).
CO line measurements have been performed for all IRAS sources in the
Bright Galaxy Sample,
the majority have been detected with single-dish telescopes.
In the most luminous objects the molecular mass is
0.2 - 5 1010 M,
i.e. 1 to 20 times the content of Milky Way.
Typically 50% or more of this mass is found within the inner kpc from
the nucleus,
the molecular mass substantially contributing to the total dynamical mass
(> 50% of Mdyn).
Unfortunately, detecting CO emission by high-z galaxies has proven to be
difficult (see below).
5.2. The cold neutral gas
The diffuse neutral ISM is commonly traced by the HI 21 cm line from
ground-based observations.
HI cooling, which is essential to achieve temperatures and densities
needed to trigger
SF, depends mainly on emission by the 158µm [CII]
line, the 21 cm line and the 63µm [OI] line.
The 158 µm [CII] line is a major coolant for the diffuse
neutral gas and a fundamental
cooling channel for the photo-dissociation regions (PDR's), the dense
phase interfacing cold molecular clouds with the HII or HI lower-density
gas. Carbon is the most abundant element with ionization potential (11.3
eV) below the H limit
(13.6 eV): CII atoms are then present in massive amounts in neutral
atomic clouds.
The two levels in the ground state of CII responsible for the
= 158 µm
transition correspond to a
relatively low critical density
ncrit 300 cm-3 [the density
at which collisional excitation balances radiative de-excitation]:
CII is excited by electrons and protons and cools down by emitting a FIR
photon.
The CII line intensity is also weakly dependent on T, hence a
good measure for P.
The [OI]145µm and 63µm lines are
also coolants, though less efficient.
5.3. The ionized component of the ISM
Again, a number of lines from atomic species, covering an extremely wide
range of ionization conditions, are observable in the far-IR. Their
observations allow
extensive analyses of the physical state of the gas. This,
coupled with the modest sensitivity to dust extinction, provides the
ideal tool to probe even the most compact, extinguished sites,
e.g. in the inner galactic nuclei.
For a detailed physical investigation, line ratios sensitive to either
gas temperature T
or density n are used. To estimate electron density n one
can use the strong dependence of
the fine-structure line intensities for doublets of the same ion on
n: one example are the [OIII] lines at 5007 Å, 52
µm and 88 µm.
Similarly one can estimate T and the shape of the ionizing continuum.
Particularly relevant to test the spectral shape of the ionizing
continuum are
the fine-structure lines from photo-ionized gas, which allow to
discriminate spectra of stellar and quasar origin.
Low-ionization transitions typically strong in starbursts are [OIII]52
and 88, [SiII]34,
[NeII]12.8, [NeIII]15.6, [SIII]18.7 and 33.4, while higher ionization
lines in AGNs
are [OIV]25.9 and [NeV]24. Table 2 reports a few
of the most important IR ionic lines.
Table 2. The most important IR fine-structure
lines. (a) Line intensity compared with the observed
[CII]158µm for the
prototypical starburst M82, when available, or predicted by
Spinoglio & Malkan
(1992)
from a model reproducing the physical conditions in M82.
|
| Species
| Excitation
|
| ncrit
| F/F[CII](a)
|
|
| potential
| (µm)
| cm-3
|
|
|
| OI
| -
| 63.18
| 5 105
| 1.4
|
| OI
| -
| 145.5
| 5 105
| 0.06
|
| FeII
| 7.87
| 25.99
| 2 106
|
|
| SiII
| 8.15
| 34.81
| 3 105
| 2.6
|
| CII
| 11.26
| 157.7
| 3 102
| 1
|
| NII
| 14.53
| 121.9
| 3 102
| 0.37
|
| NII
| 14.53
| 203.5
| 5 101
| 0.11
|
| ArII
| 15.76
| 6.99
| 2 105
| 0.11
|
| NeII
| 21.56
| 12.81
| 5 105
| 2.1
|
| SIII
| 23.33
| 18.71
| 2 104
| 0.68
|
| SIII
| 23.33
| 33.48
| 2 103
| 1.1
|
| ArIII
| 27.63
| 8.99
| 3 105
| 0.23
|
| NIII
| 29.60
| 57.32
| 3 103
| 0.31
|
| OIII
| 35.12
| 51.82
| 5 102
| 0.74
|
| OIII
| 35.12
| 88.36
| 4 103
| 0.66
|
| NeIII
| 40.96
| 15.55
| 3 105
| 0.16
|
| OIV
| 54.93
| 25.87
| 104
| -
|
|
One important application of IR spectroscopy was by
Genzel et al. (1998),
to investigate the nature of the primary energy source in IR luminous
galaxies (see Sect. 6.8).
6. IR STARBURST AND ULTRA-LUMINOUS GALAXIES IN THE LOCAL
UNIVERSE
For a variety of reasons it is unlikely that star-formation (SF) in
galaxies has proceeded quietly during the Hubble time. 'A posteriori'
evidence
has accumulated that a fraction of stars in stellar systems was produced
during short-lived events (see e.g. the excellent review in
Moorwood, 1996).
These SF events are expected to be very luminous, either in the optical
or in the IR, and are expected to contribute substantially to the
global energetics from baryon thermonuclear reactions, to the
synthesis of metals, and the generation of background radiations in the
optical,
IR and sub-mm. Also the origin of Es, S0s and of the bulges of spirals may
have some relationship with luminous and ultra-luminous starburst events
at high-z.
If the study of star-formation in high-redshift sources is a primary
task for modern
cosmology, it is obvious that relevant information for the interpretation of
distant objects comes from a close up on local galaxies with enhanced SF.
For this reason we consider in this Section a sub-class of local
galaxies, the starburst
galaxies and the IR luminous and ultra-luminous galaxies, including
a small fraction (few %) of all local objects, but accounting for
a large percentage of the present-day star formation in galaxies.
The discovery of the starburst phenomenon dates back to the 1970's and came
almost simultaneously from two quite independent lines of investigation:
from objective-plate (Markarian) surveys of UV-excess galaxies, and from
the first pioneering IR observations of galaxies in the local universe.
IR observations, in particular, revealed the existence of galaxies with
IR luminosities
and L/M ratios appearently too high to be sustained over their lifetimes
(Harwit and Pacini 1975).
This brought to the idea that some galaxies undergo a
sudden burst of massive star formation, with dust reprocessing of UV
photons emitted
by the young stars interpreted as the source of the IR light.
From these observations it was clear that SF has a twofold appearence, a
UV excess and an IR excess, which may be explained by the
stocastical nature of the interaction between photons and dust in
star-forming regions of galaxies (see above).
However, the abilities of UV and IR surveys to sample the starburst
phenomenon are
very different: while at low bolometric luminosities UV and IR surveys
sample roughly the same kind of objects, at high luminosities the UV
flux is no more a
good tracer of the SF, which is better sampled by the IR emission.
This effect is due to dust extinction of the UV-light by young stars
becoming more
and more relevant at the higher bolometric luminosities
(Lbol > 1011 L,
Sanders and Mirabel 1996).
At the highest values of Lbol (> 1012
L)
most (> 95%) of the flux comes out in the IR.
Lbol is also tightly correlated with the optical
morphology:
while at low-L there is a "natural" mix of various (mostly late) types,
at the higher-L nearly all objects appear to be interacting galaxies,
and at the highest-L they look as advanced mergers.
Also, the correlation is in the sense that while in low-L objects the SF
activity is
spread over the galactic disk (enhanced in the spiral arms), at
increasing luminosity
the SF gets more and more concentrated in the nuclear regions.
In the higher-L objects in particular, it is often observed a
concomitant stellar
and nuclear non-thermal (AGN) activity, usually the latter occurring in
the dynamical center of the galaxy and the former in a circum-nuclear
ring (at 1 kpc).
A basic difficulty encountered in studies of active galaxies is to
disentangle between starburst-dominated and AGN-dominated energy sources
of the IR-luminosity. In fact, the two astrophysical processes are quite
often associated in the same object.
Optical line ratios (high vs. low excitation, e.g. [OIII]5007 /
H vs.
[NII]6583 /
H, the Osterbrock diagram) and line widths (few
hundreds Km/s for starbursts, larger for AGNs) are sometimes useful
indicators, even in the presence of dust.
vs.
[NII]6583 /
H, the Osterbrock diagram) and line widths (few
hundreds Km/s for starbursts, larger for AGNs) are sometimes useful
indicators, even in the presence of dust.
Useful near-IR lines, accessible from ground, are the Hydrogen Br2.166µ,
HeI2.058µ, H2, but also higher atomic number species,
[FeII] among others.
The Br2.166µ and HeI2.058µ, in
particular, so close in that differential extinction is negligible, constrain
the underline ionization spectrum.
However, the most reliable information is provided by mid- and far-IR
spectroscopy
by space observatories. Extremely promising in this field, in addition
to ISO and SIRTF in
the next few years, are the planned large space telescopes: NGST in the
mid-IR and FIRST in the far-IR.
6.1. The infrared-radio correlation
While there is no direct proof for the basic interpretation of the IR
starburst
phenomenon (i.e. being due to UV light from newly formed stars absorbed
by dust and re-emitted
in the IR), an indirect support comes from the well-known radio to
far-IR luminosity correlation
(de Jong et al. 1985,
Helou et al. 1985).
This, which is the tightest correlation involving global properties of
galaxies,
provides an important constraint on the physics ruling starbursts of any
luminosities.
It not only involves luminous active starbursting galaxies, but also
many other galaxies, like quiescent spirals.
The correlation is parametrized by the ratio of the bolometric far-IR flux
FFIR (in erg/s/cm2) to
the radio flux S (in
erg/s/cm2/Hz):

| (6.14)
|
which is observed to keep remarkably constant
with Lbol ranging over many orders of magnitude, from
low-luminosity spirals up to ultraluminous objects (Arp 220)
[small departures from linearity appearing at the low- and
high-luminosity ends].
The relation is interpreted as an effect of the ongoing star formation:
the far-IR emission comes from dust heated by UV photons by young stars,
which also heat
the ISM producing free-free emission and generate SN originating
high-energy e-
and synchrotron flux mostly by interaction with the general galactic
magnetic field.
This same scheme explains the departures from linearity: e.g. q
slightly increases at the
low-luminosity end because LFIR is also contributed by
the flux by old stars heating the dust.
The radio emission tends to be less concentrated than the far-IR, because of
fast e- diffusion.
6.2. Estimates of the star formation rate (SFR)
As the bolometric luminosity increases, the optical indicators of the
SFR (e.g. the UV flux, or the EW of H) become increasingly uncertain, as a larger
and larger fraction of short- photons are extinguished.
In such a situation, the IR luminosity (proportional to the luminosity
by young stars) becomes the most reliable indicator of the SFR.
A slight complication here is that older stars illuminating the diffuse
cirrus dust in galaxies also contribute to the far-IR flux, particularly in
low-luminosity inactive systems.
The SFR is estimated by
Telesco (1988)
from the energy released by the CNO cycle and assuming
a Salpeter IMF (eq. 4.13):
the former relation referring to the OBA star formation.
A refined calibration is given by
Rowan-Robinson et
al. (1997):
where incorporates the correction from a Salpeter IMF to the
true IMF ( 3.3 going to a Miller-Scalo) and includes corrections
for the cut in the IMF (e.g.
1/3 if only OBA stars are formed),
being the fraction of photons re-radiated in the IR.
Another mean of estimating the ongoing SFR exploits the radio flux
(Condon 1992),
by relating the SN rate to the rate of SF and using observations of
the radio luminosity of the Milky Way to calibrate the relation.
Since the synchrotron emission (proportional to the rate of SN remnant
production)
and thermal radiation (from HII regions heated by young OB stars)
dissipate in
107 - 108 yrs, the radio flux provides a good
measure of the instantaneous
SFR. Operatively, one needs to estimate the fraction of stars with masses
M > 8 M,
progenitors of type-II SN, formed per unit time.
The problem with faint radio-source observations is that the radio emission
of stellar origin gets easily confused with non-thermal emission by a
radio-loud AGN.
Finally, ISO observations indicate that also the mid-IR flux [dominated
by hot dust and PDR emission] traces very well the SFR (see
Sect. 12.1.2 below).
All these long-wavelength methods provide obvious advantages, in terms of
robustness with respect to dust-extinction, compared with the optical ones,
namely the relation of SFR with the UV continuum flux by
Madau et al. (1996):
SFR(all stars) = 5.3 10-10
L2800Å / L [M/yr];
SFR(metals) = 1/42 SFR(stars), and that
between the H line flux and the SFR
(Kennicut 1998):
Poggianti, Bressan &
Franceschini (2000)
and Franceschini et
al. (2000)
have shown that even after correcting for extinction the H flux
using measurements of the Balmer decrement, the H-based SFR is typically
a factor 3 lower than the appropriate value inferred from the
bolometric flux
in IR-luminous galaxies.
Altogether, with these calibrations, moderate luminosity IR starbursts have
SFR3-30
[M/yr],
(corresponding to 105 O stars present during a typical burst).
The most luminous objects, if indeed powered by SF, have
SFR up to 1000
[M/yr].
Bolometric flux and SFR are correlated with the broad-band IR to optical
luminosity ratio:
LIR/LB 0.1 in inactive galaxies (M31, M33),
LIR/LB 3 - 10 in luminous (L 1011 L) SBs,
LIR / LB 100 in ultra-luminous objects (L >
1012 L,
e.g. Arp 220).
6.3. Gas reservoirs, depletion times, starburst
duration
The duration of the starburst is critically related with the mass
fraction of stars
produced during the event and to the available gas reservoir.
Assuming that the SB dominates the spectrum on top of the old stellar
population emission, an estimator of the SB duration is the EW
of the Br line, which is a measure of the ratio of the OB
stellar flux
(the excitation flux) to the red supergiant star flux (evolved OBA stars).
The EW is then expected to evolve monotonically with time.
Also, the comparison of the Br line with the CO NIR absorption lines is
an age indicator
(Rieke et al. 1988).
Moorwood et al. (1996)
find in this way ages of 107 to 108 yrs.
However,
the most direct way to estimate at least an upper limit to the burst
duration
is the comparison of the total mass of molecular material in the galaxy
nucleus with
the estimated SFR, which is also a measure of the efficiency of SF.
The gas mass is usually estimated from mm-wave CO line emission and from
mm continuum
observations of dust emission (assuming suitable conversion factors for
H2/CO and
dust/gas).
Chini et al. (1995)
have found that the two independent evaluations of the molecular mass
provide consistent results, showing that luminous IR galaxies are very
rich in gas (2 × 10⁹ to
2 × 10¹⁰ M).
The ratio
LIR / Mgas assumes enormously
different values in different stages
of galaxy activity: in normal inactive spirals
LIR / Mgas 5 (L/M)
(e.g. M31), in moderate starbursts
LIR / Mgas 20 (M82, NGC253), in
ultra-luminous IR galaxies
LIR / Mgas 200 (Arp 220),
in quasars
LIR / Mgas 500.
A limit to the SB duration is then given by
tdepletion = 1010 Mgas /
LIR yrs, ranging from typically several Gyrs
for inactive spirals down to a few 107 yrs for the more active
SBs.
6.4. Starburst-driven super-winds
There are several evidences that extremely energetic outfows of gas are
taking place in starbursts:
(a) from optical spectroscopy, evidence for Wolf-Rayet lines
indicative of very young SBs (< 107 yrs) and outflow of
ionized gas, with velocities up to 1000 Km/s
(Heckman, Armus & Miley
1990;
Lehnert & Heckman 1996);
(b) from optical imaging there are evidences of bubbles and
cavities left over by large, galactic-scale explosions;
(c) from X-ray spectroscopy, evidence for plasmas at very high
temperatures (up to few KeV), far in excess
of what the gravitational field could explain (e.g.
Cappi et al. 1999).
These highly energetic processes are interpreted as due to radiative
pressure by massive stars, stellar winds and supernovae explosions
occurring in a small volume in the galaxy core, able to efficiently
energize the gas and
to produce a dynamical unbalance followed by a large scale outflow of
the remaining gas.
This phenomenon has relevant implications.
It is likely at the origin of the huge amounts of metals observed
in the Intracluster Plasma (ICP) in local galaxy clusters and groups.
It should be noted that the estimated Fe metallicity of the outflowing
plasma
( 0.2 - 0.3 solar,
Cappi et al. 1999)
is similar to the one observed in the ICP.
Also the higher abundances (1.5-2 solar) observed in the 2 archetypal
starbursts for elements (Si, O, Mg) may indicate that type-II SN
(those produced by very massive stars, M
> 8 M) are mostly responsible
(Gibson, Loewenstein &
Mushotzky 1997).
Similar properties are observed in the hot halo plasmas around
elliptical galaxies,
also rising the question of a possible relationship of the hyper-luminous IR
galaxy phenomenon with the formation of early-type galaxies.
Therefore, the enriched plasmas found in local clusters and groups
may represent the
fossile records of ancient starbursts of the kind we see in local
luminous IR starbursts.
6.5. Starburst models
More precise quantifications of the basic parameters describing the SB
phenomenon require detailed modelling.
The first successful attempt accounting in some detail for the observed
IR and radio data was by
Rieke et al. (1980),
who demonstrated that the remarkable properties of M82 and
N253 are consistent with SB activity.
Since then, a number of groups elaborated sophisticated models of
SBs. These successfully
reproduce SB properties assuming exponentially decaying SFRs with burst
durations of
107 to 108 yrs, whereas both instantaneous and
long duration bursts are excluded.
An important issue addressed by these models is about the stellar IMF
during the burst:
Rieke et al. found that assuming for M82 a Salpeter IMF with standard
low-M cutoff at 0.1 M resulted in a stellar mass exceeding
the limit implied by dynamical mass evaluations.
The problem was resolved by assuming that formation of stars with masses
less than a few
M is strongly suppressed. This result
however is not univocally supported by more recent studies of M82: e.g.
Leitherer and Heckman (1995)
solution is for a 1 to 30 M IMF.
Interesting constraints on the IMF come in particular from the analysis
of CO line kinematics in Arp 220:
Scoville et al. (1996)
indicate that the dynamical mass,
the Lyman continuum, the SFR and the burst timescale can be reconciled
by assuming a IMF truncated outside 5 to 23 M, with a SFR
90 M/yr for stars
within this mass range.
Altogether, there seem to be fairly clear indications for a "top-heavy" mass
function in the more luminous SBs, as compared with quiescent SF in the
Milky Way and in spirals. This has relevant implications for the SFR
history in galaxies,
the cosmic production of light and of heavy elements.
A very detailed modellistic study of starbursts was given by
Leitherer & Heckman
(1995)
and Leitherer et al. (1999),
incorporating all up-to-date improvements in the treatment of stellar
evolution and non-LTE stellar atmospheric models.
The model successfully explains most basic properties of starbursts, as
observed in the optical. Model predictions for a continuous SF over
108 yrs and a 1-30 M
Salpeter IMF, normalized to a SFR=1
M/yr are:
bolometric luminosity = 1.3 1010 L; number of O stars = 2 ×
104;
ionizing photon flux ( < 912Å) =
1.5 1053 photons/sec;
SN rate = 0.02 yr-1; K = -20.5 mag; mass deposition
rate = 0.25 M/yr;
mechanical energy deposition rate =
6 1041 erg/sec.
Important outcomes of these papers are predictions for the EW
of most important line tracers of the SF (H, Pa,
Br), as a function of the time after the onset of SF and
of IMF shape.
Models of dusty starbursts have been discussed by
Silva et al. (1998),
Jimenez et al. (2000),
Siebenmorgen, Rowan-Robinson
& Efstathiou (2000),
Poggianti & Wu (2000),
Poggianti, Bressan &
Franceschini (2001).
The latter two, in particular, address
the question of the classification and interpretation of optical spectra of
luminous IR starbursts: they find that the elusive class of e(a)
(emission+absorption)
spectra, representative of a large fraction (> 50%) of all IR SBs,
are better understandable as ongoing
active and dusty starbursts, in which the amount of extinction is anti-correlated with
the age of the population (the youngest stars are the more extinguished, see
also Sect. 4.2.3), rather than
post-starburst galaxies as sometimes have been interpreted.
6.6. Statistical properties of active galaxy
populations
Statistical properties of SB galaxies provide guidelines to understand
the origin and triggering mechanisms of the phenomenon.
A fundamental descriptor of the population properties is provided by the
Local Luminosity Function (LLF), detailing the distribution of space density
as a function of galaxy luminosity in a given waveband.
While the faint luminosity end is important for cosmogonic purposes
(providing constraints
on the formation models, its flattish shape being roughly similar at all
wavelengths),
SBs and their complex physics dominate at the bright end of the LLF.
Indeed, the latter is observed to undergo substantial changes as a function
of : if the optical/near-IR LLF's display the classical
"Schechter" exponential
convergence at high-luminosities (essentially tracing the galaxy mass
function),
LLF's for galaxies selected at longer wavelengths show flatter and
flatter slopes
(see Fig. 8 below).
This flattening is progressive with going from the optical up to
60 µm. When expressed in differential units (
Mpc-3L-1),
the bright-end slope of the 60 µm LLF is
L60 -2, according to the
extensive sampling by IRAS
(Saunders et al. 1990).
Note that this flattening is not due to the contribution
of AGNs at 60 µm, which is modest here and quite more important instead at 12 µm.
What is progressively increasing with up to
= 60 µ is
the incidence of the starburst contribution to the luminosity: it is the
starbursting nature of 60µ selected galaxies responsible for
the shape of the LLF.
-2, according to the
extensive sampling by IRAS
(Saunders et al. 1990).
Note that this flattening is not due to the contribution
of AGNs at 60 µm, which is modest here and quite more important instead at 12 µm.
What is progressively increasing with up to
= 60 µ is
the incidence of the starburst contribution to the luminosity: it is the
starbursting nature of 60µ selected galaxies responsible for
the shape of the LLF.
It is interesting to consider that almost the same slopes
L-2
are found for all known classes of AGNs, from the luminous radio-galaxies
(Auriemma et al. 1977;
Toffolatti et al. 1987),
to the optical and X-ray quasars
(Miyaji, Hasinger &
Schmidt 2000;
Franceschini et al. 1994b).
Also to note is the evidence that the L-2 slope
for AGNs keeps almost exactly the same at any redshifts, in spite of the
drastic
increase of the source number-density and luminosity with z due
to evolution.
There should be a ruling process originating the same functional law in
a wide variety of categories of active galaxies and remarkably invariant
with cosmic
time, in spite of the dramatic differences in the environmental and
physical conditions of the sources.
This remarkable behaviour may be simply understood as an effect of the
triggering mechanism for galaxy (AGN and starburst) activity:
the galaxy-galaxy interactions (either violent mergers between gas rich
objects or encounters triggering a slight increase of the activity).
The physical mechanism ruling the process is the variation in the
angular momentum
 J/J of the gas induced by the
interaction, and the consequent gas accretion
m/m in the inner galaxy regions
(Cavaliere & Vittorini
2000).
Starting for example from a
J/J of the gas induced by the
interaction, and the consequent gas accretion
m/m in the inner galaxy regions
(Cavaliere & Vittorini
2000).
Starting for example from a  -function-shaped LLF, the
starburst triggered by the interaction produces a transient increase of
L which translates into a distortion of the LF towards the high-L's.
Assumed
m/m is ruled by the probability
distribution of the impact
parameter b, it is simple to reproduce in this way the LLF's observed
asymptotic shape at the high luminosities.
-function-shaped LLF, the
starburst triggered by the interaction produces a transient increase of
L which translates into a distortion of the LF towards the high-L's.
Assumed
m/m is ruled by the probability
distribution of the impact
parameter b, it is simple to reproduce in this way the LLF's observed
asymptotic shape at the high luminosities.
All this points at the interactions as ruling the
probability to observe a galaxy during the active phase.
6.7. Starburst triggering
In normal inactive spirals the disk SFR is enhanced in spiral arms in
correspondence with density waves compressing the gas. This favours the
growth and collapse of molecular clouds and eventually the formation of
stars. This process is, however, slow and inefficient
in making stars (also because of the feedback reaction to gas
compression produced by young stars). This implies that very
long timescales (several Gyrs) are needed to convert the ISM into a
significant stellar component.
On the contrary, because of the extremely high compression of molecular gas
inferred from CO observations in the central regions of luminous
starburst galaxies, SF can proceed there much more efficiently.
Both on theoretical and observational grounds, it is now well
established that the trigger
of a powerful nuclear starburst is due to a galaxy-galaxy interaction or
merger, driving a sustained inflow of gas in the nuclear region.
This gas has a completely different behaviour with respect to stars: it
is extremely dissipative (gas clouds have a much larger cross-section
and in cloud collisions
gas efficiently radiates thermal energy generated by shocks).
A strong dynamical interaction breaks the rotational symmetry and
centrifugal support
for gas, induces violent tydal forces producing very extended tails and
bridges
and triggers central bars, which produce shocks in the leading front,
and efficiently disperse the ordered motions and the gas angular momentum.
The gas is then efficiently compressed in the nuclear region and
allowed to form stars.
These concepts are confirmed by numerical simulations of galaxy encounters.
Toomre (1977)
was the first to suggest
that ellipticals may be formed by the interaction and merging of
spirals. This suggestion
is supported by various kinds of morphological features (e.g. tidal
tails, rings) observed in the real objects and predicted by his
pioneering numerical simulations.
Much more physically and numerically detailed elaborations have more
recently been published by
Barnes and Hernquist (1992),
who model the dynamics of the encounters
between 2 gas-rich spirals including disk/halo components, using a
combined N-body
and gas-dynamical code based on the Smooth Particle Hydrodynamics (SPH).
Violent tidal forces act on the disk producing extended tails and
triggering central bars,
who sweep the inner half of each disk and concentrates the gas into a
single giant cloud.
The final half-mass radii of gas are much less than those of stars: for
an M* galaxy of 10 11 M,
109 M of gas are compressed
within 100-200 pc, with a density of
103 M/pc3
(Barnes & Hernquist
1996).
Various other simulations confirm these finding.
SPH/N-body codes show in particular that the dynamical interaction
in a merger has effects not only on the gas component, but also on the
stellar one,
where the stars re-distribute following the merging and violent relaxation
of the potential.
6.8. Ultra-luminous IR galaxies (ULIRGs)
Defined as objects with bolometric luminosity
Lbol LIR > 1012
L,
they are at the upper rank of the galaxy luminosity function.
A fundamental interpretative problem for this population is to understand
the primary energy source, either an extinguished massive nuclear
starburst, or a deeply buried AGN.
A systematic study of this class of sources was published by
Genzel et al. (1998),
based on ISO spectroscopy of low-excitation and
high-excitation IR lines, as well as of the general shape of the mid-IR SED
(the intensity of PAH features vs. continuum emission; see also
Lutz et al. 1998).
While the general conclusion of these analyses is that star-formation is
the process dominating the energetics in the majority of ultraluminous
IR galaxies,
they have also proven that AGN and starburst activity are often concomitant
in the same source. This fact is also proven by the evidence (e.g.
Risaliti et al. 2000;
Bassani et al. 2000)
that many of the ULIRGs classified by Genzel et al. as
starburst-dominated also show an hidden, strongly photoelectrically
absorbed, hard X-ray spectrum of AGN origin.
Soifer et al. (2000)
have also found that
several ULIRGs show very compact (100-300 pc) structures dominating the
mid-IR flux, a fact they interprete as favouring AGN-dominated emission.
The relative role of SF and AGN in ULIRGs is still to be
quantified, hard X-ray (spectroscopic and imaging) observations
by CHANDRA and XMM, as well as IR spectroscopy by space observatories
(SIRTF, FIRST) will provide further crucial information.
6.9. Origin of elliptical galaxies and galaxy
spheroids
As pointed out for the first time by
Kormendy & Sanders
(1992),
the typical gas densities found by interferometric imaging of CO
emission in ultra-luminous IR galaxies turn out to be very close to the
high values of stellar densities in the cores of E/S0 galaxies.
This is suggestive of the fact that ULIRG's have some relationships with
the long-standing problem of the origin of early-type galaxies and
spheroids.
Originally suggested by
Toomre (1977),
the concept that E/S0 could form in mergers of
disk galaxies immediately faced the problem to explain the dramatic
difference in
phase-space densities between the cores of E/S0 and those of spirals.
Some efficient dissipation is required during the merger, which can be
provided by the gas. Indeed,
the CO line observations in ULIRG's, also combined with those of the
stellar nuclear velocity
dispersions and effective radii, show them to share the same region of
the "cooling diagram" occupied by ellipticals.
Detailed analyses of the H2 NIR vibrational lines in
NGC 6240 and Arp 220
(van der Werf 1996)
have provided interesting information about the
mass, kinematics, and thermodynamics of the molecular gas.
The conclusion is that shocks, the fundamental drivers for dissipation,
can fully explain the origin of the H2 excitation.
The evidence that the H2 emission is more peaked than
stars, and located
in between the two merging nuclei, is consistent with the fact that
gas dissipates and concentrates more rapidly, while stars are expected
to relax violently
and follow on a longer timescale the new gravitational potential ensuing
the merger.
A detailed study of Arp 220 by
van der Werf (1996)
has shown that
most of the H2 line emission, corresponding to
2 × 10¹⁰M
of molecular gas, comes from a region of 460 pc diameter,
the gas mass is shocked at a rate of
40 M/yr, not
inconsistent with a SFR
50 - 100 M/yr as discussed in
Sect. 6.5.
Compared with the bolometric luminosity of Arp 200, this requires
a IMF during this bursting phase strongly at variance with respect to
the Salpeter's
one (eq. 4.13) and either cut at
Mmin > > 0.1 M or
displaying a much flatter shape.
In support of the idea that ellipticals may form through merging
processes there is
evidence coming from high-resolution K-band imaging that the starlight
distribution
in hyper-luminous IR galaxies follows a de Vaucouleurs
r-1/4 law typical of E/S0
(Clements & Baker 1997).
Also proven by simulations, after the formation of massive nuclear star
clusters from the amount of gas (up to 10
10 M) collapsed in the inner Kpc,
part of the stellar recycled gas has low momentum
and further contracts into the dynamical center, eventually producing a
super-massive Black Hole with the associated AGN or quasar activity
(Norman and Scoville 1988,
Sanders et al. 1988).
7. IR GALAXIES IN THE DISTANT UNIVERSE: PRE-ISO/SCUBA RESULTS
We have summarized in previous paragraphs
the main properties of local galaxies when observed at long wavelengths,
and emphasized the unique capability of these observations to unveil
classes of sources,
unnoticeable at other wavelengths, but extremely luminous in the IR.
It was clear from this that the most luminous objects in the universe
and the most violent starbursters can be reliably studied only at these
wavelengths.
Our previous discussion has also illustrated the complexity and
difficulty of modelling the long-wavelength spectra of galaxies,
heavily dependent on the relative geometries of stars and dust.
Now, assumed we have a decent understanding of the local universe and its
IR galaxy populations, we dedicate the next Sections to illustrate and
discuss new emerging facts about their distant counterparts, which
entail important discoveries for cosmology.
The IRAS survey in 1983, allowing the first sensitive all-sky view
of the universe at long wavelengths, is considered as the birth date of
IR astronomy. Most of our knowledge
about local IR galaxies, as previously discussed, comes from the IRAS
database. The fair sensitivity of the IRAS surveys, coupled with the
prominent emission
of IR galaxies at 60-100 µm, have also allowed to
sample and study galaxies
at cosmological distances and to derive first tentative indications for
evolution.
Counts of IRAS galaxies (mostly at 60 µm, where the
S/N was optimum, S including
the source signal and N the instrumental and sky [cirrus] noise) have
been obtained
by Hacking & Houck
(1987),
Rowan-Robinson et
al. (1991),
Gregorich et al. (1995),
Bertin, Dennefeld, Moshir
(1997).
Samples at 60 µm with optical identifications and
radial velocities have been published by
Saunders et al. (1990,
1997),
Lonsdale et al. (1990),
and Oliver et al. (1996).
Early evidence in favour of evolution for IRAS-selected galaxies have been
discussed by
Hacking et al. (1987),
Franceschini et
al. (1988) and
Lonsdale et al. (1990),
among others.
In the models by Franceschini et al. and
Pearson & Rowan-Robinson
(1996),
a sub-population of starburst galaxies including a substantial fraction
(30%) of all galaxies in the local universe evolves as
L(z) = L(0)(1 + z)3.1
(Pearson & Rowan-Robinson) or
L(z) = L(0)e 4.3 (z)
(Franceschini et al.), roughly
reproducing counts and redshift distributions.
(z)
(Franceschini et al.), roughly
reproducing counts and redshift distributions.
However, the IRAS sensitivity was not enough to detect galaxies
at substantial redshifts, apart from a handful of exceptions
(essentially due to gravitational lensing amplifying the flux): the most
distant were found at
z 0.2 - 0.3. Any conclusions based on IRAS data are to
be considered as
preliminary, large-scale inhomogeneities badly affecting these shallow
samples.
Another problem for the IRAS surveys was the uncertain identification
with faint optical counterparts, because of the large
[ 1 arcmin2] IRAS error-box: this
implied a systematic bias towards
associating IRAS sources with the brightest galaxy falling inside it, which
may systematically miss the fainter higher-redshift correct identification.
8. THE BREAKTHROUGHS: DISCOVERY OF THE CIRB
Cosmological background radiations are a fundamental channel of information
about cosmic high-redshift sources, particularly if, for technological
limitations, observations of faint sources in a given waveband are not
possible.
This was clearly the case for the IR/sub-mm domain. The present Section
is dedicated to a review on a recently discovered new cosmic component,
the cosmological
background at IR and sub-millimetric wavelengths (CIRB), an important
achievement
made possible by the NASA's Cosmic Background Explorer (COBE) mission.
To appreciate the relevance of this discovery (anticipated by a detailed
modellistic prediction by
Franceschini et al. 1994),
consider that extragalactic backgrounds at other wavelengths contain
only modest (undiscernible) contributions by distant galaxies.
The Radio background is clearly dominated by radio-loud AGNs;
the Cosmic Microwave Background includes photons generated at
z 1500;
the X-ray and -ray backgrounds are dominated by distant quasars and AGNs.
Also, diffuse light in the optical-UV (and partly the near-IR) will be
hardly depurated
of the foreground contaminations (in particular, Galactic starlight
reflected by high latitude "cirrus" dust, and Zodiacal-reflected Sun-light).
On the other hand, the recently
completed third experiment (DIRBE) of the COBE mission has brought to the
first detection ever (with surprisingly small uncertainties)
of the integrated emission of distant galaxies in the form of an
isotropic signal in the far-IR and sub-mm
(Puget et al. 1996,
Guiderdoni et al. 1997,
Hauser et al. 1998,
Fixsen et al. 1998).
8.1. Observational status about the CIRB
In spite of the presence of very bright foregrounds (Zodiacal and
Interplanetary dust emission, Galactic Starlight, high-latitude "cirrus"
emission), relatively
clean spectral windows exist in the IR suitable for extragalactic research:
the near-IR cosmological window (2-4 µm) and the
sub-mm window (100-500 µm).
At these wavelengths the Zodiacal, Starlight, and emission by high galactic
latitude dust produce two minima in the total foreground intensity,
which is much lower here than it is in the optical-UV.
These spectral windows occur where we would expect to observe the redshifted
photons from the two most prominent galaxy emission features:
the stellar photospheric peak at
1 µm and the one at
100 µm due to dust re-radiation.
The best chances to detect the integrated emission of distant and
primeval galaxies are here.
For a curious coincidence, the (expected) integrated emission
of distant galaxies turns out to be comparable by orders of magnitude to
the Galaxy emission at the Pole and to the Zodiacal light in the near-IR
window. This implies that a delicate subtraction of the foreground
emissions is required to access the extragalactic domain.
Three main observational routes have been followed to measure the CIRB:
- rocket flights of dedicated instrumentation (1970-1990),
now only of historical interest;
- all-sky surveys by space telescopes (IRAS and COBE, 1984-1996);
- indirect estimates based on very high-energy spectral observations of
extragalactic -ray sources
(Stecker, de Jager &
Salomon 1992;
Stanev & Franceschini
1998).
In sky directions outside obvious Galactic sources, like star-forming and
low-galactic latitude regions,
the total far-IR background is due to the contribution of various dust
components in the ISM: galactic dust associated with neutral and ionized
hydrogen,
the interplanetary dust emission, all adding to the isotropic diffuse
flux, the CIRB. The way to subtract these various foregrounds when
estimating the CIRB intensity is to exploit the different
spatial dependencies of the various components, using the correlations with
appropriate dust tracers like the HI 21 cm or H lines.
To subtract the most important foreground in the far-IR, the galactic dust
emission, the simplest procedure is to determine the parameters of the
correlation between the background intensity I and the dust tracers expressed in terms
of equivalent hydrogen column density NH,
and then to evaluate the CIRB as the intercept of the total flux at
NH = 0.
Another method is to perform an all-sky best-fit analysis of a relation like
I =
C1NH(HI) +
C2NH(II) + CIRB,
NH being the column densities
of the dust components associated with the neutral and ionized H,
CIRB being the extragalactic background intensity at the working
wavelength (e.g,
Lagache et al. 1999).
The best-fitting determines the constant C1and
C2 and allows
to estimate a value for the parameter CIRB.
Puget et al. (1996)
first recognized in the
all-sky FIRAS/COBE maps an isotropic signal (independent of Galactic
coordinates) with an intensity that can be represented by the law
B 3.4 × 10⁻⁹(/400µm)-3
W m-2 sr-1 in the 400-1000
µm interval.
This tentative detection has been later confirmed with independent
analyses by various other groups (e.g. by
Fixsen et al. 1998,
who find significant isotropic signal from 200 and 1000
µm), as well as
by analyses of data from the DIRBE experiment on COBE in two broad-band
channels at
= 140 and 240µ
(Hauser et al. 1998).
Finkbeiner, Davies &
Schlegel (2000),
after a very delicate subtraction of the far dominant Galactic and IPD
foregrounds,
found an isotropic signal at 60 and 100 µm with
intensity at the level of
30 10-9 W m-2
sr-1. This latter result is presently under
discussion, but appears to conflict with independent estimates (see
Sect. 8.2).
Recent analyses by
Dwek & Arendt (1998) and
Gorjian, Wright & Chary
(2000)
have tentatively found also a
signal in the near-IR cosmological window at
3.5 µm and in the J, H and K DIRBE
bands, however with
large uncertainties because of the problematic evaluation of the Zodiacal
(scattered) light. Because of this, CIRB estimates particularly in J, H
and K are to be taken more reliably as upper limits.
To avoid overcrowding, we report in Figure 3
only the most recent results from DIRBE
(Lagache et al. 1999;
Finkbeiner, et al. 2000)
and FIRAS
(Fixsen et al. 1998).
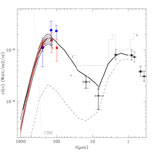
|
Figure 3. The Cosmic Infrared Background
(CIRB) as measured by independent groups in the all-sky COBE maps (e.g.
Hauser et al. 1998),
compared with the optical extragalactic background estimated from ultradeep
optical integrations by the HST in the HDF
(Madau & Pozzetti
2000).
Three datapoints in the far-IR are from a re-analysis of the DIRBE data by
Lagache et al. (1999),
the shaded area from
Fixsen et al. (1998)
and Lagache et al. The two mid-IR points are the resolved fraction of the
CIRB by the deep ISO surveys GITES, while dashed lines are limits set
by TeV cosmic
opacity (Sect. 8.2). The dotted line marks the
expectation based on the assumption that the IR emissivity of galaxies
does not change with cosmic time. The thick line is the predicted CIRB
intensity by the model discussed in Sect. 11.
|
No isotropic signals are significantly detected at
4µ < < 60µ, any cosmological flux being far
dominated here by the
Zodiacal light, the Interplanetary dust (IPD) emission and by Galactic
dust emission
(only missions to the outer Solar System would have chances to reduce the
dominant IPD flux to achieve detection of the CIRB here).
The constraints we report at these wavelengths come from indirect estimates
based on the cosmic high-energy opacity (Sect. 8.2
below).
Altogether, after four years of very active debate among various teams
working
on the COBE data, first about the existence and later on the intensity
and spectral
shape of CIRB, there is now ample consensus even on details of CIRB's
spectral intensity, at least from 140 to 300 µm where
it is most reliably measured and where two completely independent
datasets (FIRAS and DIRBE, with independent
absolute calibrations) are available.
The CIRB flux has in particular stabilized at values
I 24±5
and
I 15±5 10-9
Watt/m2/sr at
= 140 and
240 µm.
Modest differences in the absolute calibration of
FIRAS and DIRBE around 100 µ have been reported
(Hauser et al. 1998),
but these do not seem to affect the overall result.
This was a fundamental achievement for observational cosmology,
providing the
global energy density radiated by cosmic sources at any redshifts.
Two concomitant facts, the very strong K-correction for galaxies in the
far-IR/sub-mm
implied by the very steep and featureless dust spectra, and their relative
robustness due to the modest dependence of dust equilibrium temperature
T on
the field intensity (eq. 3.6]) have suggested to use the CIRB spectrum
to infer the evolution of the galaxy long-wavelength emissivity as a
function of redshift
(Gispert, Lagache & Puget
2000).
Indeed, while the peak intensity at
= 100 to 200 µm constrains the
galaxy emissivity at z = 0 to z = 1, the quality of the
FIRAS intensity maps and the low foreground contamination at
> 200 µm allow to
set important constraints on the universal emissivity at z > 1.
Between 100 and 1000 µm the integrated CIRB intensity
turns out to be 30±5 10-9
Watt/m2/sr. In addition to this
measured part of the CIRB, one has to consider the
presently un-measurable fraction resident in the frequency decade
between 100 and 10 µm.
This flux is larger than the integrated "optical background"
( 17 nWatt/m2/sr, see
Fig. 3),
obtained by counting all galaxies detected between 0.3 and 3
µm by HST down to the
faintest detectable sources. This procedure to estimate the
"optical background" relies on the fact that optical counts show a clear
convergence at magnitudes
mAB 22
(Madau & Pozzetti
2000),
such that the expected
contribution by sources fainter than HST limiting fluxes appears negligible
(a significant upwards revision of this optical background suggested by
Bernstein et al. [1998]
to account for low surface brigtness emission by galaxies is not confirmed).
Already the directly measured part of the CIRB sets a relevant constraint on
the evolution of cosmic sources, when compared with the fact mentioned
in Sect. 4.2.5 that for local galaxies
only 30% of the bolometric flux is absorbed
by dust and re-emitted in the far-IR.
The CIRB's intensity matching or even exceeding the optical
background tells unequivocally that galaxies in the past should have
been much more
"active" in the far-IR than in the optical, and very luminous in an
absolute sense.
A substantial fraction of the whole energy emitted by high-redshift
galaxies should have been reprocessed by dust at long wavelengths.
8.2. Constraints from observations of the cosmic
high-energy opacity
As originally suggested by F. Stecker soon after the discovery of
high-energy
photon emissions from distant blazars, high-energy spectral observations
may provide
a suitable alternative to the direct detection of the CIRB at
wavelengths where it is currently impossible.
The idea is to infer the CIRB intensity from combined GeV and TeV
observations of a set of Blazars by exploiting the
 interaction of their emitted high
energy photons with those of the CIRB.
interaction of their emitted high
energy photons with those of the CIRB.
The absorption cross-section of -rays of energy E [TeV]
has a maximum for IR photons with energies obeing the condition
(Stecker, de Jager &
Salomon 1992):
which implies
| (8.15)
|
The optical depth for a high-energy photon E0
travelling through a cosmic medium
filled of low-energy photons with density (z) from ze to the present time is
| (8.16)
|
Coppi & Aharonian (1999)
report the following analytical approximation, good
to better than 40%, to eq. (8.16):

| (8.17)
|
Interesting applications of this concept have been possible when data from
the Compton Gamma Ray Observatory and from hard X-ray space telescopes
have been combined with observations at TeV energies by the Whipple and
other Cherenkov observatories on the Earth.
Stanev & Franceschini
(1998)
have obtained model-independent upper limits
on the CIRB with no a-priori guess about the CIRB spectrum, using HEGRA data
for the Blazar MKN 501 (z = 0.034) during an outburst in 1997, on the
assumption that the
high-energy source spectrum is the flattest allowed by the data.
These limits (see Fig. 3)
get quite close to the CIRB background already resolved by the ISO
mid-IR deep surveys (see Sect. 9).
More recently,
Krawczynski et al. (1999)
have combined the observations of MKN501
during the 1997 outburst with X-ray data from RossiXTE and BeppoSAX,
providing a simultaneous
high-quality description of the whole high-energy spectrum. These data
are very well fitted
by a Synchrotron Self Compton (SSC) model in which the spectrum at
= 1027Hz is produced
by Inverse Compton of the hard X-ray spectrum at
= 1018Hz: the combination
of the two provides solid constraints on the shape of the "primary"
(i.e. before cosmic attenuation) spectrum at TeV energies. This is used
to derive  as a function of energy and, after eqs. 8.16 and 8.17, a constraint on
the spectral intensity of the CIRB.
The result is compatible with the limits by
Stanev & Franceschini
(1998)
and allows to get a tentative estimate of the CIRB intensity in the
interval from = 10
to 40 µm (see Fig. [3]),
which is formally dependent, however, on the SSC model
adopted for the intrinsic source spectrum.
as a function of energy and, after eqs. 8.16 and 8.17, a constraint on
the spectral intensity of the CIRB.
The result is compatible with the limits by
Stanev & Franceschini
(1998)
and allows to get a tentative estimate of the CIRB intensity in the
interval from = 10
to 40 µm (see Fig. [3]),
which is formally dependent, however, on the SSC model
adopted for the intrinsic source spectrum.
Less model dependent is the constraint set by the observations of purely
power-law Blazar spectra around
E 1 TeV, which translates into the upper limit
of about 10 nanoWatt/m2/sr at
1 µm shown in
Fig. 3.
Substantially exceeding that, as suggested by some authors (Bernstein et
al., Gorjian et al.), would imply either very "ad hoc" -ray source spectra or new physics
(Harwit, Proteroe &
Bierman 1999).
8.3. Contribution of cosmic sources to the CIRB: the
formalism
A simple formalism relates background intensity and cell-to-cell
anisotropies to the statistical properties (luminosity functions and
number counts) of the contributing sources.
8.3.1. Source contribution to the background
intensity
The differential number counts (sources/unit flux interval/unit solid
angle) at a given flux S write:
| (8.18)
|
where
[L(S, z), z] is the
epoch-dependent luminosity function and
dV/dz is the differential volume element.
Flux S and rest-frame luminosity L are related by
| (8.19)
|
where dL is the luminosity distance and
K(L, z) = (1 + z)![$ {L[\nu (1+z)]\over L(\nu)}$](img131.gif) the K-correction.
The contribution of unresolved sources (sources fainter than the
detection limit Sd) to the background intensity is
given by:
the K-correction.
The contribution of unresolved sources (sources fainter than the
detection limit Sd) to the background intensity is
given by:
| (8.20)
|
having defined the volume emissivity jeff(z) as
| (8.21)
|
where Lmin and
Lmax are the minimum and the maximum source
luminosities. From eq. (8.20) we can note that, when the counts converge
like dN/dS S-2 or flatter, the contribution by
faint sources to the
background intensity becomes almost insensitive to the source minimum flux
[I ln(Smin) or less]. This
property has been used by
Madau & Pozzetti (2000)
to estimate the optical background intensity (see
Fig. 3) from ultra-deep HST
counts of galaxies, by exploiting the convergence of the optical counts
fainter than mAB 22. A similar property of faint IR sources is used in
Sect. 9.4 to estimate the
contribution of IR galaxies to the CIRB.
8.3.2. Small scale intensity
fluctuations
In addition to the average integrated flux by all sources in a sky area,
the background radiation contains also spatial information (the
cell-to-cell fluctuations) which can be used to further constrain the
source flux distribution and spatial correlation properties (e.g.
De Zotti et al. 1996).
The usually most important contribution to the cell-to-cell intensity
fluctuations comes from the stochastic nature of the spatial
distribution of sources among elementary cells with an effective solid
angle
 (Poisson fluctuations). They can be
expressed as
(Poisson fluctuations). They can be
expressed as
| (8.22)
|
What is really measured, however, is not
the flux S but the detector's response
x = f ( ,
, )S,
f (,) being the angular power pattern of the detector.
Let R(x) =
dN
)S,
f (,) being the angular power pattern of the detector.
Let R(x) =
dN x /
f (,)
x /
f (,)![$ \left.\vphantom{x/f(\vartheta , \varphi )}\right]$](img143.gif) /
dS . d/f (,)
be the mean number of source responses of intensity x.
For a Poisson distribution of the number of sources producing a response
x, its variance equals the mean R(x)dx.
Adding the variances of all responses up to the cutoff value
xc (brighter
sources are considered to be individually detected) gives
the contribution of unresolved sources to fluctuations:
/
dS . d/f (,)
be the mean number of source responses of intensity x.
For a Poisson distribution of the number of sources producing a response
x, its variance equals the mean R(x)dx.
Adding the variances of all responses up to the cutoff value
xc (brighter
sources are considered to be individually detected) gives
the contribution of unresolved sources to fluctuations:
| (8.23)
|
The cutoff xc is chosen to be some factor q times
(I)2;
usually q = 3-5. The rms background fluctuations (I) imply a sky noise
 =
=  (I)2
(I)2 for observations with spatial resolution
 .
.
The integrated signal D recorded by the detector
is the sum of the responses x due to all sources in the angular
resolution element. Its probability distribution function
P(D) is informative on the amplitude and slope of counts
of unresolved sources.
Scheuer (1957)
has shown that its Fourier transform, p(), is a simple
function of the FT r() of R(x):
p() = exp[r() - r(0)].
It follows:
| (8.24)
|
This synthetic P(D) has to be convolved with the noise
distribution to be compared with the
observations. Assumed that the number count distribution below the
detection limit can be represented as a power-law,
N( > S) = K(S /
Sk)- , then eq. [8.24] can be integrated to get
(Condon 1974):
, then eq. [8.24] can be integrated to get
(Condon 1974):
| (8.25)
|
which allows to estimate the slope of the counts () below the detection
limit from a given measured value of the cell-to-cell fluctuations
.
This constraint on N(S) applies down to a flux limit
corresponding to
1 source/beam. Assumed that Sk
represents the confusion limit (Sk = q × ) of a survey having an areal resolution
,
then eq. 8.25 further simplifies to a relation
between the number of sources K resolved by the survey (and
brighter than Sk) and the parameters q and :
| (8.26)
|
this implies the confusion limit to occur at the flux corresponding to
an areal density of
(q2/[2 - ])-1 sources per unit beam area
. For euclidean
counts and q = 3, this corresponds to 1 source/27
beams. Confusion limits based on this
criterion for various IR observatories are indicated in
Figs. 6 and
7 below.
9. DEEP SKY SURVEYS WITH THE INFRARED SPACE OBSERVATORY (ISO)
ISO has been the most important IR astronomical
mission of the 1990s. Launched by ESA, it consisted of a 60 cm
telescope operative in a highly eccentric 70000 Km orbit. It included
two instruments
of cosmological interest (in addition to two spectrographs): a mid-IR
32×32 camera
(ISOCAM, 4 to 18 µm), and a far-IR imaging photometer
(ISOPHOT, with small
3×3 and 2×2 detector arrays from 60 to 200 µm).
The whole payload was cooled to 2 K by a He3 cooling
system so performant to allow
ISO to operate for 30 months (Nov 1995 to Apr 1998), instead of the
nominal 18 months. An excellent review of the extragalactic results from
ISO can be found in
Genzel & Cesarsky
(2000).
9.1. Motivations for deep ISO surveys
While designed as an observatory-type mission, the vastly improved
sensitivity offered by ISO with respect to the previous IRAS surveys
motivated to spend a
relevant fraction of the observing time to perform a set of deep sky
explorations
at mid- and far-IR wavelengths. The basic argument for this was to parallel
optical searches of the deep sky with complementary observations
at wavelengths where, in particular, the effect of dust is far less
effective in extinguishing optical light. This could have been particularly
relevant for investigations of the distant universe, given the large
uncertainties implied by the (pobably large) extinction corrections in
optical spectra of high redshift galaxies (e.g.
Meurer et al. 1997).
Observations in the mid- and far-IR also sample the portion of the
e.m. spectrum dominated by dust re-processed light, and are then ideally
complementary to optical
surveys to evaluate the global energy output by stellar populations and
active nuclei.
Organized in parallel with the discovery of the CIRB,
a major intent of the deep ISO surveys was to start to
physically characterize the distant sources of the background and to single
out the fraction contributed by nuclear non-thermal activity in AGNs.
Finally, exploring the sky to unprecedented sensitivity limits
should have provided an obvious potential for discoveries of new
unexpected phenomena
from our local environment up to the most distant universe.
9.2. Overview of the main ISO surveys
Deep surveys with ISO have been performed in two wide mid-IR
(LW2: 5-8.5µm and LW3: 12-18µm)
and two far-IR ( = 90 and 170 µm) bands.
The diffraction-limited spatial resolutions were 5 arcsec at 10 µm and
50 arcsec at 100 µm. Mostly because of
the better imaging quality, ISO sensitivity limits in the mid-IR are 1000
times better than at the long wavelengths (0.1 mJy versus 100 mJy).
At some level the confusion problem will remain a fundamental limitation
also for future space missions (SIRTF, FIRST, ASTRO-F).
A kind of compensation to these different performances as a function
of derives from the typical FIR
spectra of galaxies and AGNs, which are almost typically one order of
magnitude
more luminous at 100 µm than at 10 µm.
We detail in the following the most relevant programs of ISO surveys.
= 90 and 170 µm) bands.
The diffraction-limited spatial resolutions were 5 arcsec at 10 µm and
50 arcsec at 100 µm. Mostly because of
the better imaging quality, ISO sensitivity limits in the mid-IR are 1000
times better than at the long wavelengths (0.1 mJy versus 100 mJy).
At some level the confusion problem will remain a fundamental limitation
also for future space missions (SIRTF, FIRST, ASTRO-F).
A kind of compensation to these different performances as a function
of derives from the typical FIR
spectra of galaxies and AGNs, which are almost typically one order of
magnitude
more luminous at 100 µm than at 10 µm.
We detail in the following the most relevant programs of ISO surveys.
9.2.1. The ISOCAM Guaranteed Time (GT)
Extragalactic Surveys
Five extragalactic surveys with the LW2 and LW3 filters have been performed
in the ISOCAM GT (GITES, P.I. C. Cesarsky), including large-area shallow
surveys and
small-area deep integrations. A total area of 1.5 square degrees in the
Lockman Hole and the "Marano" southern field have been surveyed, where more
than one thousand sources have been detected
(Elbaz et al. 1999).
These two areas
were selected for their low zodiacal and cirrus emissions and because of
the existence of data at other wavelengths (optical, radio, X).
9.2.2. The European Large Area ISO Survey
(ELAIS)
ELAIS is the most important program in the ISO Open Time (377
hours, P.I. M. Rowan-Robinson, see
Oliver et al. 2000a).
A total of 12 square degrees have been surveyed at 15
µm with ISOCAM
and at 90 µm with ISOPHOT, 6 and 1 sq. degrees have been
covered with the two instruments at 6.7 and 170 µm.
To reduce the effects of cosmic variance, ELAIS was split into
4 fields of comparable size, 3 in the north, one in the south, plus six
smaller areas.
While data analysis is still in progress, a source list of over 1000
(mostly 15 µm)
sources is being published, including starburst galaxies and AGNs
(type-1 and type-2),
typically at z < 0.5, with several quasars (including various BAL QSOs)
found up to the highest z.
9.2.3. The ISOCAM observations of the two Hubble
Deep Fields
Very successful programs by the Hubble Space Telescope have been the two
ultradeep exposures in black fields areas, one in the North and the
other in the South, called the Hubble Deep Fields (HDF).
These surveys promoted a substantial effort of multi-wavelength studies
aimed at characterizing the SEDs of distant and high-z galaxies. These
areas, including the Flanking Fields for a total of 50 sq. arcmin,
have been observed by ISOCAM (P.I. M. Rowan-Robinson) at 6.7 and 15
µm,
achieving completness to a limiting flux of 100 µJy
at 15 µm.
These have been among the most sensitive surveys of ISO and have allowed to
discover luminous starburst galaxies over a wide redshift interval up
to z = 1.5
(Rowan-Robinson et
al. 1997;
Aussel et al, 1999).
In the inner 10 sq. arcmin, the exceptional images of HST provided a detail
morphological information for ISO galaxies at any redshifts (see
Figure 4).
Furthermore, these two fields benefit by an almost complete redshift
information
(Cohen et al. 1999),
allowing a very detailed characterization of the faint distant IR sources.
9.2.4. ISOCAM survey of two CFRS
fields
Two fields from the Canada-France Redshift Survey (CFRS) have been
observed with ISOCAM to intermediate depths: the '14+52' field (observed
at 6.7 and
15 µm) and the '03+00' field (with only
15µm data, but twice as deep).
The CFRS is, with the HDFs, one of the best studied fields with
multi-wavelength data.
Studies of the galaxies detected in both fields have provided the first
tentative interpretation of the nature of the galaxies detected in
ISOCAM surveys
(Flores et al. 1999).
9.2.5. The ISOPHOT FIRBACK survey
program
FIRBACK is a set of deep cosmological surveys in the far-IR,
specifically aimed at detecting at 170 µm the sources
of the far-IR background (P.I. J.L. Puget, see
Puget et al. 1999).
Part of this survey was carried out in the Marano area, and
part in collaboration with the ELAIS team in ELAIS N1 and N2, for a
total of 4 sq. degrees.
This survey is limited by extragalactic source confusion in the large
ISOPHOT beam (90 arcsec) to
S170 100 mJy. Some constraints
on the counts below the confusion limit obtained from a fluctuation
analysis of one Marano/FIRBACK field are discussed by
Lagache & Puget (2000)
(Sect. 9.4).
The roughly 300 sources detected are presently
targets of follow-up observations, especially using deep radio exposures
of the same area to help reducing the large ISO errorbox and to
identify the optical counterparts. Also an effort is being made
to follow-up these sources with sub-mm telescopes (IRAM, SCUBA): this
can provide significant constraints on the redshift of sources which
would be otherwise very difficult to measure in the optical
(Sect 12.2).
9.2.6. The Lensing Cluster Surveys
Three lensing galaxy clusters, Abell 2390, Abell 370 and Abell 2218,
have received very long integrations by ISOCAM
(Altieri et al 1999).
The lensing has been exploited to achieve even better
sensitivities with respect to ultra-deep blank-field surveys (e.g. the
HDFs),
and allowed detection of sources between 30 and 100
µJy at 15 µm.
However this was obviously at the expense of distorting the areal projection
and ultimately making uncertain the source count estimate.
9.2.7. The Japanese Guaranteed Time
surveys
An ultra-deep survey of the Lockman Hole in the 7µm ISOCAM
band was performed by Taniguchi et al.
(1997;
the survey field is different from that of the GITES Lockman survey).
Another field, SSA13, was covered to a similar depth (P.I. Y. Taniguchi).
The Lockman region was also surveyed with ISOPHOT
by the same team: constraints on the source counts at 90 and 175
µ were derived by
Matsuhara et al. (2000)
based on a fluctuation analysis.
9.3. Data reduction
ISOCAM data need particular care to remove the effects of glitches induced
by the frequent impacts of cosmic rays on the
detectors (the 960 pixels registered on average 4.5 events/sec).
This badly conspired with the need to keep them cryogenically cooled to
reduce the instrumental noise, which implied a slow electron reaction time
and longterm memory effects. For the deep surveys this implied a problem to
disentangle faint sources from trace signals by cosmic ray impacts.
To correct for that, tools have been developed by various groups for the
two main instruments (CAM and PHOT),
essentially based on identifying patterns in the time history
of the response of single pixels, which are specific to either astrophysical
sources (a jump above the average background flux when a source
falls on the pixel) or cosmic ray glitches (transient spikes followed by
a slow recovery to the nominal background). The most performant algorithm
for CAM data reduction is PRETI
(Stark et al. 1999),
a tool exploiting multi-resolution
wavelet transforms (in the 2D observable plane of the position on the
detector vs. time sequence). An independent method limited to brighter
flux sources, developed by
Désert et al. (1999),
has been found to provide consistent
results with PRETI, in the flux range in common. Other methods have been
used by
Oliver et al. (2000a)
and Lari et al. (2000).
These various detection schemes and photometry algorithms have been tested
by means of very sophisticated Monte Carlo simulations, including all
possible artifacts introduced by the analyses.
With simulations it is has been possible to control as a function
of the flux threshold: the detection reliability, the completeness, the
Eddington bias and photometric accuracy (10% where enough redundancy was available, as for
CAM HDFs and Ultradeep surveys).
Also the astrometric accuracy is good (of order of 1-2 arcsec for deep
highly-redundant
images), allowing straightforward identification of the sources
(Aussel et al. 1999,
see Fig. 4).
The quality of the results for the CAM surveys is proven by the very
good consistency of the counts from independent surveys (see
Fig. [5] below).
Longer wavelength ISOPHOT observations also suffered from similar problems.
The 175µm counts from PHOT C200 surveys are reliable
above the confusion limit
S170 100 mJy, and required only relatively standard
procedures of baseline corrections and "de-glitching".
More severe are the noise problems for the C100 90µm
channel, which would
otherwise benefit by a better spatial resolution than C200.
The C100 PHOT survey dataset is still presently under analysis.
9.4. Mid-IR and far-IR source counts from ISO
surveys
IR-selected galaxies have typically red colors, because of the dust
responsible for the excess IR emission. The most distant are also
quite faint in the optical. For this reason the redshift information is
available only for very limited subsamples (e.g. in the HDF North and
CFRS areas). In this situation, the source number counts, compared with
predictions based on the local luminosity function, provide important
constraints on the evolution properties.
Particularly relevant information comes from the mid-IR samples selected
from the CAM
GITES and HDF surveys in the LW3 (12-18 µm) filter,
because they include the faintest, most distant and most
numerous ISO-detected sources. They are also easier to identify because
of the small ISO error box for redundant sampling at these wavelengths.
Surveys of different sizes and depths are necessary to cover a wide dynamic
range in flux with enough source statistics, which justified performing
a variety of independent surveys at different flux limits.
The differential counts based on these data, shown in
Fig. 5,
reveal an impressive agreement between so many independent samples.
Including ELAIS and IRAS survey data, the range in fluxes would reach
four orders of magnitude.
The combined 15 µm differential counts display
various remarkable features
(Elbaz et al. 1999):
a roughly euclidean slope from the brightest IRAS observed fluxes down to
S15 5 mJy, a sudden upturn at
S15 < 3 mJy, with the counts increasing as
dN S-3.1dS to
S15 0.4mJy, and evidence for a
flattening below S15 0.3mJy (where the slope becomes quickly
sub-Euclidean, N S-2).
The areal density of ISOCAM 15µm sources
at the limit of 50-80 µJy is 5 arcmin-2.
This is nominally the ISO confusion limit at 15 µm,
if we consider that the
diffraction-limited size of a point-source is 50 arcsec2:
from eq. (8.26) and for = - 2, confusion sets in at a source areal density
of 0.1/resolution element, or 7/arcmin2 in our case.
The IR sky is so populated at these wavelengths that ISO was confusion
limited longwards of = 15 µm. This will also be the
case for NASA's SIRTF
(due to launch in mid 2002), in spite of the moderately larger primary
collector (85cm).
Obviously, far-IR selected samples are even more seriously affected by
confusion.
The datapoints on the 175µm integral counts reported
in Fig. 6
come from the FIRBACK survey. Similarly deep observations at 90, 150 and
175 µm are reported by
Iuvela, Mattila & Lemke
(2000).
Given the moderate depth of these direct counts,
background fluctuation analyses were used to constrain their
continuation below the survey detection limit. The analysis of small-scale
fluctuations in one FIRBACK field by
Lagache & Puget (2000)
produced
0.07 MJy/sr with a beam of size
6 10-4 sr.
From eq. [8.25], this may be used to constrain the continuation of the
counts in Fig. 6 fainter than 100 mJy.
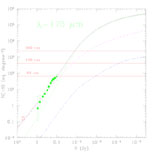
|
Figure 6. Integral counts based on the
ISOPHOT FIRBACK survey (Sect.10.2.5) at
= 175 µm (filled circles,
from
Dole et al. 2000)
and on the ISOPHOT
Serendipitous survey. The dashed and dot-dashed lines correspond to
the non-evolving and the strongly evolving populations as in
Fig. 5.
The lowest curve is the expected (negligible) contribution of AGNs.
The horizontal lines mark the confusion limits for three
telescope sizes (based on eq. 8.26): the lines marked "60cm" and "360cm"
correspond to the ISO and FIRST limits for faint source detection.
|
The 15µm counts in Fig. 5
display a remarkable convergence below
S15 0.2 mJy, proven by at least three independent
surveys. The
asymptotic slope flatter than -1 in integral count units implies a
modest contribution
to the integrated CIRB flux by sources fainter than this limit, unless a
sharp upturn of the counts would happen at much fainter fluxes
with very steep number count distributions, a rather unplausible situation.
A meaningful estimate of the CIRB flux can then be obtained from direct
integration of the observed mid-IR counts (the two datapoints at 15 and 7
µm in Fig. 3).
If we further consider how close these are to the upper limits set by
the observed TeV cosmic opacity
(Fig. 3), the ISOCAM surveys appear to
have
resolved a significant (50-70%) fraction of the CIRB in the mid-IR.
On the other hand, the depth of the ISO far-IR surveys (FIRBACK) is not
enough to resolve more than ten percent of the CIRB at its peak wavelenth.
10. EXPLORATIONS OF THE DEEP UNIVERSE BY LARGE MILLIMETRIC
TELESCOPES
Galaxy surveys in the sub-millimeter waveband offer a unique advantage
for the exploration of the distant universe: the capability to naturally
generate volume-limited samples from a flux-limited survey.
This property is due to the peculiar shape of galaxy spectra in the
sub-mm, with an extremely steep slope from 1 mm to 100 µm,
as illustrated in Figure 2 for the
prototype dusty starburst galaxy M82.
While above a few mm the luminosity is dominated by synchrotron and
free-free radio emission, from 100 µm to 1 mm dust continuum
emission dominates, with slopes as steep as
L()  (see Sect. 3).
Then, as we observe at sub-mm wavelengths galaxies
at larger and larger redshifts, the rest-frame flux density
moves to higher and higher frequencies along a steeply increasing
spectrum, and the corresponding K-correction almost completely
counter-balances the cosmic dimming of the observed flux, for a source
of given luminosity at z 1.
The source flux keeps roughly constant with redshift up to z 10,
assuming cosmic sources were already present and dusty so early.
(see Sect. 3).
Then, as we observe at sub-mm wavelengths galaxies
at larger and larger redshifts, the rest-frame flux density
moves to higher and higher frequencies along a steeply increasing
spectrum, and the corresponding K-correction almost completely
counter-balances the cosmic dimming of the observed flux, for a source
of given luminosity at z 1.
The source flux keeps roughly constant with redshift up to z 10,
assuming cosmic sources were already present and dusty so early.
A further related advantage of sub-mm surveys is that local
galaxies emit very modestly at these wavelengths. Together with the
very favorable K-correction, this implies that a sensitive sub-mm survey
will avoid local objects (stars and nearby galaxies) and will select
preferentially sources at high and very high redshifts: a kind of
direct picture of the high-redshift universe, impossible
to obtain at other frequencies, where surveys are dominated by galaxies at
modest redshifts if not by galactic stars.
Finally, and similarly to the ISO surveys, observing in the sub-mm has
the advantage
of producing samples completely unaffected by intergalactic opacity and
dust extinction.
The third breakthrough event after 1996 for IR/sub-mm cosmology has come
from operation of a powerful array of bolometers (SCUBA) at the focal
plane of the sub-mm telescope JCMT on Mauna Kea.
The success of SCUBA on JCMT was due to a combination of three crucial
factors: a sensitive detector array with good multiplexing capability
(37 bolometers on a field of 2 arcmin diameter, with a diffraction-limited
spatial resolution of 15 arcsec),
put at the focal plane of a powerful sub-mm telescope (15m dish),
on a site allowing to operate at short enough wavelengths (850
µm) to exploit the very steep shape of sub-mm SED's
of galaxies.
For comparison, in spite of the larger collecting area, the competing
bolometer array camera
on the IRAM 30m telescope at Pico Veleta (Spain) is limited to work at
wavelengths > 1.2 mm
by the poorer, lower-altitude site, which means by itself a factor 5
penalty in the detectable source flux with respect to SCUBA/JCMT.
The latter had a long development phase (almost like a space project!),
partly because of the difficulty to keep the microphonic noise within
acceptable limits. But eventually, its long-sought results have come, and
the instrument is providing new very exciting facts to observational
cosmology.
Basically, SCUBA/JCMT has allowed to partly resolve the long- (850 µm)
CIRB background into a population of faint distant, mostly high-z sources,
as discussed in Sect. 12.3 below. During
three years of activity, largely dedicated to
deep surveys, SCUBA has discovered several tens of sub-millimetric sources,
mostly at 850 µm.
Four main groups have used SCUBA for a variety of deep integrations.
Smail et al. (1997,
1999)
have undertaken an ingenious program exploiting
distant galaxy clusters as cosmic lenses to amplify the flux of
background sub-mm sources and to improve the spatial resolution at the
source. Their sample includes now 17 sources brighter than
S850 = 6 mJy.
Hughes et al. (1998)
published a single very deep image of the HDF North containing 5 sources at
S850(4 ) 2 mJy.
Barger et al. (1998),
while detecting only 2 sources down to 3 mJy, have
carried out a very successful program of follow-up of SCUBA sources with
optical telescopes on Mauna Kea.
Eales et al. (1999)
and Lilly et al. (1999)
have published 12 sources to 3 mJy
[a richer sample of 20 more sources is being published].
All these deep integrations are requiring many tens of hours each of
especially good weather, which meant a substantial fraction of the JCMT
observatory time.
In spite of this effort, the surveyed areas (few tens of
arcmin2) and number of detected
sources are quite modest, which illustrates the difficulty to work from
ground at these wavelengths.
The extragalactic source counts at 850 µm, reported in
Figure 7,
show a dramatic departure from the Euclidean law [N( >
S) S-2
in the crucial flux-density interval from 1 to 10 mJy], a clear
signature of the strong
evolution and high redshift of SCUBA-selected sources.
Only 4 of them have been detected also at 450 µm, the
sky transmission at Mauna Kea in this atmospheric channel is usually
poor.
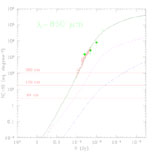
|
Figure 7. Integral counts at
= 850 µm (see also
caption to Fig. 6).
|
More recently, a new powerful bolometer array (MAMBO) has been put in
operation on IRAM.
Bertoldi et al. (2000)
report the first results of observations at
= 1.2 mm from a survey of 3 fields
with a total area of over 300
arcmin2 to a flux limit of few mJy.
11. INTERPRETATIONS OF FAINT IR/MM GALAXY COUNTS
11.1. Predictions for non-evolving source populations
in the mid-IR
A zero-th order approach to interprete the deep count observations is to
compare them with the expectations of
models assuming no-evolution for cosmic sources. Any such calculations
have to account for the effects of the very complex spectrum of
galaxies in the mid-IR (including strong PAH emission and
silicate absorption features, see Fig. 9) in the
K-correction factor appearing in
eq. (8.19), which in terms of the system transmission function
T()
is more appropriately written as:
The effect on the source flux and on the counts [eq. 8.18]
may be particularly important in the wide LW3 (12-18
µm) filter. The prominent mid-IR features imply a
complication when interpreting the counts,
but at the same time they imply an enhanced sensitivity
of the LW3 source selection to the details of the evolution of sources
in the redshift interval 0.5 < z < 1.3, which is known to
be so critical for the formation of structures in the universe.
Local mid-IR luminosity functions have been published by
Rush et al. (1993),
Xu et al. (1998) and
Fang et al. (1998)
based on the 12 µm
all-sky IRAS survey, see Figure
8. Unfortunately, in spite of the proximity of the
CAM LW3 and IRAS 12 micron bands, at the moment we do not have a reliable
LLF at 15 µm because of: a) uncertainties in the IRAS
12 µm photometry,
b) the effects of local inhomogeneities, particularly the
local Virgo super-cluster; and c) the flux conversion between the IRAS
and CAM-LW3 bands
(Elbaz et al. 1999).
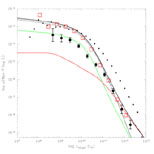
|
Figure 8. Galaxy LLF's at 12
µm from Xu et al.
(1998,
red open squares) compared
with the IRAS 60 µm LLF by Saunders et al.
(1990,
small filled squares).
Black ellipses are an estimate of the 12 µm LLF of
active galaxies (including
type-I [red line] and type-II AGNs plus starbursts [green line]) based
on the (revised) catalogue by
Rush et al. (1993).
Active galaxies clearly dominate the LLF at high luminosities.
|
The dotted line in Fig. 5 corresponds
to the present
best estimate of the contribution from a non-evolving population
with a luminosity function consistent with that in the IRAS 12
µm band derived by
Xu et al. and Fang et al. The correction to the CAM LW3 band
is made assuming a 12 to 15 µm flux ratio which is a
function
of the 12 µm luminosity: for the less luminous
objects the ratio
is based on the observed mid-IR spectrum of quiescent spirals, while for
the highest luminosity galaxies the ratio is the one expected for
ultraluminous
IR galaxies, and for intermediate objects it is close to a typical
starburst spectrum
like the one of M82 (see continuous line in
Fig. 9).
The 15 to 12 µm flux ratio increases continuously
with luminosity, the
flux at long-wavelength being increasingly dominated by the starburst
emission.
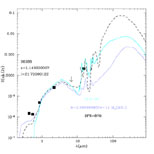
|
Figure 9. Broad-band spectrum of a mid-IR
source selected by ISOCAM LW3 in the Hubble Deep Field North
(Aussel et al. 1999),
compared with
the SED's of M82 (thick continuous line), Arp 220 (dashed line), and M51
(dotted line). Estimates of the SF rate [based on the M82 and Arp 220
templates] and of the stellar mass [based on the M51 template] are
indicated.
|
It is clear that the no-evolution prediction, even taking into account the
effects of the PAH features on the K-corrections, falls very short of the
observed counts at fluxes fainter than a few mJy. Also the observed slope
in the 0.4 to 4 mJy flux range (N[S] S-3±0.1)
is very significantly different from the no-evolution predicted dependence
N(S) S-2.
The extrapolation to the bright fluxes is instead consistent, within the
uncertainties,
with the IRAS 12 µm counts with a slope close to
Eclidean.
11.2. Evidence for a strongly evolving population of
mid-IR galaxies
The shape of the differential counts shown in
Fig. 5 contains relevant
indications about the properties of the contributing source populations.
In particular the almost flat (Euclidean) normalized
counts extending from the bright IRAS fluxes down to a few mJy, followed
by the sudden
upturn below, suggests that is not likely the whole population of IR
galaxies that evolve:
in this case and for the observed IR galaxy LLF, the super-Euclidean
increase in the counts would appear at brighter fluxes and not be as
abrupt. This behaviour is better consistent with a locally
small fraction of IR galaxies to evolve.
The IR counts in Fig. 5 are reproduced
with the contribution of two
source populations, one evolving, the other with constant properties as
a function of time. The local fraction of the evolving starburst
population is only several percent of the total, consistent with the
observed fraction of interacting galaxies ( 5% locally), the quick upturn in the counts then
requiring quite a strong evolution to match the peak in the normalized
counts around S15 0.5 mJy.
The details of the fit depend on the assumed values for the
geometrical parameters of the universe. For a zero- open universe (in our case
H0 = 50 Km/sec/Mpc,
open universe (in our case
H0 = 50 Km/sec/Mpc,  = 0.3),
a physically credible solution would require a redshift increase of the
comoving density of the starburst sub-population and at the same time an
increase of the luminosities respectively as
= 0.3),
a physically credible solution would require a redshift increase of the
comoving density of the starburst sub-population and at the same time an
increase of the luminosities respectively as

| (11.27)
|
These are quite extreme evolution rates, if compared with those observed
in optical samples for the merging and interacting galaxies (e.g.
Le Fevre et al. 2000).
The inclusion of a non-zero cosmological constant, and the corresponding
increase of the cosmic
timescale from z = 0 to 1, tend to make the best-fitting evolution rates
less extreme. For
H0 = 50 Km/sec/Mpc, = 0.2,  = 0.8, a best-fit to the counts
requires:
= 0.8, a best-fit to the counts
requires:

| (11.28)
|
To be consistent with data on the z-distributions from the ISO
source samples in the HDF
(Aussel et al. 1999,
2000,
see Fig. 10) and with the observed
CIRB intensity, this fast evolution should turn over
at z 1 and the IR emissivity should keep roughly constant
at higher z. An accurate probe, however, of hidden SF in the
interval
1  z 2 will only
be possible with the longer-wavelength broad-band channel of SIRTF at
= 24 µm.
z 2 will only
be possible with the longer-wavelength broad-band channel of SIRTF at
= 24 µm.
In our scheme, any single galaxy would be expected to spend most of
its life in the
quiescent (non-evolving) phase, being occasionally put by interactions
in a short-lived
(few 107 yrs) starbursting state. The evolution for
the latter may simply be due
to an increased probability in the past to find a galaxy in such an
excited mode.
Then the density evolution in eq. (11.28) scales with redshift as the
rate of interactions due to a simple geometric effect following the
increased source volume density.
The luminosity evolution may be interpreted as an effect of the larger
gas mass available to the starbursts at higher z.
Note, however, that the above evolutionary scheme is by no means the
only one able to fit the data, other solutions may be devised (e.g. the
one by
Xu [2000]
allowing the whole local population to evolve with cosmic time).
11.3. A panchromatic view of IR galaxy
evolution
Deep surveys at various IR/sub-mm wavelengths can be exploited to
simultaneously constrain the evolution properties and broad-band spectra
of faint IR sources.
Franceschini et al. (2000)
have compared the 15 µm survey data with those coming
from
the IRAS 60 µm, the FIRBACK 175
µm, the ELAIS 90 µm, and the SCUBA
850 µm surveys, which are the deepest, most reliable
available at the moment. Information on both number counts and the
source redshift distributions were used in these comparisons.
Further essential constraints, providing the local boundary conditions
on the
evolution histories, are given by the multi-wavelength local luminosity
functions.
In addition to the 12 and 15 µm LLF's, as discussed
in Section 11.1,
the galaxy LLF is particularly well known at 60 µm
after the IRAS all-sky
surveys and their extensive spectroscopic follow-up
(Saunders et al. 1990).
Dunne et al.
(2000,
see also
Franceschini, Andreani,
Danese 1998)
attempted to constrain
the galaxy LLF in the millimeter, based on mm observations of
complete samples of IRAS 60 µm galaxies.
As previously mentioned, the properties of LLF's observed at various
IR/sub-mm wavelengths
can be explained only assuming that the galaxy IR SED's depend on
bolometric luminosity.
Fig. 8 shows that the 60µm
LLF has a flatter
(power-law) shape at high-L compared with the mid-IR LLF's (a fact
explained in
Sect. 6.6 as an effect of spectra for
luminous active galaxies showing excess 60 µm
emission compared to inactive galaxies [see also the L-dependence of the
IRAS colours]).
Franceschini et al. (2000)
have modelled in some detail the redshift-dependent
multi-wavelength LLF's of galaxies by assuming for both non-evolving
spirals and active starburst galaxies spectral energy distributions
dependent on luminosity, with spectra ranging from those typical of
inactive spirals for low-luminosities,
to the 60µm-peaked spectra of luminous and
ultra-luminous IR galaxies as previously described.
For the SED's of intermediate luminosity objects, linear
interpolations between the two as a function of bolometric luminosity
were assumed.
This allows to simultaneously fit the LLF's at the various wavelengths.
For comparison, solutions with single spectral energy distributions for the
evolving populations were also tried.
Altogether, the observed long-wavelength counts and CIRB intensity, when
compared with typical galaxy SED's and the multi-wavelength LLFs,
require a substantial increase of the IR volume emissivity of galaxies
with redshift
(see Figs. 3,
5, 7).
Should one assume that the IR SED of the ultra-luminous galaxy Arp 220 is
representative of the average spectrum of the evolving population detected
by ISOCAM LW3, then the consequence would be that the observed far-IR
counts and the CIRB intensity are far exceeded.
On the contrary, if we assume for the IR evolving sources a more typical
starburst
spectrum (like the one of M82, by all means similar to those of other
luminous
starbursts observed by ISO), then most of the observed properties
of far-IR galaxy samples (number counts, redshift distributions,
luminosity functions)
are appropriately reproduced. Best-fits to the counts based on the M82
template
are given in Figs. 6 and
7.
The good match to the multi-wavelength counts obtained by assuming a
typical starburst spectrum for the evolving population already indicates
that the faint IR-selected source population is likely dominated by
processes of star-formation in distant galaxies more than by AGN emissions.
This seems indeed the result of the first spectroscopic studies of faint
ISO sources
(Sect. 12.1), although a more substantial
effort is required to confirm it.
Considering the different shapes of the IR SEDs for SBs and AGNs, this
would imply that the population detected by ISO in the mid-IR not only
contributes a major
fraction of CIRB at 15µ, but is also responsible for a
majority contribution of the CIRB at any wavelengths.
12. NATURE OF THE FAST EVOLVING SOURCE POPULATION
12.1. Tests of the evolving IR population in the HDFs
and CFRS fields
The ISO observatory has deeply surveyed with CAM LW3 some of the
best investigated sky areas, in particular the two Hubble Deep Fields
(North & South,
Rowan-Robinson et al. 1997,
Oliver et al. 2000b)
and the area CFRS 1415+52
(Flores et al. 1999).
Given the variety of multi-wavelength data
and the almost complete spectroscopic follow-up, the surveys in these
areas have allowed to achieve important tests of
the evolving population responsible for the upturn of the ISO mid-IR
counts and for a substantial fraction of the CIRB.
Aussel et al. (1999
and 2000)
report reliably tested (see Sect. 9.3)
complete samples of 49 and 63 sources to
S15 100µJy in the HDF North and South
respectively, covering similar areas of 25 sq. arcmin each.
Flores et al. (1999)
analyse a sample of 41 sources brighter than
S15 300µJy (S/N > 4)
over an area of 10' × 10' in CFRS 1415+52.
The vast majority (90%) of the ISO sources in the HDF surveys have
spectroscopic
redshifts, and for the remaining objects photometric redshifts are
easily estimated.
The redshift distributions d (z)
for the HDF and CFR1415 surveys are reported in
Figure 10, and compared with the model
fitting the multi-wavelength counts mentioned in
Sect. 11.2.
Although the two surveys cover individually small sky areas, the fair
match between
them gives some confidence about the overall reliability of the result.
These data set a stringent limit on the rate of cosmological evolution for
IR galaxies above z 1, which needs to level off to avoid exceeding
the observed d (z) on the high-z tail. Note however
that the observed high-z convergence of d (z)
is also partly an effect of the strong K-correction in the LW3 flux for
dust-rich galaxies
(see an example in Fig. 9):
disentangling K- from evolutionary-corrections
at z > 1 will require SIRTF and FIRST.
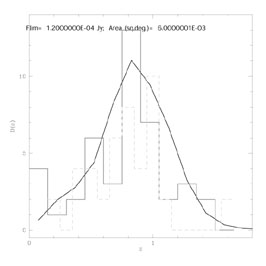
|
Figure 10. Redshift distributions from the
HDFN
(Aussel et al. 2000)
and CFRS 1415+52 ISOCAM LW3 samples, compared with model predictions.
|
HST imaging data on these fields provide detailed morphological
information on ISO sources.
Elbaz et al. (1999)
and Aussel et al. (1999)
find that 30 to 50% of them
show clear evidence of peculiarities and multiple structures, in keeping
with the local evidence that galaxy interactions are the primary trigger
of luminous IR starbursts. From their Caltech redshift survey in the HDF
North,
Cohen et al. (1999)
report that over 90% of the faint LW3 ISO sources are members
of galaxy concentrations and groups, which they identify as peaks in
their redshift
distributions. Indeed, it is in these dense galaxy environments with low
velocity dispersion
that interactions produce resonant perturbation effects on galaxy dynamics.
12.1.1. Optical and NIR spectral properties:
nature of the IR sources
Flores et al. (1999)
report a preliminary analysis of the spectra of IR sources
in CFRS 1415+52, noting that a majority fraction of these display both
weak emission (OII 3787) and absorption (H ) lines, as typical of the
e(a) galaxy spectral
class: the latter is mentioned in the literature as a post-starbursting
population,
one in which a vast population of A-type absorption-line stars from a 1 Gyr old
massive starburst combine with a small residual of ongoing SF
evidenciated by the weak OII emission.
Given the far-IR selection of the faint ISO sources, which is expected
to preferentially
detect dusty star-forming galaxies, this result would be difficult to
understand,
as it lets open the question of "why the ongoing active starbursts are
not detected".
) lines, as typical of the
e(a) galaxy spectral
class: the latter is mentioned in the literature as a post-starbursting
population,
one in which a vast population of A-type absorption-line stars from a 1 Gyr old
massive starburst combine with a small residual of ongoing SF
evidenciated by the weak OII emission.
Given the far-IR selection of the faint ISO sources, which is expected
to preferentially
detect dusty star-forming galaxies, this result would be difficult to
understand,
as it lets open the question of "why the ongoing active starbursts are
not detected".
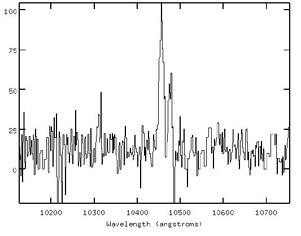
|
Figure 11. ISAAC/VLT spectrum of HDFS
source # 53 at z = 0.58. The H and NII redshifted lines are clearly visible [from
Rigopoulou et al. 2000].
|
Rigopoulou et
al. (2000) and
Franceschini et al. (2000b)
have observed with ISAAC on VLT
a sample of 13 high-z (0.2 < z < 1.4) galaxies selected in
the HDF South to S15 > 100 µJy:
the H line is detected in virtually all of the sources, and
found quite
prominent (EW > 50 Å), indicating substantial rates of SF
after de-reddening corrections, and demonstrating that these optically
faint but IR luminous
sources are indeed powered by an ongoing massive dusty starburst.
The e(a) spectral appearence is interpreted by
Poggianti & Wu
(2000) and
Poggianti, Bressan,
Franceschini (2000)
as due to selective dust attenuation,
extinguishing more the newly-formed stars than the older ones which have
already disrupted their parent molecular cloud.
These papers independently found that
70 - 80% of the energy emitted by young
stars and re-processed in the far-IR leaves no traces in the optical
spectrum, hence
can only be accounted for with long-wavelength observations.
12.1.2. Evaluating baryonic masses and the SFR of
the IR population
Further efforts of optical-NIR spectroscopic follow-up of faint
IR sources are planned for the next years, including attempts to address
the
source kinematics and dynamics based on line studies with the
next-generation of
IR spectrographs (e.g. SINFONI on VLT). The latter would be particularly
relevant in
consideration of the typically complex dynamical structure of luminous
IR starbursts.
At the moment, for an evaluation of the main properties of the IR population
we have to rely on indirect estimates exploiting the near-IR and far-IR
fluxes.
One important parameter is the baryonic mass in stars, for measure of which
fits of local template SEDs to the near-IR broad-band spectrum can be used.
Our estimated values of the baryonic mass ( 1011 M, with 1 dex typical
spread, see Figure 12) indicate that already
evolved and massive galaxies host the powerful starbursts.
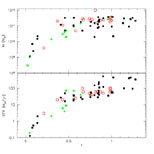
|
Figure 12. Star formation rates and
baryonic masses as a function of redshift
for galaxies selected by ISOCAM LW3 at 15µm in the
HDFN and CFRS 1415+52.
|
As a measure of the rate of star-formation (SFR), the other fundamental
parameter describing the physical and
evolutionary status of the sources, we have exploited the mid-IR flux as
an alternative to
the (heavily extinguished) optical emissions, since it is much more
directly
related to the bolometric (mostly far-IR) flux, which is the most robust
indicator of the number of massive reddened newly-formed stars.
Vigroux et al. (1998)
find that the
ISOCAM mid-IR fluxes (from both LW3 and LW2 ISOCAM observations)
are tightly and linearly related with the bolometric
emission in local galaxies, evidence contradicted only in very
extinguished peculiar
sources (e.g. Arp 220), for which the mid-IR spectrum is self-absorbed.
Using several HDF North sources having both the mid-IR and radio flux,
Aussel et al. (2000)
find that the two SFR estimators, both largely unaffected by
dust extinction, provide consistent results on the SFR.
However, the mid-IR flux has the advantage over the radio to be less
affected by AGN emission, providing a more reliable SF measurer
(Cohen et al. 1999;
Aussel et al. 2000;
Franceschini et al. 2000b).
Also the fact that only 7 of the 49 IR SBs in the HDFN
are detected in radio to a flux limit of few tens of
µJy tells that the mid-IR flux
is a more sensitive indicator of SF.
This untill dedicated space missions (in particular the 3.6m FIRST
observatory) will measure the peak of dust emission at
100 µm in high-redshift
galaxies with high accuracy.
Altogether, the galaxy population dominating the faint mid-IR counts and
substantially
contributing to the bolometric CIRB intensity (assumed typical SB SEDs)
appears to be composed of luminous (Lbol 1011 - 1012 L)
starbursts in massive (M 1011 M) galaxies at
z 0.5 - 1,
observed during a phase of active stellar formation.
The typically red colors of these systems suggest that they are mostly
unrelated to
the faint blue galaxy population dominating the optical counts
(Ellis 1997),
and should be considered as an independent manifestation of (optically
hidden) star formation
(Elbaz 1999;
Aussel 1998).
12.2. What are the FIRBACK 175 µm
sources?
The nature of the 175 µm sources discovered by
FIRBACK/ISO, and contributing
10% of the CIRB intensity, is presently the target of
intense observational and
modellistic investigations, although no conclusions are possible at the
moment.
Because of the missing knowledge of the LLF, the interpretation of the
175µm counts themselves is subject to some
uncertainties: is there strong or marginal evidence for evolution at the
survey limit of 100 mJy (Fig. 6)?
Dole et al. (2000)
argue in favour of the former,
while Fig. 6 reports a solution in
which a moderate-redshift (z 0.5)
population still dominates there.
The basic limitation comes from the difficulty to identify the optical
counterparts, due to the large (40 arcsec) ISOPHOT error-box.
Progress is being achieved by cross-correlating with deep radio
surveys available in the FIRBACK fields (exploiting the good radio/FIR
correlation, eq. 6.14) and by means of some limited SCUBA follow-up.
Scott et al. (2000)
have obtained data at 450 and 850 µm for 10
FIRBACK sources: the FIR-mm SEDs tentatively indicate, for plausible
far-IR spectra,
redshifts in the range from 0 to 0.4 for the majority of the sources, while
a few may be at z > 1.
Mid-IR 15 µm fluxes from an ISOCAM map are available
in the "FIRBACK Marano"
area, which indicate that the 15µm counterparts of
the 175µm sources are rather faint
(Elbaz, 1999).
Three interpretations have been suggested: (a) FIRBACK sources are
typically very high-luminosity Arp220-like at low redshift (z 0.1-0.4);
(b) they are more standard starbursts at z > 1;
(c) they are low-activity spirals at moderate z with significant
amounts of cold-dust and excess emission at
> 100µm.
Although the results of the SCUBA observations might indicate that the
last interpretation
could be more probable, the nature of the FIRBACK source population is
far from proven,
further multi-wavelength data being required to address it.
Deeper far-IR observations will be possible with SIRTF, but a more final
solution will probably require the FIRST's better spatial resolution.
12.3. The nature of the high-z galaxies detected in
the millimeter
Thanks to the unique advantage for deep sub-mm observations offered by
the very
peculiar K -correction, sub-mm surveys with sensitivities of few
mJy at 850µm,
have been able to detect high-redshift (very luminous) sources in
flux-limited samples.
The observed 850 µm counts, far in excess of the
no-evolution prediction,
already tell incontrovertibly about the cosmological distance and
evolutionary status of the SCUBA-selected source population.
Unfortunately, probing directly the nature of these objects via optical
identification and spectroscopic follow-up turned out to be very difficult,
in spite of the substantial efforts dedicated. The SCUBA
diffraction-limited HPBW at 850 µm is large, 15 arcsec FWHM, and the
difficulty of the identification is further exacerbated by the usual extreme
faintness of the optical counterparts, as demonstrated in the (few)
cases in which the identification has been possible (see e.g.
Figure 13).
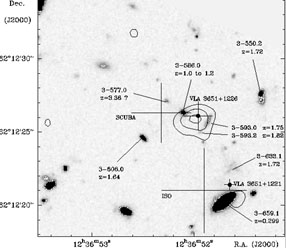
|
Figure 13. Map of the 1.3 mm continuum
obtained with the IRAM interferometer in the field of the source HDF
850.1 by
Downes et al. (1999).
HDF 850.1 is the brightest source discovered
at 850 µm by SCUBA
(Hughes et al. 1998),
and has a flux density of 2.2 mJy at 1.3 mm.
The field center coincides with the
center position of the SCUBA error-box, whose size is however
comparable to the whole image area. The colour image is a
composite of BVI data from HDF. Positions of VLA and ISO sources,
as well as photometric redshift data, are also indicated. IRAM and VLA
position clearly
point to a faint optical counterpart of HDF 850.1 (3-593.0), possibly
influenced by gravitational
lensing by the elliptical 3-586.0, in a similar configuration to the
prototypical primeval galaxy IRAS F10214 [courtesy of D. Downes].
|
The reliability of the identification has been evaluated
by computing the probability that the nearest member of a population of
candidate identifications with surface density n falls by chance
within a distance d from the SCUBA source:
P = e-  nd2.
For a sample of size N of SCUBA detections, the product NP
gives the number of spurious identifications
(Lilly et al. 1999).
This analysis has shown that the situation is not quite comfortable for
the SCUBA surveys, essentially because of the
faintness of the optical counterparts: roughly 50% of all
identifications may be spurious.
nd2.
For a sample of size N of SCUBA detections, the product NP
gives the number of spurious identifications
(Lilly et al. 1999).
This analysis has shown that the situation is not quite comfortable for
the SCUBA surveys, essentially because of the
faintness of the optical counterparts: roughly 50% of all
identifications may be spurious.
Two approaches have been followed to improve the identification and try
to characterize the population.
One was to systematically survey spectroscopically all optical sources
falling in the SCUBA beam, the other was to exploit
cross-identifications with ultra-deep radio catalogues.
Particularly well studied are the fields in the Cluster Lens Survey
(Smail et al. 1997),
exploiting the flux-amplification by massive foreground galaxy
clusters. The current situation about redshift measurements in this
survey is: the
16 SCUBA sources have 24 possible counterparts with spectroscopic redshifts,
6 reliable z estimates (a z = 2.8 combined AGN/starburst,
a z = 2.6 galaxy pair,
2 galaxies with AGN signatures at z = 1.16 and z = 1.06,
and finally 2 foreground cD cluster members
[Barger et al. 1999]).
Note that the identification with the
galaxy pair has been later confirmed by CO mm observations
(Frayer et al. 1999).
An interesting case is illustrated in Fig. 13,
showing the brightest object HDF-850.1 in the
Hughes et al. (1998)
survey, confirmed by IRAM interferometry as a probable
ultra-luminous lensed starburst with
Lbol 2 1012L at
zphotom 1.7
The difficulty of the identification process is illustrated by the
recent finding
(Smail et al. 1999)
of the presence of two Extremely Red Objects (ERO's) as probable
counterparts of two SCUBA sources.
Given the faintness of optical counterparts and the extreme difficulty
to get the redshift from optical spectroscopy, some millimetric
estimators of the redshift have been devised to override optical
measurements.
Hughes et al. (1998)
use the S450 / S850 flux ratio as a
measure of z.
However, given the rather wide temperature-distribution of cosmic dust
(see e.g. the
three quite different spectral templates, for Arp 220, M82, and M51 in
Fig. 9), this test proved to be very
uncertain. Much more reliable the technique proposed by
Carilli & Youn (1999)
to exploit the S850/S20cm flux ratio,
which has the advantage to rely on very robust
mm spectral shapes at 850 µ (S , see Sect. 3)
and in the radio (typical power-law synchrotron spectra), with opposing
spectral slopes. Assuming an Arp 220 spectral template they got:
whose small scatter mostly reflects the tight FIR to radio correlation.
Population constraints on the z-distributions have been derived
in this way,
and the basic result (still tentative and requiring confirmation) is that
faint SCUBA sources are mostly ultra-luminous galaxies at typical
z 1 to 3 (e.g.
Barger et al. 1999).
Clearly, the details of the z-distribution cannot yet be quantified with
precision,
this will likely require new instrumentation (mm interferometers -
e.g. ALMA - are particulalry needed, in addition to space FIR
observatories).
As suggested by many authors, the similarity in properties between this
high-z population and local ultra-luminous IR galaxies argues in favour
of the idea that these represent the long-sought "primeval galaxies",
those in particular originating the local massive elliptical and S0
galaxies. This is also supported by estimates of the volume density of these
objects in the field
2 - 4 × 10⁻⁴ Mpc-3,
high enough to allow most of the field E/S0 to be formed in this way
(Lilly et al. 1999).
As for the E/S0 galaxies in clusters, a very interesting result was the
recent discovery by SCUBA of a significant excess of very luminous
(L 1013L) sources at
850 µm
close to the z = 3.8 radiogalaxy 4C41.17
(Ivison et al. 2000),
which parallels
the evidence of a similar excess of EROs and Lyman-break galaxies in
this area. It is tentalizing to interprete these data as indicative of
the presence of a
forming cluster surrounding the radiogalaxy, where the SCUBA sources
would represent the very luminous ongoing starbursts.
By continuity, the less extreme starbursts (L 1011 - 1012 L)
discovered by ISOCAM at lower redshifts can possibly originate the
spheroidal
components in later morphological type galaxies (see more in
Sect. 13.2.4 below).
12.4. AGN contribution to the energetics of the faint
IR sources
Within this interpretative scheme, a margin of uncertainty still exists
about the possible contribution
by gravitational accretion from a nuclear quasar to the energy budget in
these high-z IR-mm sources.
While stellar energy production provides a modest overall efficiency for
baryon transformations of quite less
than a percent at most, the theory of gravitational accretion predicts
values in the range
5 - 40%. A natural question then arises as of how much
of the bolometric flux in these sources is contributed by an AGN.
Unfortunately, the optical-UV-soft-X ray primary source spectrum
in the high-redshift IR-mm sources is almost completely re-processed by
dust into an IR spectrum largely insensitive to the properties of the
primary incident one.
As for SCUBA sources, there have been indications for AGN activity for
at least a fraction (20-30%) of them. Indeed, since SCUBA selects the top
luminosity end of the IR population, and considering
the local evidence of a larger incidence of AGNs among ULIRGs, an
important AGN contribution to the SCUBA sources would be expected
(potentially biasing our conclusions
about their contribution to the SFR history).
Risaliti et al. (2000)
and Bassani et al. (2000)
claim evidence for a significant AGN contribution in the large majority
(> 60%) of the local
ULIRGs based on hard X-ray data, something confirmed also by high
spatial resolution IR imaging by
Soifer et al. (2000).
Since its launch the last year, the CHANDRA X-ray observatory (the
ultimate imager in hard X-rays) has allowed to probe very deeply into
the nature of the high-z SCUBA
sources, using the hard X-ray flux as diagnostic tool (SB are weaker
X-ray emitters than any kind of AGNs).
Among several tens of hard X-ray and 850 µm sources
detected in various independent survey areas,
(Fabian et al. 2000,
Hornschemeier et al. 2000,
Barger et al. 2000),
only very few are in common, the two samples
being essentially orthogonal. Unless all these are Compton-thick and any
hard X-ray scattered photons are also photoelectrically absorbed,
the conclusion is that the bulk of the emission by high-luminosity SCUBA
sources is due to star formation (in agreement with a dominant stellar
emission in local ULIRGs found by
Genzel et al. 1998).
While the detailed interplay between starburst and AGN
is still an open issue even for local sources, the estimated fraction of
the CIRB at 850 µm due to AGNs is not larger than 10%
(Barger et al. 2000).
Preliminary results of spectroscopic studies of the H line properties
in faint ISO mid-IR sources
(D. Rigopoulou, private communication) seem also to indicate a modest
incidence of AGN,
which would imply that the overall AGN contribution to the bolometric
CIRB is likely around 10% or so.
12.5. Discussion
ISO and SCUBA surveys have proven nicely complementary capabilities to
explore, within the limitations of the current instrumentation,
long-wavelength emission
by galaxies over most of the Hubble time, up to z of several.
Unfortunately, this has been possible only at the short- and
long-wavelength tails of the CIRB background spectrum:
a bad coincidence makes the wavelength interval including peak emission
by distant dusty galaxies ( 30 to 300 µm) hardly accessible at
present.
All mentioned exploratory surveys of the distant universe have indicated
that the overall volume
emissivity of galaxies at long wavelengths drastically increases as a
function of
redshift, to explain the very steep observed multi-wavelength counts and the
redshift distributions showing substantial high-z tails.
This evolution, however, should level off by z 1 (see Fig. 14 below)
to allow consistency with the observed z-distributions
(Franceschini et al. 2000)
and the CIRB spectral shape.
A spectacular finding by the deep SCUBA surveys was the discovery of
ultra-luminous
galaxies at high-redshifts, mostly emitting in the far-IR and possibly
at the origin of present-day galaxy spheroids.
However, the most precise quantification of the cosmic history of the IR
population comes at the moment from the ISO
deep and ultra-deep surveys, which provide very detailed constraints on
the counts
(Fig. 5) and also allow to
unambiguously identify in the optical the
faint IR sources (Fig. 4).
The outcome of our spectroscopic observations is that the faint population
making up the CIRB in the mid-IR is dominated by actively star-forming
galaxies with substantial H emission (Sect. 12.1.1). Preliminary inspection of H line profiles and constraints set by the 15 to 7
micron flux ratio
indicate that the majority of sources are powered by a SB rather than an
AGN.
Mid-IR ISO counts and the redshift distributions of the sources require
extremely high rates of evolution of the 15µm luminosity
function up to z 1.
Taking into account all effects due to the detector spectral response
function
to the complex mid-IR spectral features, the observable statistics may
be explained
in terms of a strong evolution for a population of IR starbursts
contributing little to the local LF. Consequently, a plausible evolution
pattern should involve both the source luminosities and spatial densities.
A natural way to account for this very high dependence on redshift
of the IR starburst population is to assume that it consists of
otherwise normal galaxies, but observed during a dust-extinguished
luminous starburst phase, and that its extreme evolution is due to
an increased probability with z to observe a galaxy during a
starburst event.
The common wisdom that SBs are triggered by interactions and merging
suggest that the inferred strong number density evolution
may be interpreted as an increased probability of interaction
with z. Assuming that the phenomenon is dominated by interactions in the
field and a
velocity field constant with z, than this probability would scale
roughly as
n(z)2 (1 + z)6, n being the number
density in the proper (physical)
volume. A more complex situation is likely to occur, as the velocity
field evolves with z
in realistic cosmological scenarios and if we consider that the most
favourable environment for interactions are galaxy groups, which indeed are
observed to include the majority of ISOCAM distant sources
(Cohen et al. 1999).
The increased luminosity with z of the typical starburst is due,
qualitatively, to the larger amount of gas available in the past to make
stars.
To note is that closed or zero- world models require evolution
rates quite in excess of those inferred from deep optical imaging
(Le Fevre et al. 2000),
whereas our best-fit solution for
= 0.8 and
= 0.2
(eq. 11.28]) is closer to the optical results.
How this picture of a 2-phase evolution of faint IR sources compares
with results of optical and near-IR deep galaxy surveys is matter of debate.
Since, because of dust, most of the bolometric emission during a
starburst comes out in the far-IR, we would not expect the optical
surveys to see much of this violent IR
starbursting phase. Indeed, B-band counts of galaxies and spectroscopic
surveys are interpreted in
terms of number-density evolution, consequence of merging, and
essentially no evolution in luminosity.
The Faint Blue Object population found in optical surveys may be
interpreted as the "post-starburst" population, objects either observed
mostly after the major event of SF,
or more likely ones in which the moderately extinguished intermediate age (
107 yrs)
stars in a prolonged starburst (several 107 yrs)
dominate the optical spectrum.
In this sense optical and far-IR selections trace different phases of
the evolution of
galaxies, and provide independent sampling of the cosmic star formation.
A lively debate is currently taking place about the capabilities of
UV-optical observations to map accurately by themselves the past and present
star-formation, based on suitable corrections for dust extinction in distant
galaxies.
Adelberger et al. (2000)
suggest that the observed 850 µm galaxy counts and the
background could possibly be explained with the optical Lyman drop-out
high-z population by applying a proportionality correction to the
optical flux and by taking into
account the locally observed distribution of mm-to-optical flux ratios.
On the other hand, a variety of facts indicate that optically-selected and
IR/mm-selected faint high-redshift sources form almost completely
disjoint samples.
Chapman et al. (2000)
observed with SCUBA a subset of z = 3 Lyman-break galaxies having the
highest estimeted rates of SF as inferred from the optical spectrum, but
detected only one
object out of ten. For this single detected source the predicted SFR
based on the
extinction-corrected optical spectrum was 5 times lower than found by SCUBA.
A similar behaviour is also shared by local luminous IR galaxies, whose
bolometric flux is unrelated to the optical spectrum
(Sanders & Mirabel
1996).
Finally, our previously mentioned observational results by
Rigopoulou et al. (2000)
and the theoretical ones by
Poggianti & Wu (2000)
and Poggianti et
al. (2001)
report independent evidence from both local and high-z luminous
starbursts that typically 70% to 80% of the bolometric flux from young stars
leaves no traces in the UV-optical spectrum, because it is completely
obscured by dust. As there seems to be no "a priory" way to correct
for this missing energy,
we conclude that only long-wavelength observations, with the appropriate
instrumentation, can eventually measure SF in galaxies at any
redshifts.
13. GLOBAL PROPERTIES: THE SFR DENSITY AND CONTRIBUTIONS TO THE
CIRB
13.1. Evolution of the comoving luminosity density and
SFR
As illustrated in Fig. 3, the CIRB
intensity and spectral distribution
are in clear support of models for evolving starbursts discussed above.
Unfortunately, we are not yet in the position to derive an independent
assessment of the evolutionary SFR density based on the available
complete samples of faint IR sources:
although a substantial effort to follow them up in the optical
has started (particularly good chances are offered by ongoing
spectroscopic follow-up
of the statistically rich faint ISOCAM samples like the GITES and HDFs),
the process is far from complete.
As a consequence, no detailed conclusions can yet be drawn about
the contribution of IR sources to the global comoving luminosity and SFR
densities
(Madau et al. 1996).
Only rather model-dependent estimates are possible at the moment, based
for example on the evolution scheme described in
Sect. 11 and whose predictions
are summarized in Figure 14.
There is a clear indication here that the contribution of
IR-selected sources to the luminosity density at high-z
should significantly exceed those based on optically selected sources,
and that the excess may be progressive with redshift up to z 1.
This evolution should however level off at higher z, to allow
consistency with the observed z-distributions for faint ISOCAM sources
(Franceschini et al. 2000)
and with the estimates of the average time-dependent emissivity
jeff(z)
(eq. [8.21]) based on deconvolution of the CIRB spectrum
(Gispert et al. 2000).
Altogether these results indicate that the history of galaxy
long-wavelength emission
does probably follow a path similar to that revealed by optical-UV
observations, by showing a similar peak activity around z 1, rather than being
confined to the very high-z, as sometimes was suggested.
This confirms that the bulk of the galaxy activity, and particularly the
bulk of the energy released in the CIRB background, is to
be placed around z = 1, which is obvious from
Fig. 14 if the dependence of the
cosmological timescale on redshift is considered
(Harwit 1999;
Haarsma & Partridge
1998).
These results can only be preliminary untill we will have more
substantial identifications of existing IR-selected source samples, or,
better,
after the fleet of IR/mm facilities planned for this and the next
decade will have eventually provided data of enough quality to allow a
full long-wavelength complement to the optical-UV high-z observations.
13.2. Energy constraints from background
observations
In the present situation, the most robust constraints on the high-redshift
far-IR/sub-mm population come from observations of the global energetics
residing in the CIRB and optical background radiations.
The latter imply a very substantal demand on contributing sources,
as detailed below in schematic terms.
Let us assume that a fraction f * of the
universal mass density in baryons

| (13.29)
|
undergoes a transformation (either processed in stars or by
gravitational fields) with radiative efficiency , then the locally observed energy density
of the remnant photons is

| (13.30)
|
For stellar processes, is
essentially determined, within the moderate uncertainties of stellar models,
by the IMF:
= 0.001 for a Salpeter IMF and a low-mass cutoff
Mmin = 0.1 M (see eq. 4.13),
= 0.002 and
= 0.003
for Mmin = 2 and Mmin = 3, while gets the usually quoted value of
= 0.007 only for
Mmin > 10 M [A. Bressan, private communication].
Note how the contribution to the photon background energy by very high
redshifts is penalized in eq. (13.30) by the
(1 + z)-1 factor: measurements
of the photon background preferentially constrain source emission at
moderate z,
whereas estimates of the local average metal abundance (obviously much
more difficult
and indirect!) would in principle provide a less biased integral over
the total stellar yield in the past.
13.2.1. Constraints from the integrated optical
background
As already noticed (Sect. 8.3.1), the
converging galaxy counts at faint magnitudes observed in the optical
and near-IR allow to estimate with fair accuracy the total diffuse flux
at these wavelengths (Fig. 3, see
Madau & Pozzetti 2000).
The bolometric emission from 0.1 to 7 m by distant galaxies turns out to be

| (13.31)
|
which in fact is a lower limit if we give credit to claims of a (×
2 - 3) larger
optical/NIR background, see Sect. 8.1 (but
see also a counter-argument in Sect. 8.2).
We discussed evidence that for the most luminous starbursts the optical
spectra are only moderately contributed by starburst emission, which is
mostly hidden in the far-IR. Accordingly, let us assume
that the optical/NIR BKG mostly originates by quiescent SF in spiral
disks and by intermediate and low-mass stars. As observed in the Solar
Neighborhood, a good
approximation to the IMF in such relatively quiescent environments is the
Salpeter law with standard low-mass cutoff, corresponding to a mass-energy
conversion efficiency
0.001. With these parameter values, we
can reproduce the whole optical BKG intensity of eq. (13.31) by
transforming a fraction
f * 10% of all nucleosynthetic baryons into
low-mass stars, assumed the bulk of this process happened at
z * 1.5
and 5% of the closure value in baryons (for our adopted
H0 = 50 Km/s/Mpc, or
 h2 = 0.012, consistent with
the theory of primordial nucleosynthesis):
h2 = 0.012, consistent with
the theory of primordial nucleosynthesis):
It is generated in this way a local density in low-mass stars consistent
with the observations (based on photometric surveys,
Ellis et al. 1996,
and assuming standard mass to light ratios):

| (13.32)
|
which, assuming typical solar metallicities, corresponds to a local
density in metals of
| (13.33)
|
Note that a factor 2-3 larger optical/NIR background than in eq. (13.31)
could still be consistent with the present scheme if a similar scaling
factor would also apply to
eqs. (13.32) and (13.33): that is, if both the excess background and
low-mass stars
and stellar metals would be due to extended low-brightness halos,
unaccounted for by deep HST imaging as well as by local photometric surveys.
13.2.2. Explaining the CIRB
background
The total energy density between 7 and 1000 m contained in the CIRB,
including modellistic extrapolations as in
Fig. 3 consistent with the constraints set
by the cosmic opacity observations, amounts to
| (13.34)
|
Following our previous assumption that luminous starbursting galaxies
emit negligible energy in the optical-UV and most of it in the far-IR,
we coherently assume that the energy resident in the CIRB background
originates from star-forming galaxies at median
z * 1.5. The amount of baryons
processed in this phase and the conversion efficiency
have to account for the combined constraint set by eqs. (13.32) and
(13.34), that is to provide a huge amount of energy with essentially
no much stellar remnant in the local populations. The only plausible
solution
is then to change the assumptions about the stellar IMF characterizing
the starburst phase, for example to a Salpeter distribution cutoff below
Mmin = 2 M, with a correspondingly higher
efficiency = 0.002
(see discussion in Sect. 13.2). This may explain the
energy density in the CIRB:
assumed that a similar amount of baryons,
f * 10%, as processed with low
efficiency during the "inactive" secular evolution, are processed with
higher efficiency during the starbursting phases, producing a two times
larger amount of metals:
(metals) 1.4 107 M/Mpc3.
Note that by decreasing Mmin during the SB phase would
decrease the efficiency
and increase
the amount of processed baryons f * , hence
would bring to exceed the locally
observed mass in stellar remnants (eq. [13.32]).
The above scheme is made intentionally extreme, to illustrate the
point. The reality
is obviously more complex than this, e.g. by including a flattening at
low mass values in the Salpeter law (see
Zoccali et al 2000)
for the solar-neighborhood SF and, likewise, a more
gentle convergence of the starburst IMF than a simple low-mass cutoff.
13.2.3. Galactic winds and metal pollution of the
inter-cluster medium
A direct prediction of our scheme above is that most of the metals produced
during the starburst phase have to be removed by the galaxies to avoid
largely exceeding the locally observed metals in galaxies. As discussed
in Sect. 6.4,
there is clear evidence in local starbursts, based on optical and
X-ray observations, for large-scale super-winds out-gassing high-temperature
enriched plasmas from the galaxy. Our expectation would be that a
substantial amount of metals, those originating from the same SF
processes producing the CIRB
background, are hidden in the hot inter-cluster medium.
But where all these metals are?
While densities and temperatures of the polluted plasmas in the diffuse
(mostly primordial and un-processed) inter-cluster medium are such to
hide easily these products of the
ancient SB phase, an interesting support to the above scheme comes from
consideration
of the metal-enriched intra-cluster plasma (ICP) in clusters of galaxies.
Rich clusters are considered to constitute a representative sample of
the universe,
while at the same time - given their deep gravitational potential - they
are to be
considered from a chemical point of view as closed boxes (all metals
produced by cluster galaxies are kept inside the cluster itself).
The mass of metals in the ICP plasma is easily evaluated from the total
amount of ICP baryons (measured to be 5 times larger than the mass in galactic stars)
and from their average metallicity, 40% solar. The mass of ICP metals
is Mmetals, ICP 5 × 0.4 (Z/Z) Mstars, which is
two times larger than the mass of the metals present in galactic stars
and consistent with the mass in metals produced during the SB phase.
Then the same starbursts producing the ICP metals are also likely
responsible for the origin of the CIRB. As mentioned, the starburst
enrichment process could have
been pictured in a deep SCUBA image of the candidate proto-cluster
surrounding the z = 3.8 radio-galaxy 4C41.17. In a similar fashion,
Mushotzky & Loewenstein
(1997)
used their metallicity measurements
in clusters to estimate the contribution of spheroidal galaxies to the SFR
density (see Fig. 14).
13.2.4. A two-phase star-formation: origin of
galactic disks and spheroids
The above scheme, best-fitting the available IR data as discussed in
Sect. 11,
implies that star formation in galaxies has proceeded in two phases:
a quiescent one taking place during most of the Hubble time, slowly
building stars with standard IMF
from the regular flow of gas in rotational supported disks; and a
transient actively starbursting phase, recurrently triggered by galaxy
mergers and interactions. During the merger,
violent relaxation redistributes old stars, producing de
Vaucouleur profiles typical
of galaxy spheroids, while young stars are generated following a
top-heavy IMF.
Because of the geometric (thin disk) configuration of the diffuse ISM
and the modest
incidence of dusty molecular clouds, the quiescent phase is only moderately
affected by dust extinction, and naturally originates most of the
optical/NIR background
(included early-type galaxies completely deprived of an ISM).
The merger-triggered active starburst phase is instead characterized by
a large-scale redistribution
of the dusty ISM, with bar-modes and shocks, compressing a large fraction of
the gas into the inner galactic regions and triggering formation of
molecular clouds.
As a consequence, this phase is expected to be heavily extinguished
and the bulk of the emission to happen at long wavelengths, naturally
originating the cosmic CIRB background.
Based on dynamical considerations, we expect that during this violent SB
phase
the elliptical and S0 galaxies are formed in the most luminous IR SBs at
higher-z (corresponding to the SCUBA source population), while galactic
bulges in later-type galaxies
likely originate in lower IR luminosity, lower-z SBs (the ISO mid-IR
population).
The presently available IR data cannot assess if the different
luminosity ranks of SCUBA and ISO selected sources are characterized also by
different formation timescales (SF activities
being confined to the higher-z for the former and to lower-z for the
latter), since the present samples are far dominated by K-correction and
selection effects. Assumed however
this is indeed the case, this could still be reconciled with the
expectations of hierarchical clustering models if we consider that SCUBA
sources likely trace the
very high-density (galaxy clusters) environment with an accelerated
merging rate at high-z, while ISO sources are likely related with
lower-density environments (galaxy groups or the field) entering the
non-linear collapse phase at later cosmic epochs (e.g.
Franceschini et al. 1999).
Finally, if indeed the IMF characteristic of the SB phase is deprived
of low-mass stars, as suggested in
the previous paragraphs, a consequence would be that the excess blue stars
formed during the SB would quickly disappear, leaving the colors of the
emerging
remnant as typically observed for early-type galaxies and keeping
consistent with
the evidence that the stellar mass content in galaxies does not change
much for z < 1.
13.3. Contribution by gravitational accretion to the
global energetics
The remarkable similarities between the cosmic evolution of galaxy
and AGN emissivities have been taken as evidence that the same processes
triggering
SF also make a fraction of the gas to accrete and fuel the AGN (Hasinger
Franceschini et al. 1999).
Furthermore, detailed studies of local high-luminosity IR galaxies are
showing that
SF and AGN activities happen very often concomitantly in the same object
(Genzel et al. 1998;
Risaliti et al. 2000;
Bassani et al. 2000).
After all, this is a
natural outcome of the scheme discussed in previous Sections,
the violent radial inflow of gas following the merger/interaction should
likely fuel not only nuclear star-clusters, but the BH itself at some stage.
Waiting for forthcoming and future powerful instrumentation (X-ray
observatories
CHANDRA and XMM, Constellation-X and XEUS in the future, and
large space IR observatories like NGST and FIRST) to have a detailed
quantification of the relative merits of the two fundamental baryon
drivers, some order-of-magnitude estimates may be useful as a guideline.
From a combined analysis of the AGN and starburst average
bolometric emissivities as a function of redshift,
Franceschini et al. (1999)
infer a relationship between the mass MBH
of the local remnant super-massive BH after the AGN phase to the mass
M *
in galactic stars from the SB phase:
| (13.35)
|
where  is the radiative efficiency by BH accretion and
n[type II] / n[type I]
is the ratio of the absorbed to unabsorbed AGNs (which should be close to
3-5 to explain the local AGN statistics and the observed intensity of
the XRB).
On the other hand, observations of supermassive BH's in local spheroidal
galaxies
(Magorrian et al. 1998,
Faber et al. 1997)
indicate a quite higher mass in the BH accreted material
with respect to that in stars: MBH (0.002 - 0.006) M * .
Assumed that should not be lower than
0.1, this may require a stellar mass-energy conversion efficiency
>> 0.001,
which is further independent support to the idea of a top-heavy IMF
during the SB phase.
is the radiative efficiency by BH accretion and
n[type II] / n[type I]
is the ratio of the absorbed to unabsorbed AGNs (which should be close to
3-5 to explain the local AGN statistics and the observed intensity of
the XRB).
On the other hand, observations of supermassive BH's in local spheroidal
galaxies
(Magorrian et al. 1998,
Faber et al. 1997)
indicate a quite higher mass in the BH accreted material
with respect to that in stars: MBH (0.002 - 0.006) M * .
Assumed that should not be lower than
0.1, this may require a stellar mass-energy conversion efficiency
>> 0.001,
which is further independent support to the idea of a top-heavy IMF
during the SB phase.
14. CONCLUSIONS
During the last few years a variety of observational campaigns, in
particular
by ISO from space in the far-IR and by large mm telescopes from ground,
have started to provide a complementary view of the distant universe at long
wavelengths with respect to that offered by standard optical-UV-NIR deep
explorations.
Also of crucial importance in this context was the discovery of an
intense diffuse background radiation in the far-IR/sub-mm of extragalactic
origin, the CIRB. These results are challenging those obtained
from optical-UV observations only, by revealing luminous to very
luminous phases
in galaxy evolution at substantial redshifts, likely corresponding to
violent
events of star-formation in massive systems. In the most extreme of
these sources,
however, a quasar contribution cannot be excluded, and sometimes has
indeed been proven.
Whereas the process of optical identification and spectroscopic
characterization
of the long-wavelength selected high-redshift sources is only at the
beginning
(and will keep being a challenging task for the next several years
because of the
faintness of the optical counterparts), some interesting constraints on the
cosmic evolution can already been inferred from observations of the CIRB
spectral intensity and the multi-wavelength source counts.
The most robust conclusions at the moment appear to be those of a very rapid
increase of galaxy long-wavelength emissivity with redshift, paralleled
by an increased incidence in high-redshift sources of dust extinction
and thermal dust reprocessing with respect to locally observed sources.
A way to interprete these results is to consider as a crucial cosmogonic
ingredient
the role of galaxy interactions and merging. The strong increases with
redshift
of the probability of interactions (as partly due to a plain
geometrical effect
in the expanding universe) and of the effects of interactions
(due to the
more abundant fuel avaliable in the past), likely explain the observed rapid
evolution.
Altogether, the large energy content of the CIRB is not easily
explained, unless
the powerful infrared starburst phase is characterized by a stellar IMF
somewhat deprived in low-mass stars.
Although the subject is presently subject to some controversies, we
think we have provided
enough evidence, based on pioneering efforts of deep sky surveys in the
IR and mm,
that only such long wavelengths contain the clue to an exhaustive
description
of the star formation phenomenon, now and in the past. It seems clear
that there are no
alternatives, neither in X-rays, optical nor radio, to the IR/mm flux
measurement for a
reliable determinantion of the rate of SF in galaxies, simply because it is
there that a dominant fraction of photons from young very luminous stars
emerges,
and no ways are available to determine "a priory" what precisely this
fraction is.
Fundamental aspects of galaxy formation and evolution (e.g. the origin of
galaxy spheroids, and the onset of quasar activity) can effectively be
observed at long wavelengths.
In this sense the variety of ground-based and space projects in this
field planned for
the present decade promises extremely rewarding benefits for
observational cosmology.
This paper has benefited by a large collaboration, in particular
concerning items discussed in the last chapters, including some yet
unpublished results. I want to mention the people who have particularly
contributed:
H. Aussel, S. Bressan, C. Cesarsky, D. Clements, FX. Desert,
D. Elbaz, D. Fadda, R. Genzel, G.L. Granato, M. Harwit,
S. Oliver, B. Poggianti, J.L. Puget, D. Rigopoulou, M. Rowan-Robinson,
L. Silva. I am also glad to thank L. Danese, G. De Zotti for a
long-standing collaboration in this field, A. Cavaliere and C. Chiosi
for many
fruitful discussions. Finally, I want to warmly thank the organizers of the
Canary Islands Winter School on "High-Redshift Galaxies" for their kind
invitation.
REFERENCES
Adelberger, K. L., Steidel, C. C., 2000, ApJ in press
(astro-ph/0001126).
Altieri, B., Metcalfe, L., Kneib, J.P., et al.,
1999, A&A 343, L65
Andreani, P., Franceschini, A.,
1996, MNRAS 283, 85.
Auriemma, C., Perola, G. C., Ekers, R. D.,
Fanti, R., Lari, C., Jaffe, W. J., Ulrich, M. H.,
1977, A&A 57, 41.
Aussel, H.,
1999, PhD thesis, CEA Saclay, Paris.
Aussel H., Cesarsky C., Elbaz D., Starck, J.L.
1999, A&A 342, 313.
Aussel, H., et al., 2000, in preparation.
Barger, A. J., Cowie, L. L., Sanders, D. B., Fulton, E., Taniguchi, Y.,
Sato, Y., Kawara, K., Okuda, H.,
1998, Nature 394, 248.
Barger, A. J., Cowie, L. L., Smail, I., Ivison, R. J., Blain, A. W.,
Kneib, J.-P,
1999, AJ 117, 2656.
Barger, A., Cowie, L., Mushotzky, R., Richards, E., 2000, ApJ submitted
(astro-ph/0007175).
Barnes, J.E., & Hernquist, L.E.,
1992, ARAA 30, 705.
Barnes, J.E., Hernquist, L.,
1996, ApJ 471, 115.
Bassani, L., Franceschini, A., Malaguti, G., Cappi, M., Della Ceca,
R., 2000, A&A submitted.
Bertin, E., Dennefeld, M., Moshir, M.,
1997, A&A 323, 685.
Bertoldi, F., et al., 2000, A&A in press
(astro-ph/0006094).
Bohren, C.F., Huffman, D.R., 1983,
"Absorption and scattering of light by small
particles", John Wiley, New York.
Boulanger, F., Boisssel, P., Cesarsky, D. Ryter, C.,
1998, A&A 339, 194.
Bruzual, A.G.,
1983, ApJ 273, 105.
Calzetti, D.,
1997, AJ 113, 162.
Cappi, M., et al.,
1999, A&A 350, 777.
Carilli, C.L., Yun, M.S.,
1999, ApJ Letters 513, L13.
Cavaliere, A., & Vittorini, V., 2000, ApJ in press
(astro-ph/0006194).
Chapman, S.C., 2000, MNRAS in press
(astro-ph/9909092).
Chini, R., Krugel, E., Lemke, D., Ward-Thompson, D.,
1995, A&A 295, 317.
Clements, D., Baker, A., 1997, in
"Extragalactic Astronomy in the Infrared",
Edited by G. A. Mamon, Trinh Xuan Thuan, and J. Tran Thanh Van. Paris,
Editions Frontieres, p. 347
Cohen, J., et al., 1999, in press
(astro-ph/9912048).
Condon, J.J.,
1974, ApJ 188, 279.
Condon, J. J.,
1992, ARAA 30, 575.
Coppi, P., Aharonian, F.,
1999, Astropart. Phys. 11, 35-39
de Jong, T., Klein, U., Wielebinski, R., Wunderlich, E.,
1985, A& A Letters 147, L6.
De Zotti, G., Franceschini, A., Toffolatti, L., Mazzei, P.,
Danese, L.,
1996, Astro. Lett. and Communications 35, 289.
Desert F.X., et al.,
1999, A&A 342, 363.
Devriendt, J. E. G., Guiderdoni, B., Sadat, R.,
1999, A&A 350, 381.
Disney, M., Davies, J., Phillipps, S.,
1989, MNRAS 239, 939.
Dole, H., Gispert, R., Lagache, G., et al., 2000, in
ISO Beyond Point Sources,
Studies of Extended Infrared Emission, R. Laureijs, K. Leech and
M. Kessler Eds., ESA-SP 455, 167.
Downes, D., et al.,
1999, A&A 347, 809.
Draine, B. T., & Lee, H. M.
1984, ApJ 285, 89.
Dunne, L., Eales, S. Edmunds, M., Ivison, R., Alexander, P., Clements, D.,
2000, MNRAS 315, 115.
Dwek, E.,
1998, ApJ 501, 643.
Dwek, E., Arendt, R. G.,
1998, ApJ Letters 508, L9.
Eales, S., et al.,
1999, ApJ 515, 518.
Elbaz D., et al.,
1999, A&A Letters 351, L37.
Elbaz D., 1999, Proceedings of Rencontres de Moriond,
"Building Galaxies, from the Primordial Universe to the Present",
F. Hammer, et al. Eds, (Ed. Frontieres,
astro-ph/9911050).
Ellis, R. S.,
1997, ARAA 35, 389.
Ellis, R. S., Colless, M., Broadhurst, T., Heyl, J., Glazebrook, K.,
1996, MNRAS 280, 235.
Faber, S.M., et al.,
1997, AJ 114, 1771.
Fabian, A., et al.,
2000, MNRAS 315, 8.
Fang F., Shupe, D.L., Xu, C., Hacking, P.B.
1998, ApJ 500, 693.
Finkbeiner, D.P., Davies, M., Schlegel, D.J., 2000, ApJ in press
(astro-ph/0004175).
Fixsen D.J., et al.
1998, ApJ 508, 123.
Flores H., Hammer F., Thuan T. et al.
1999, ApJ 517, 148.
Franceschini, A., Danese, L., de Zotti, G., Xu, C.,
1988, MNRAS 233, 175.
Franceschini, A., Mazzei, P., De Zotti, G., Danese, L.,
1994, ApJ 427, 140.
Franceschini, A., La Franca, F., Cristiani, S., Martin-Mirones J.,
1994b, MNRAS 269, 683.
Franceschini, A., Andreani, P., Danese, L.,
1998, MNRAS 296, 709.
Franceschini, A., Hasinger, G., Miyaji, T., Malquori, D.,
1999, MNRAS 310, L5.
Franceschini, A., Aussel, H., Elbaz, D., et al.,
2000, Mem Sait, in press.
Franceschini, A., et al., 2000, in preparation.
Frayer, D.T., et al.,
1999, ApJ Letters 514, 13L.
Genzel, R., & Cesarsky, C.J., 2000, ARAA in press
(astro-ph/0002184).
Genzel, R., et al.,
1998, ApJ 498, 579.
Gibson, B. K., Loewenstein, M., Mushotzky, R. F.,
1997, MNRAS 290, 623.
Gispert, R., Lagache, G., Puget, J. L., 2000, AA in press
(astro-ph/0005554).
Gordon, K.D., Calzetti, D., Witt, A.N.,
1997, ApJ 487, 625.
Gorjian, V., Wright, E. L., Chary, R. R.,
2000, ApJ 536, 550.
Granato, G.L., Danese, L.,
1994, MNRAS 268, 235.
Granato, G.L., Danese, L., Franceschini, A.,
1997, ApJ 486, 147.
Granato, G.L., et al., 2000, MNRAS in press
(astro-ph/0001308).
Gregorich, D. T., Neugebauer, G., Soifer, B. T., Gunn, J. E., Herter, T. L.,
1995, AJ 110, 259.
Guhathacurta, P., Draine, B.T.,
1989, ApJ 346, 230.
Guiderdoni, B., et al.,
1997, Nature 390, 257.
Haarsma, D. B., Partridge, R. B.,
1998, ApJ Letters 503, L5.
Hacking, P., Houck, J. R.,
1987, ApJS 63, 311.
Hacking, P., Houck, J. R., Condon, J. J.,
1987, ApJ Letters 316, L15.
Harwit, M.,
1999, ApJ Letters 510, L83.
Harwit, M., Pacini, F.,
1975, ApJ Letters 200, L127.
Harwit, M., Protheroe, R. J., Biermann, P. L.,
1999, ApJ Letters 524, 91.
Hasinger, G.,
1998, Astronomische Nachrichten 319, 37.
Hauser, M.G., Arendt, R.G., Kelsall, T., et al.
1998, ApJ 508, 25.
Heckman, T.M., Armus, L., Miley, G.,
1990, ApJS 74, 833.
Helou, G., Soifer, B. T., Rowan-Robinson, M.,
1985, ApJ Letters 298, L7.
Hornschemeier, A.E., Brandt, W.N., Garmire, G.P., 2000, ApJ in press
(astro-ph/0004260).
Hoyle, F., Wickramasinghe, N.C., 1991,
The theory of cosmic grains,
Kluwer Academic Publishers.
Hughes, D., et al.,
1998, Nature 394, 241.
Iuvela, M., Mattila, K., & Lemke, D., 2000, A& A in press
(astro-ph/0005510).
Ivison, R.J., Dunlop, J.S., Smail, I., Dey, A., Liu, M., Graham, J.,
2000, ApJ in press
(astro-ph/0005234).
Jimenez, R., Padoan, P., Dunlop, J., Bowen, D., Juvela, M., Matteucci,
F.,
2000, ApJ 532, 152.
Kennicut, R.C.,
1998, ARAA 36, 189.
Kormendy, J., Sanders, D.,
1992, ApJ Letters 390, 53.
Krawczynski, H., Coppi, P.S., Maccarone, T., Aharonian, F.A.,
2000, A&A 353, 97.
Lagache, G., Puget, J. L.,
2000, A&A 355, 17L.
Lagache G., Abergel, A., Boulanger, F., Desert, F.X., Puget J.L.,
1999, A&A 344, 322L.
Lagage, P.O., et al.,
1996, A&A 315, L273.
Lari, C., et al., 2000, A&A submitted.
Le Fevre, O., et al.,
2000, MNRAS 311, 565.
Lehnert, M., Heckman, T.M.,
1996, ApJ 462, 651.
Leitherer, C., Heckman, T.M.,
1995, ApJS 96, 9.
Leitherer, C., et al.,
1999, ApJS 123, 3.
Lilly, S.J., et al.,
1999, ApJ 518, 641.
Lonsdale, Carol J., Hacking, Perry B., Conrow, T. P., Rowan-Robinson, M.,
1990, ApJ 358, 60.
Lutz, D., Spoon, H. W. W., Rigopoulou, D., Moorwood, A. F. M., Genzel,
R.,
1998, ApJ Letters 505, L103.
Madau, P., Pozzetti, L.,
2000, MNRAS Letters 312, 9.
Madau, P., et al.,
1996, MNRAS 283, 1388.
Magorrian, J., et al.,
1998, AJ 115, 2285.
Matsuhara, H., et al., 2000, A& A in press
(astro-ph/0006444).
Mazzei, P., de Zotti, G., Xu, C.,
1994, ApJ 422, 81.
Mazzei, P., Aussel, H., Xu, C., Salvo, M., de Zotti, G., Franceschini,
A.,
2000, A& A submitted
Meurer, G. R., Heckman, T. M., Lehnert, M. D., Leitherer, C.,
Lowenthal, J.,
1997, AJ 114, 54.
Mie, G.,
1908, Ann. Physik 25, 377.
Miyaji, T., Hasinger, G., Schmidt., M.,
2000, A&A 353, 25.
Moorwood, A.,
1996, Space Science Reviews 77, 303.
Moorwood, A., Origlia, L., Kotilainen, J., Oliva, E., 1996, in
Proceedings of the ESO Symposium on Spiral Galaxies,
Springer-Verlag, Berlin, 299.
Mushotzky, R. F., Loewenstein, M.,
1997, ApJ Letters 481, 63.
Norman, C.A., Scoville, N.Z.,
1988, ApJ 332, 124.
Oliver, S., et al.,
1996, MNRAS 280, 673.
Oliver, S., et al., 2000a, MNRAS in press
(astro-ph/0003263).
Oliver, S., et al.,
2000b, MNRAS submitted.
Padoan, P., Juvela, M., Bally, J., Nordlund, A.,
1998, ApJ 504, 300.
Pearson, C., Rowan-Robinson, M.,
1996, MNRAS 283, 174.
Pier, E.A., Krolik, J.H.,
1992, ApJ 401, 99.
Poggianti, B.M., Bressan, A., & Franceschini, A.,
2001, ApJ 550, 195.
Poggianti, B.M., Wu, H.,
2000, ApJ 529, 157.
Puget, J.L., Leger, A.,
1989, ARAA 27, 161.
Puget, J. L., Léger, A., & Boulanger, F.
1985, A&A 142, L19.
Puget J.-L., et al.
1996, A&A 308, L5.
Puget, G.L., Lagache, G., Clements, D., Reach W., Aussel, H., Bouchet, F.,
Cesarsky, C., Desert, F., Dole, H., Elbaz, D., Franceschini, A., Guiderdoni,
B., Moorwood, A.,
1999, A&A 345, 29.
Rieke, G. H., Lebofsky, M. J., Thompson, R. I., Low, F. J., Tokunaga, A.,
1980, ApJ 238, 24.
Rieke, G. H., Lebofsky, M. J., Walker, C. E.,
1988, ApJ 325, 679.
Rigopoulou, D., Franceschini, A., Aussel, H., et al.,
2000, ApJ Letters, 537, L85.
Risaliti, G., Gilli, R., Maiolino, R., Salvati, M.,
2000, A&A 357, 13
Rowan-Robinson, M., Saunders, W., Lawrence, A., Leech, K.,
1991, MNRAS 253, 485.
Rowan-Robinson, M.
1992, MNRAS 258, 787.
Rowan-Robinson, M., et al.,
1997, MNRAS 289, 490.
Rush, B., Malkan, M.A., Spinoglio, L.,
1993, ApJS 89, 1.
Rybicki, G.B., Lightman, A.P., 1979,
"Radiative Processes in Astrophysics", J. Wiley
& Sons.
Sanders, D., et al.,
1988, ApJ 325, 74.
Sanders, D., & Mirabel, I.F.,
1996, ARAA 34, 749.
Saunders, W., Rowan-Robinson, M., Lawrence, A., Efstathiou, G., Kaiser,
N., Ellis, R. S., Frenk, C. S.,
1990, MNRAS 242, 318.
Saunders, W., et al., 1997, in
Extragalactic Astronomy in the Infrared,
G. A. Mamon, Trinh Xuan Thuan, and J. Tran Thanh Van. Eds, Paris,
Editions Frontieres, 431.
Scheuer, P.A.G.,
1957, Proc. Cambridge Phil. Soc. 53, 764.
Scott, D., et al.,
2000, A&A Letters 357, L5.
Scoville, N.Z., Yun, M.S., Bryant, P.M., 1996, in
Cold gas at high redshifts,
M. Bremer et al. Eds., Kluwer Academic Publishers, 25.
Siebenmorgen, R., Krugel, E.,
1992, A&A 259, 614.
Siebenmorgen, R., Rowan-Robinson, M., Efstathiou, A.,
2000, MNRAS 313, 734.
Silva, L., Granato, G.L., Bressan, A., Danese, L.,
1998, ApJ 509, 103.
Smail, I., Ivison, R. J., Blain, A. W.,
1997, ApJ Letters 490, L5.
Smail, I., et al.,
1999, MNRAS 308, 1061.
Soifer, B. T., Neugebauer, G., Matthews, K., et al.,
2000, AJ 119, 509.
Spinoglio, L., Malkan, M. A.,
1992, ApJ 399, 504.
Stanev, T., Franceschini, A.,
1998, ApJ Letters 494, L159.
Starck, J. L., Aussel, H., Elbaz, D., Fadda, D., Cesarsky, C.,
1999, A& AS 138, 365.
Stecker, F., De Jager, O., Salamon, M.,
1992, ApJL 390, L49.
Taniguchi, Y., Cowie, L.L., Sato, Y., Sanders, D., Kawara, K.,
1997, A&A 328, L9
Telesco, C.,
1988, ARAA 26, 343.
Tinsley, B.M.,
1977, ApJ 211, 621.
Toffolatti, Franceschini A., De Zotti G., Danese L.,
1987, A&A 184, 7.
Toomre, A., 1977, in
The evolution of galaxies and their stellar populations,
Yale University Observatory, 401.
van der Werf, P., 1996, in
Cold Gas at High Redshift, M. Bremer et al. Eds,
Kluwer Academic Publishers, 37.
Vigroux, L., et al., 1998, in
The Universe as seen by ISO, ESA-SP 427, 805.
Xu, C., 1997, in
Extragalactic Astronomy in the Infrared,
G. A. Mamon, Trinh Xuan
Thuan, and J. Tran Thanh Van Eds., Editions Frontieres, Paris, 193.
Xu, C., Hacking, P., Fang, F., et al.,
1998, ApJ 508, 576.
Xu, C., 2000, ApJ in press
(astro-ph/0004216).
Zoccali, M., et al.,
2000, ApJ 530, 418.