


Galaxy masses were first inferred from spiral galaxy rotation curves, which were themselves first measured in the early 1900's (Scheiner 1899; Slipher 1914; Pease 1918). The nebular lines from which velocity curves were derived already showed some evidence of a "tilt", indicative of rotation, even though these early spectra only sampled the inner parts of the galaxy. In his most original 1922 paper and using Pease's (1918) velocity curve of the Andromeda galaxy, Opik inferred a mass of 4.5 × 10⁹ M⊙ within 150" (~ 0.6 kpc) for M31. He did so by requiring that the M31 disk have a mass-to-light (hereafter M/L) ratio comparable to that of the solar neighborhood. This is the first reported measurement of galaxy mass. That same year, Kapteyn (1922) remarked in his study of the Milky Way's local mass density that "We have the means of estimating the mass of dark matter in the universe." This appears to be the very first reference to the concept of "dark matter" in astrophysics. His dynamical analysis and determination of the density in the solar neighborhood is also the first of its kind. However, Kapteyn failed to find the elusive dark matter given the limitations of his data and preliminary method, as reviewed by Oort (1932). The latter can be credited for the first discovery of dark matter in galaxies (see Zwicky 1933 for a similar discovery of dark matter in clusters of galaxies). In his 1940 study of NGC 3115, Oort remarks: "the distribution of mass in the system appears to bear almost no relation to that of the light". This is yet another pioneering report of large mass-to-light ratios in galaxies.
About our own Galaxy, Rubin et al. (1962) remarked "For R > 8.5 kpc, the stellar [rotation] curve is flat, and does not decrease as is expected for Keplerian orbits." Indeed, by the late 1960's, improved detectors at optical and radio frequencies yielded routine detections of flat galaxy rotation curves. Using a then-state-of-the-art image-tube spectrograph at the KPNO 84 inch telescope, Vera Rubin and Kent Ford (1970) obtained the first extended rotation curve of a galaxy (M31) out to 120' (~ 27 kpc). Roberts & Whitehurst (1975) confirmed the flatness of the M31 rotation curve observed by Rubin and Ford with 21cm velocities extending to 170' (~ 38 kpc). Roberts & Whitehurst however contended that dwarf M stars are adequate to explain the required mass and mass-to-light ratio. They, as well as most astronomers then, seem to have missed Freeman (1970)'s note that the HI rotation curves that were available at the time did not turn over at the radius expected from their surface photometry. Freeman's 1970 paper, commonly cited for its study of exponential disks in galaxies (rather than the note about), was likely the very first to quantify the mismatch at large galactocentric radii between the observed rotation curve and the rotation curve expected from the light distribution and constant M/L.
The flatness of observed rotation curves in all galaxy types is now a well-established fact (Faber & Gallagher 1979; Rubin et al. 1985; Sofue & Rubin 2001) but it is not by itself proof of dark matter in galaxies (see the prophetic contribution by Kalnajs in the 1982 Besancon conference proceedings Athanassoula 1983). Despite notable efforts by the likes of Kapteyn, Oort, Babcock, Mayall, de Vaucouleurs, Schwarzschild, the Burbidge's, Roberts, Rubin, and others, and the realization that luminous galaxies are not a simple Keplerian environment, the firm manifestation of dark matter through galaxy rotation curves would await extended dynamical measurements at radio wavelengths (21cm line of neutral hydrogen), especially with the Westerbork Synthesis Radio Telescope (WSRT) (e.g. Rogstad & Shostak 1972; Bosma 1978; van der Kruit & Allen 1978), and the ability to place upper limits on the contribution of the baryonic component to the total observed rotation curve (Bosma 1978; Carignan & Freeman 1985; van Albada et al. 1985; Kent 1986; Kent 1987).
The first detailed and unambiguous demonstration of unseen mass in galaxy disks from the mass modeling of galaxy rotation curves came with Albert Bosma's outstanding PhD thesis in 1978. Using early disk analysis methods by Toomre (1963), Shu et al. (1971), and Nordsieck (1973), Bosma was able to decompose the extended rotation curves of 25 spiral galaxies to show for the first time that the total M/L ratio of galaxies grows with radius. To our knowledge, Faber & Gallagher (1979) were the first to link measurements for the local mass density (Oort 1932; 1965), the velocity dispersion in galaxy clusters (Zwicky 1933), and the notion of flat extended galaxy rotation curves (Bosma 1978), into a coherent picture of missing mass on global galactic and extragalactic scales.
While measurements of gas and stellar motions for mass estimates of gas-rich galaxies are now fairly straightforward, it is of relevance to discuss the applicability and accuracy of their related mass estimators. Modern mass modeling of galaxy rotation curves, and the ability to disentangle baryonic and non-baryonic components, are being reviewed below.
A modern review of the structure of galaxy disks can also be found in van der Kruit & Freeman (2011, hereafter vdKF11). We shall defer to that review in some cases below for more detailed discussions and/or derivations than can be provided here.
In their 2001 ARAA article, Sofue and Rubin write "Babcock and Oort share credit for uncovering the dark matter problem in individual spiral galaxies" for their work in the 1930's. The pioneering contributions in the 1960's-80's of Toomre, Kalnajs, Shu, Freeman, Bosma, Carignan, Kent, van Albada, van der Kruit, Sancisi, and others to the problem of galaxy mass models should also be underscored.
3.1. Mass Estimates from Rotation Curves
The mass distribution in disk galaxies is typically determined from resolved rotation curves or integrated line profiles extracted from emission lines such as Hα, CO, and HI lines. With the current generation of detectors, the Hα and CO lines yield high spectral resolution spectra over most of the optical disk; greater spatial coverage (often at the expense of spectral resolution) is usually obtained with resolved HI velocity curves. Integrated line widths only yield an estimate of a total mass within some (uncertain) isophotal radius. A more accurate assessment of the extended galaxy mass profile is obtained from 2D resolved HI velocity fields but the prohibitive exposure times constrain sample sizes (e.g. de Blok et al. 2008). For nearby disks, Hα velocity fields (with, e.g., SparsePak, DensePak, PPAK) and CO velocity fields (with, e.g. CARMA) are just as slow to obtain. The extent of the neutral gas in spiral galaxies, as traced by rotation curves, can often exceed twice that of the stars.
There is good agreement between resolved rotation curves extracted from Hα, HI and CO lines (Sofue & Rubin 2001; Simon et al. 2003; Simon et al. 2005; Spekkens & Sellwood 2007) and from [OII], [OIII], Hβ, [NII], and [SII] lines (Courteau & Sohn 2003) within the optical disk of galaxies.
It is often assumed that HI line widths sample the disk to large galactocentric radii, by analogy to resolved HI rotation curves; however, HI line widths are a convolution of gas dynamics and exponentially declining gas surface densities (e.g. Cayatte et al. 1994) such that the effective depth of integrated line widths is likely representative of the gas distribution within the optical disk of a galaxy. This is in line with the many linear transformations that exist between Hα rotation measures and HI line widths (Mathewson et al. 1992; Courteau 1997; Catinella et al. 2007, to name a few).
The circular velocity of a spherical system in a potential Φ is given by
 |
(2) |
where M(r) is the enclosed mass within a sphere of radius r. For a flattened disk, as in most spiral galaxies, the right hand side of eq. (2) must to be replaced by the more exact expression derived by Freeman (1970). In the absence of dark matter or bulge, it should be stated that the exact expression for the rotation curve of a self-gravitating exponential disk is described by Freeman (1970):
 |
(3) |
where, G is the gravitational constant, Σ0 the central surface brightness, Rd the disk exponential scale length, y≡ R / 2Rd, and Ii(y) and Ki(y) are the modified Bessel functions of the first and second kind Freeman (1970, see also vdKF11 and Fig 2.17 of Binney & Tremaine 2008a). The rotation curve of a pure exponential, infinitesimally thin, disk peaks at V2.2 ≡ V(R = 2.15 Rd). For disks of finite thickness (say, z0 / Rd = 0.2, where z0 is the disk scale height), the rotation curve will have a very similar shape but a ~ 5% lower peak (e.g. Casertano 1983); this will slightly affect the "shape" term in the square brackets in eq. (3), but leave the subsequent scalings untouched.
The reliability of M(r) depends on how the rotational velocities, Vrot, reflect the assumed circular velocities. Several factors which involve corrections for observational and physical effects come into play. First, the observed line-of-sight velocity, Vlos, must be corrected for projection via:
 |
(4) |
where i is the inclination of the galaxy disk (or a ring along that disk, for tilted ring solutions; Teuben 2002). The above equation applies for velocities along the major axis; for the general case along any other projection, see Teuben (2002).
The spatially-resolved rotation curve or integrated line width of a rotating system is obtained via the Doppler equation:
 |
(5) |
where λ0 is the observed wavelength of the galaxy center and r is the position along the slit. A line width W, usually equal to 2Vobs, must also be corrected for internal turbulence and other effects (e.g. Haynes & Giovanelli 1984; Catinella et al. 2007).
The inclination angle, i, for an oblate spheroid is given by the formula (Holmberg 1946):
 |
(6) |
where the semi-major (a) and semi-minor (b) axes are determined rom isophotal fitting of the galaxy image, and q0 is the axial atio of a galaxy viewed edge-on (for late-type disks, q0 ≃ 0.13 Hall et al. 2012, and references therein).
Inclination uncertainties in Eq. (2) can be most significant for systems with i < 30° or for distant galaxies whose disk is poorly resolved (in such cases, space-based observations or adaptive optics are needed to overcome the effect of atmospheric blur). Inclination estimates vary as a function of wavelength and are clearly affected by warps beyond the optical disks (Briggs 1990). Tilt uncertainty, such as due to warps, can account for a significant fraction of the mass budget in the outer parts of the disk. This is illustrated in Figure 10 for the mass profiles of NGC 45, M31, and M33 obtained assuming a kinematical model with constant inclination and major axis position angle (red open squares) or a full tilted ring model (blue filled squares). The ratio of these curves is shown on the right side of Figure 10 as a function of radius normalized by the disk exponential scale length, h. While the value of h depends on the assumed distance to the galaxy and details of surface brightness profile fitting (Courteau et al. 2011), Figure 10 makes clear that tilted ring models are required for rotation curves extending beyond 5-6 optical disk scale lengths.
 |
Figure 10. Mass profiles from HI rotation curves of NGC 45 (Chemin et al. 2006b), M31 (Chemin et al. 2009), and M33 (Chemin et al., in prep.). Mass profiles on the left were obtained from rotation curves assuming a kinematical model with constant inclination and constant position angle of the major axis (red open squares) or a full tilted ring model (blue filled squares). The adopted distances are NGC 45 (D = 5.9 Mpc), M31 (D = 785 kpc), M33 (D = 800 kpc). The ratio of these mass profiles is shown on the right side where the radial scale has been normalized by the optical exponential disk scale length, h. |
The effects of slit misalignment (erroneous position angles) for long-slit spectra on mass estimates are also addressed in Rhee et al. (2004), Spekkens et al. (2005), and Chemin et al. (2006a).
Ideally, a total enclosed galaxy mass should be determined using the most extended rotation curve and probing a regime where the RC is flat. Velocity curves can be modeled using a fitting function (Courteau 1997; Giovanelli & Haynes 2002). This is especially useful for low mass systems whose observed rotation curves rarely reach a plateau (caution is advised against extrapolations) or for noisy rotation curves with spiral structure wiggles. The reliability of mass estimates depends greatly on the stability of the velocity measure. For instance, Vobs is typically measured for one-sided resolved rotation curves at a fiducial marker such as V(Rmax), where Rmax is the radius at which Vobs reaches its peak value or V23.5, the velocity measured at the 23.5 mag arcsec-2 I-band isophote (Courteau 1997), or at half of a suitably chosen width of an integrated line profile (Haynes & Giovanelli 1984; Springob et al. 2005). Different definitions of rotational velocities or line widths can yield tighter galaxy scaling relations. For example, measurements of Vobs either at V2.2 or V23.5 yield the tightest scatter in various galaxy scaling relations for bright galaxies (Courteau 1997). For the rising rotation curves of lower surface brightness systems, Catinella et al. (2007) note that the V2.2 values may not probe the RC deeply enough and that these may therefore show a surface brightness dependence. V23.5 would thus be a safer mass tracer, provided that the rotation curve is sampled that far.
Optical (typically Hα) rotation curves for bright galaxies may show extended flattening out to 4-5 disk scale lengths (Courteau 1997), such that a maximum Vmax = V(Rmax) may be estimated. HI rotation curves routinely extend to that radius, making the measurement of Vmax straightforward from these data.
Beyond galaxy disks, little is known about the mass profiles of individual galaxies. By stacking galaxies of similar masses or luminosities, it is possible to use weak gravitational lensing (see Section 6) or satellite kinematics (e.g. More et al. 2011a) to measure total masses within the virial radius of the dark matter halo. This mass can be trivially converted into the circular velocity at the virial radius, V200. By comparing with the rotation velocities within the optical disk, Vopt, one finds that on average for late-type galaxies Vopt / V200 ≃ 1.2 (Dutton et al. 2010; Reyes et al. 2011). Thus, the dark matter near the virial radius may have slightly lower circular velocity than that of the inner baryons, and extended rotation curves are best decomposed into their major components (bar, bulge, disk, halo) rather than extrapolated. We discuss such decompositions in Section 3.3.
The velocity function (or the number of galaxies per unit circular velocity per volume) of spiral galaxies has been measured directly for the Virgo cluster by Papastergis et al. (2011). The full spectrum of (projected) line widths ranges from 20 km s-1, where corrections for turbulence dominate measurement uncertainty, to more than 400 km s-1. 3
For a spherically symmetric system, the total mass enclosed within a radius R can be written in solar units as:
 |
(7) |
where R is the radius along the major axis in kpc and
Vobs is the
observed rotation velocity in km s-1. Galaxy masses are thus best
measured for systems with accurate distances; galaxies in unvirialized
clusters or close enough (cz
 5000 km
s-1) to experience
substantial deviations from the Hubble flow clearly suffer (linearly)
from significant distance estimate errors.
5000 km
s-1) to experience
substantial deviations from the Hubble flow clearly suffer (linearly)
from significant distance estimate errors.
Note that while the total enclosed mass, M(R), is corrected for projection through Eq. (7), the complete deprojection of a rotation curve into a radial mass profile requires a tilted-ring analysis of the light distribution to account for the combined effects of a bulge, bar and disk (and sometimes a stellar halo) and isophotal warps Figure 10. Other physical effects discussed below in Section 3.2 make this endeavor, especially in the inner parts of a galaxy, a rather challenging and uncertain one. To probe the total galaxy potential in its outskirts would require other tracers such as planetary nebulae, globular clusters and satellites.
In addition to errors introduced by deprojection effects and distance uncertainty, fundamental physical complications thwart the direct interpretation of galaxy rotation curves via Eq. (7) in their inner parts. These include deviations from circular orbits due to bar-like perturbations, differential dust opacity in the bulge and inner disk, density profile variations due to a triaxial halo, and more. We address these briefly below.
Because a large fraction of gas-rich galaxies have non-axisymmetric inner parts, non-circular velocities are often observed within the corotation radius of gas-rich galaxies (Lindblad et al. 1996; Weiner et al. 2001; Courteau et al. 2003; Valenzuela et al. 2007; Spekkens & Sellwood 2007; Sellwood & Sánchez 2010). Once identified, correcting for non-circular motions is a daunting task. To relate those motions with a photometric bar requires detailed, model-dependent fluid dynamical simulations (see Section 3.4.4). Beyond the self-consistent treatment of the bar in these fluid-dynamical models, the correlation between the observed photometric bar strength (or length) and the amplitude of bar-like non-circular motions has not been widely explored (Spekkens & Sellwood 2007; Sellwood & Sánchez 2010; Kuzio de Naray et al. 2012); the latter requires high-quality 2D velocity fields and an empirical means to measure bar-like flows. Furthermore, the contribution of a bar or oval distortion to non-circular motions depends on the angle between the bar axis and the major axis. The amplitude of a rotation curve will be biased high/low if a bar close to the minor/major axis is neglected (Spekkens & Sellwood 2007; Sellwood & Sánchez 2010).
As an example for the phenomenological description of the influence of a bar on measured rotation curves, we show in Figure 11 a diagram adapted from Valenzuela et al. (2007). These authors used N-body simulations to show that non-circular motions, combined with gas pressure support and projection effects, can result in a large underestimation of the circular velocity in the central ~1 kpc region of a gas-rich dwarf galaxy. While those highlighted effects are stronger in barred systems, they are also present in axisymmetric disks. Their simulations show that Vobs ≃ Vcirc only beyond 3 disk scale lengths.
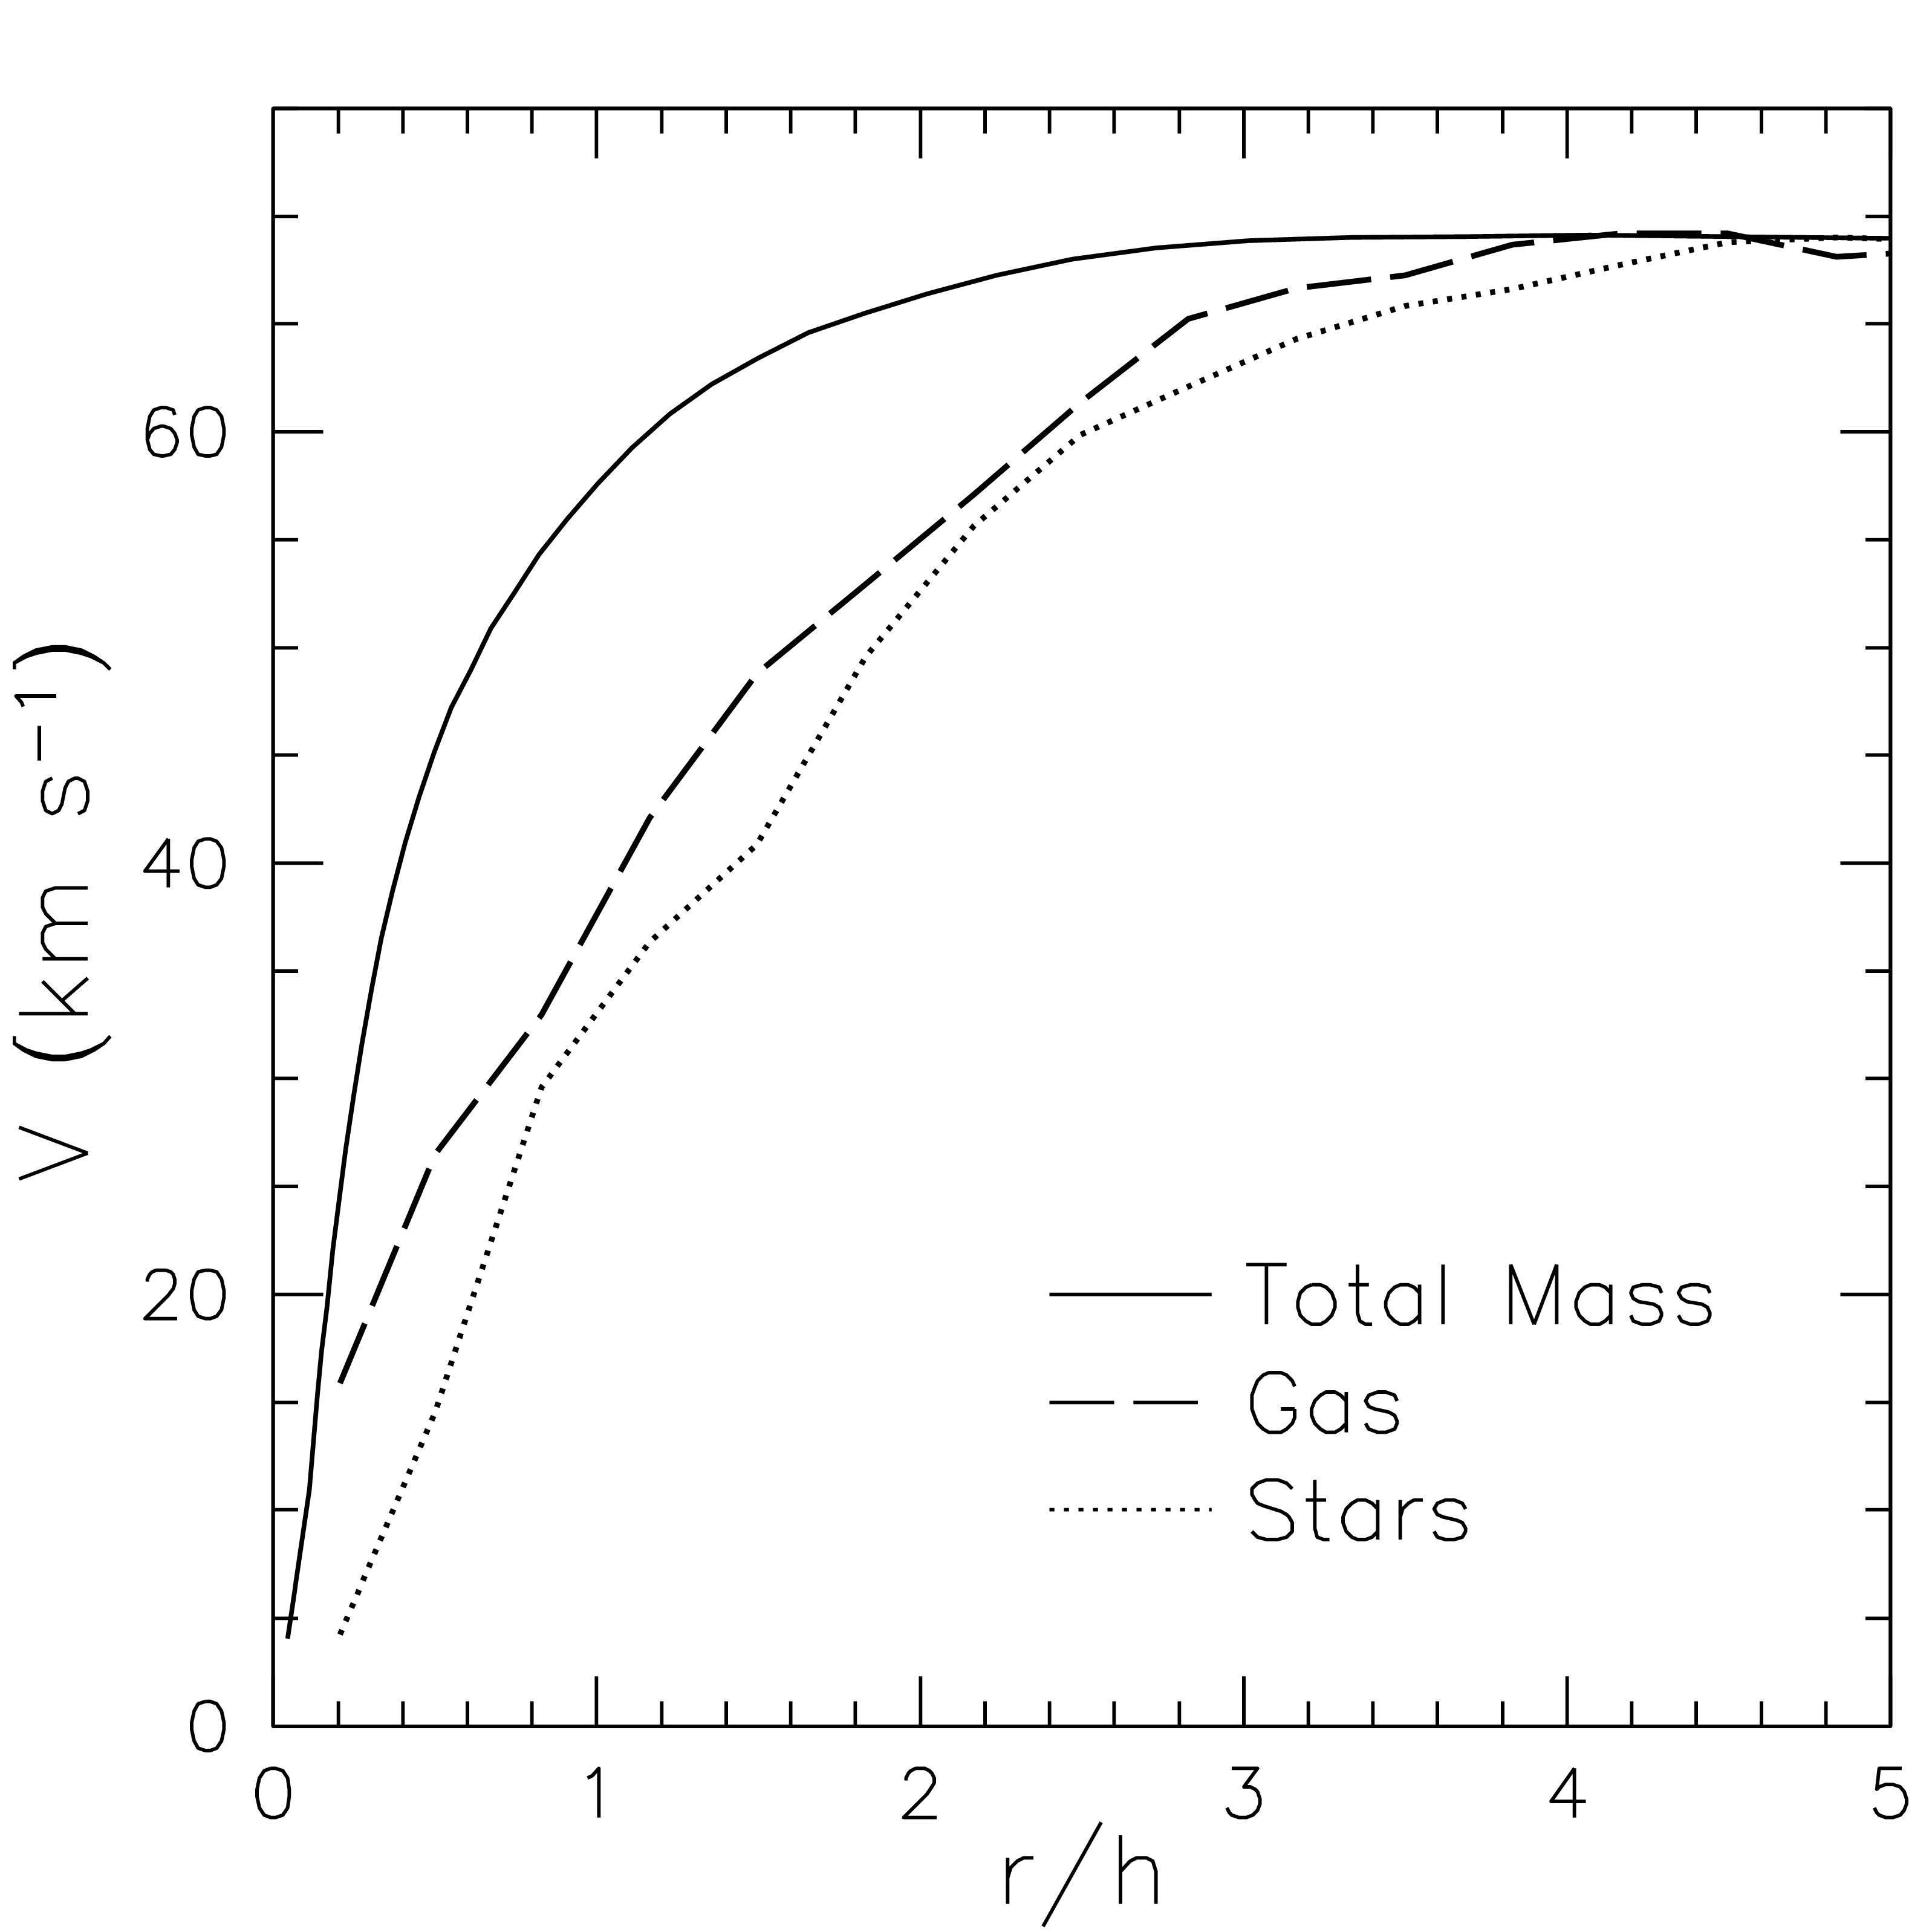 |
Figure 11. Simulated velocity curves for a dwarf galaxy from Valenzuela et al. (2007). The solid curve shows the spherical averaged circular velocity (GMtot / r)1/2. The long-dashed curve is for the azimuthally-averaged rotation velocity of gas particles. The stellar rotation velocity is shown by the dotted curve. Curves for the gas and stars are substantially below the circular velocity for r < 3h, where h is the disk scale length. |
The differential opacity in spiral disks (Bosma et al. 1992; Giovanelli & Haynes 2002) also cautions for a careful interpretation of optical rotation curves. The effects of dust extinction on velocity curves, which tend to mimic solid-body rotation, can be significant at high tilt (> 80°) and for wavelengths bluer than Hα (Courteau 1992; Bosma et al. 1992) within one disk scale length. This "tapering" effect is also luminosity dependent, being stronger for the most luminous systems (Giovanelli & Haynes 2002). This problem is mostly overcome by measuring rotation curves at near-infrared wavelengths (e.g. through the Pa α and Br γ hydrogen recombination lines) where extinction is minimised 4. Radio observations nearly alleviate this concern, though lower resolution at HI may affect the rise of the rotation curve in the central regions (Bosma 1978; van den Bosch & Swaters 2001), and the HI optical depth and related self-absorption effects are not negligible in more inclined galaxies (Rupen 1991). The high-spatial resolution kinematics of galaxies' inner regions from high-J CO line spectroscopy using the Atacama Large Millimeter Array will soon lessen these issues, though similar concerns as above for more inclined galaxies apply. Effects due to triaxiality and flattening of the disk have been discussed in Dutton et al. (2005) and Binney & Tremaine (2008, Fig. 2.13).
For distant galaxies, the inner rise of the rotation curve is also critically damped by both resolution effects and enhanced central galaxy activity which contributes more dust per unit area at early times. Both dust extinction and resolution yield observed rotation curves that are shallower than the true velocity profile (Förster Schreiber et al. 2006).
Due to the complex and somewhat uncertain modeling involved in correcting for non-circular motions and internal extinction, masses for nearby galaxies are often extracted beyond corotation or, equivalently, beyond two to three disk scale lengths (Kranz et al. 2003; Valenzuela et al. 2007).
An ultimate goal of galaxy mass studies is the decomposition of a mass profile into its main components - the bulge, disk and dark matter halo - at all radii. Unlike gas-poor systems (Section 5) whose spectral features are faint beyond one effective radius, mass modeling decompositions can be attempted for spiral galaxies since dynamical tracers are conspicuous from the center to the optical edge. Pioneering mass models have been derived by Casertano (1983), Wevers (1984), Carignan & Freeman (1985), van Albada et al. (1985) and others.
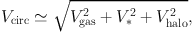
Mass modeling is possible because the gas particles and stars are sensitive to the full potential contributed by the baryons and dark matter. If the matter distribution is axially symmetric and in centrifugal equilibrium, then the total circular velocity is given by,
 |
(8) |
at each radius R in the plane of the galaxy, where Vgas, V*, and Vhalo are the observed rotation curves of the gas, stars, and halo components respectively. The latter accounts for the baryons and presumed dark matter particles in the halo. Vhalo is usually inferred once the gas and stellar component have been subtracted from the observed overall rotation curve.
The velocity curves for the stars and gas found in the galaxy bulge and disk can be obtained by inverting their respective light (emission) profiles into mass profiles using suitable potentials and stellar M / L* ratios. For instance, the stellar rotation curve is obtained by multiplying the light profile, ideally in a band where dust extinction effects are minimised, with an optimized M / L* consistent with stellar population models (Section 2).
The neutral atomic gas, MHI, can be estimated from the total HI flux density, S21, measured from the 21-cm line in absorption and emission:
 |
(9) |
where D is the physical distance to the source in Mpc and S21 is the integrated flux density of the source in Jy km s-1. The total gas mass which accounts for helium and other metals is given by:
 |
(10) |
for an optically thin gas. An estimate of the molecular gas mass is more challenging since H2, the most abundant molecule in the Universe by far, has no permanent electric dipole moment and thus cannot emit in the state in which it is typically found. Consequently, the second most abundant molecule, the CO molecule which has an electric dipole and is often optically thick, can be used since it is collisionally exited by H2. However, the conversion from CO intensity to H2 mass, via some "XCO" factor, is notoriously uncertain (e.g. Bolatto et al. 2008). Still, Braine et al. (1993) have estimated the mass contribution of molecular gas to ~ 20% of the HI mass, and this fraction decreases in later-type systems. For these reasons, we do not consider the molecular mass content further.
Detailed mass models of spiral galaxies, including the equations for the density profiles and associated rotation curves for the bulge, disk and halo profiles can be found in, e.g., Dutton et al. (2005), de Blok et al. (2008), Tamm et al. (2012) and Section 11.1 of Mo et al. (2010). Disks are often modeled as idealized infinitesimally thin, radially exponential, collections of dust, gas and stars with surface density distributions (Freeman 1970):
 |
(11) |
where Rd is the scale length of the specific disk component. The total mass of the disk is Md = 2π Σ0 Rd2. Dutton et al. (2011b) show that disk scale lengths of the gas are on average 1.5 times greater than disk scale lengths measured in the R-band light. The case of a thicker disk (Casertano 1983) adds only a small effect to the overall rotation curve (Mo et al. 2010). Real disks, however, often show spiral arm features, truncations, anti-truncations, and other deviations from a pure exponential surface density distribution (see e.g. van der Kruit & Freeman 2011) that are best modeled through a free form reconstruction of the stellar mass by inversion of the light profile as discussed above after Eq. (8).
The halo profile is obtained as the difference (in quadrature) between the observed rotation curve and the inferred baryonic components (eq. (8)). The halo is typically modeled as a pseudo-isothermal profile (Burkert 1995), a cosmologically-motivated dark profile (Navarro et al. 1996b; 1997, hereafter NFW), or an Einasto fitting function (Einasto 1965; Einasto 1969). The halo profile can be conveniently parameterized via the following function (Kravtsov et al. 1998):
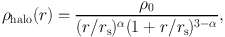 |
(12) |
where ρ0 is a central density, rs is a scale radius, and α is a shape index. This density profile has an inner logarithmic slope of -α. For α = 1 this reduces to the NFW profile, and at the scale radius, rs, the slope of the density profile is -2 (isothermal). At large radii, the logarithmic slope is -3.
3.3.1. Mass Modeling Limitations
The greatest source of uncertainty in mass modeling is the assessment of realistic stellar M / L* ratios, followed by ill-constrained covariances amongst halo parameters as well as between halo and disk parameters, as we discuss below.
The computation of mass models through Eq. (8) usually involves four fundamental parameters: one for the stellar M / L*, and three for the halo component (as in eq. (12)). In the language of NFW, those three quantities are the dark matter halo shape index, α, a velocity normalization, V200, and a concentration, c.
Figure 12 highlights many of the challenges inherent to mass modeling such as the intrinsic degeneracy of current mass model solutions due to strong covariances between the disk and halo model parameters (see also van Albada et al. 1985). Figure 12 shows examples of modeled rotation curves for galaxies in three different mass range. The purple and black points are Hα and HI velocity data from Blais-Ouellette (2000). The fitted components are shown for the gas (green), disk (blue) and halo models (red). In each panel, one model parameter is held fixed while the others can adjust to achieve a best fit solution (by minimizing the global data-model χ2 statistic). In all cases, the model decompositions (two per galaxy) in a given column have the same overall χ2 statistic. Variations in the fitting parameters can result in the same data-model residuals (dV, shown in the smaller horizontal windows) thus yielding non-unique solutions. The two right-side panels highlight the well-known disk-halo degeneracy between the stellar disk M / L*, here expressed as ΥR in the R-band, and the halo inner slope α (a cusp has α = 1, a core has α = 0; see Eq. (12)). The two central panels show another facet of the disk-halo degeneracy assuming that all dark matter halos are cuspy. The range of acceptable parameters is large. Finally, the left panels show that model degeneracies exist even amongst halo parameters, assuming a common best-fitting stellar M / L* ratio (in agreement with stellar population models). Thus, in order to achieve realistic mass models, both accurate stellar M / L* and well-constrained cosmological models are needed. Stellar M / L* are only accurate to factors of two (Section 2) and the current range of allowed halo parameters, c, V200 and α is still too broad to provide tight (unique) mass model solutions (e.g. Macciò et al. 2008). The inner shape parameter, α, is especially difficult to constrain observationally due to the added complication that only a small number of rotation curve points constrain this value; see Dutton et al. (2005) and de Blok (2010) for reviews.
 |
Figure 12. Mass models for three spiral galaxies with a range of peak circular velocity. The X-axis is in units of the optical disk scale length, h. The velocity on the Y-axis is normalized by the maximum observed orbital velocity. There are four free fitting parameters: ΥR, is the stellar M / L* (here in the R-band) and α, c, and V200 describe the NFW dark matter halo (see Dutton et al. 2005, for details). Variations in the fitting parameter can result in the same data-model residuals, as gauged by the model residuals dV (shown in the lower windows) and the overall χ2-square statistic. The model decompositions in each column (two per galaxy) have the same overall χ2-square statistic, shown at the top. Mass models are thus non-unique. See text for details. |
An additional complication to the mass modeling exercise is whether the initial distribution of dark matter particles is affected by the gradual cooling of the baryons as a galaxy forms. If the potential variations due to the dissipating baryons occur slowly compared to the orbital period of a dark matter particle in circular orbit, then the end state of the system is independent of the path taken (Blumenthal et al. 1986; Gnedin et al. 2004; Abadi et al. 2010). Thus, contraction of the dark matter occurs when baryons collapse and come to the central region; if the gravitational potential increases, matter naturally follows. This "adiabatic" contraction of the halo due to the cooling baryons can be modeled as
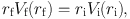 |
(13) |
where Vi(ri) and Vf(rf) are the initial and final rotation curves, respectively, and r V(r) is the adiabatic invariant (Mo et al. 2010) 5. The example of a modeled rotation curve with and without adiabatic contraction (hereafter AC) is shown in Figure 13. This model has a fixed stellar M / L* = 1 and halo α = 1. The ratio of dark to baryonic mass within the optical disk of a galaxy can increase by almost 40% if AC is invoked. In more extreme cases, AC can transform an initial ρ ∝ r-1 NFW-type halo into a ρ ∝ r-2 isothermal halo.
 |
Figure 13. Mass model for the bright spiral galaxy NGC 2403 with an adiabatically contracted halo model (long dashed red line) or not (initial model shown with red dotted line). The disk and gas profiles correspond to the contracted final model. The data-fit residuals, ΔV, are shown in the lower part of the figure. The ratio of dark to baryonic mass within the optical disk of a galaxy can increase by almost 40% within V2.2 if AC is invoked. The observed velocity data (black points) are from Blais-Ouellette (2000). See text for details about the modeling technique. |
While AC is undoubtedly at play in all forming galaxies, it has been known for many years that baryonic effects such as supernova feedback and dynamical fraction can, in principle, result in reduced halo contraction or even halo expansion (e.g. Navarro et al. 1996a; El-Zant et al. 2001). Only recently have these effects been demonstrated in fully cosmological simulations of galaxy formation (Johansson et al. 2009; Abadi et al. 2010; Duffy et al. 2010; Macciò et al. 2012; Martizzi et al. 2012; Governato et al. 2012). Despite recent progress, cosmological simulations have not yet provided unique predictions for the response of dark matter halos to galaxy formation. A wide range of possibilities (from adiabatic contraction to expansion, from cuspy to cored halos) should thus be accounted for when attempting mass models of galaxies.
3.4. Other Galaxy Mass Constraints
Besides mass modeling of individual galaxies, with all the limitations that this entails as we saw above, potentially tighter constraints for the mass of baryonic and dark matter in disk galaxies may be achieved through dynamical or statistical arguments. As a way of introduction, we first present various methods to constrain the stellar M / L*, independently of stellar population models.
3.4.1. Maximal and Sub-maximal Disks
The hypothesis that the bulge and disk could contribute "maximally" to the rotation curve was introduced by Carignan & Freeman (1985) and van Albada et al. (1985) in order to overcome the intrinsic uncertainties of stellar M / L* ratios. A maximal disk obeys
 |
where Vdisk is the inferred velocity of the disk
(stars and gas), Vtot is the total observed velocity,
and Rmax
is the radius at which Vdisk reaches its peak value
(Sackett 1997).
For a pure exponential disk, this is V2.2
(see Section 3.1). In other words, for a maximal disk
galaxy, Vdisk2(Rmax) /
Vtot2(Rmax) ≳ 0.72
and the disk contributes at least 72% of the total rotational support at
Rmax. Note that this is just an arbitrary convention
following
Sackett (1997).
A lesser contribution of the disk to the
overall rotation curve at Rmax is deemed "sub-maximal".
Since a galaxy with a sub-maximal disk with a significant bar or bulge
component can still be baryon-dominated within Rmax, we
define a galaxy to be maximal at Rmax if
 > 0.85,
where Vdisk is the inferred velocity of the baryons (bulge
and disk). Even in the presence of a maximal disk, rare are the
galaxies that do not require a halo component to match fully extended
rotation curves. For dwarf galaxies, maximal disks often involve
stellar M / L* ratios that are physically
implausible
(Swaters et
al. 2011).
> 0.85,
where Vdisk is the inferred velocity of the baryons (bulge
and disk). Even in the presence of a maximal disk, rare are the
galaxies that do not require a halo component to match fully extended
rotation curves. For dwarf galaxies, maximal disks often involve
stellar M / L* ratios that are physically
implausible
(Swaters et
al. 2011).
The central panel of Figure 12 provides a good example of a sub-maximal (top) versus a maximal (bottom) disk fit. Both fits are equally valid numerically (see also Kassin et al. 2006; Noordermeer et al. 2007). Thus, without further constraints and especially extended HI rotation curves, the choice of a (sub-)maximal disk solution remains ill-constrained. Fortunately, arguments about the dynamical structure of disks and the existence of velocity-luminosity (VL, aka "Tully-Fisher") relation of spiral galaxies allow for new constraints to be implemented as we discuss in Section 3.4.3 (see also lucid discussions on this topic by vdKF11). In general, those other techniques listed below point to galaxy disks whose stellar masses are significantly below the so-called maximal value.
3.4.2. Velocity Dispersion Measurements
For a self-gravitating, radially exponential disk with vertical profile of the form ρ(R,z) = ρ(R,0) sech2(z / z0), van der Kruit (1988) and Bottema (1993) showed that the peak circular velocity of the stellar disk, Vdisk, measured at R = 2.2Rd can be related to the vertical velocity dispersion, Vz, and the intrinsic thickness (or scale height) of the disk, z0, via:
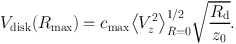 |
(14) |
where cmax ≃ 0.88 (1-0.28 z0/Rd) (Bershady et al. 2011). A more detailed discussion of eq. (14) is presented in vdKF11 (see their Section 3.2.4).
The power of Eq. (14) is that the disk M / L*, derived via Vdisk(Rmax), can be determined independently of the dark matter halo. However, the measurements involved are difficult since the scale height, z0, and the vertical component of the velocity dispersion, Vz, cannot be measured simultaneously. Thus this method is statistical in nature, at least for nearly edge-on (Kregel et al. 2005) and nearly face-on (Andersen et al. 2006; Andersen & Bershady 2013) systems. Indeed, for face-on systems, Vz can be measured but z0 must be inferred; and vice versa for edge-ons. The tightness of the statistical correlations used to infer z0 and Vz for face-on and edge-on galaxies, respectively, is reviewed by Bershady et al. (2010b). Furthermore, Bershady et al. (2011) showed that the edge-on sample of Kregel et al. (2005) and the face-on sample (so-called "DiskMass Survey") of Bershady et al. (2010a) yield similar distributions of Vdisk versus Vz. Systematic errors in M / L* estimates based on Eq. (14) are thus relatively small.
Kregel et
al. (2005)
painstakingly determined the intrinsic stellar disk
kinematics through Eq. (14) for 15 intermediate and late-type
edge-on spiral galaxies using a dynamical modelling technique and
assuming that σz / σr = 0.6
± 0.1 (based on various
plausible arguments). For 12 of their 15 spirals, they find on
average = 0.53 ± 0.04.
They also find that the contribution of the disk to
V2.2 is
independent of barredness, in agreement with the "Tully-Fisher"
(VL) analysis of barred galaxies
6
by
Courteau et
al. (2003)
and
Sheth et al. (2012)
and the N-body simulations of
Valenzuela
& Klypin (2003).
More recently,
Bershady et
al. (2010a)
applied the velocity dispersion
method on a sample of 46 nearly face-on (inclinations ≃ 30
degrees) galaxies. This survey uses integral-field spectroscopy to
measure stellar and gas kinematics using the custom-built SparsePak
and PPAK instruments. For the high-surface-brightness galaxy UGC 463,
Westfall et
al. (2011)
find the galaxy to be sub-maximal at 2.2 disk scale lengths with
=
0.61-0.09+0.07(ran)-0.18+0.12(sys).
The ratio could be much
smaller for lower surface brightness systems. In fact,
Bershady et
al. (2011)
confirm for
30 DiskMass systems covering a range of structural properties
that the fraction ranges
from 0.25 to 0.65 and increases
with luminosity, rotation speed, and redder color.
The DiskMass project does not include a dark matter component
in their analysis since their data in the plane of the disk
is largely baryon dominated (even in areas where dark matter
dominates the enclosed mass). The impact of the dark halo is to make the
disks less maximal (as advocated by
Bottema 1993)
at the 20% level.
3.4.3. Scaling Relations Residuals
Courteau
& Rix (1999)
suggested that sub-maximal disks provide a
solution to the surface brightness independence of the VL relation
(see also
Zwaan et al. 1995).
Courteau & Rix found that,
on average, high-surface brightness spiral galaxies have
0.6 ± 0.1,
as recently verified by Bershady et al.
(2011,
see Section 3.4.2). Their
argument relies on the assumption that the scatter in the VL
relation and the size-luminosity relation is largely controlled by the
disk scale length, that spiral galaxies have self-similar M /
L profiles (different than having constant M / L
ratios), and that dark matter halos are adiabatically contracted.
Dutton et
al. (2007)
revisited
the Courteau & Rix method using a more detailed account of baryonic
physics to find that
0.72 ±
0.05 if AC
is ignored or compensated for by other mechanisms which may result from
non-spherical, clumpy gas accretion, coupled with dynamical friction
transfer of energy from the gas to the dark matter.
Dutton et
al. (2007)
reproduced the
Courteau
& Rix (1999)
result if AC is invoked. Either way,
most spiral disks obey the sub-maximal disk constraints.
3.4.4. Fluid Dynamical Modeling
Dynamical friction between a stellar bar and a dark matter halo is believed to slow down the pattern speed of the bar, and therefore fast bars should imply maximal disks (Weinberg 1985). A compilation of 17 barred galaxies analysed via the "Tremaine-Weinberg" method was presented by Corsini (2011); the overall impression from these analyses favors maximal disks. Likewise, slow bars might imply maximal halos (e.g., for UGC 628, Chemin & Hernandez 2009). However, some of these claims have been challenged on account of numerical artifacts yielding e.g. over-efficient bar slow down (Valenzuela & Klypin 2003). Indeed, Athanassoula (2003) and Athanassoula et al. (2013) have argued that the decrease in the pattern speed does not depend only on the mass of the dark matter halo, but also also on other galaxy properties such as gas fraction, or halo shape. Thus they argue that, on its own, the pattern speed decrease cannot set constraint to the halo mass.
Based on detailed fluid dynamic modeling, a maximal disk solution
was found by
Englmaier &
Gerhard (1999)
for the Milky Way and by
Weiner et
al. (2001)
for the NGC 4123. Both galaxies are barred (see
Sellwood &
Sánchez 2010,
for other examples). Conversely, the hydrodynamic gas simulations used by
Kranz et al. (2003)
to model the spiral arm structure of five
grand design non-barred galaxies yield a wide range of
, from closely maximal to
0.6. Galaxy disks appear to be maximal if Vmax >
200 km s-1, sub-maximal otherwise.
Although detailed comparisons of observed galaxy velocity fields
with hydrodynamic gas simulations are challenging, future galaxy
masses review ought to include more analyses of this kind.
In the rare cases where a distant galaxy or quasar is lensed by a foreground galaxy, gravitational lensing can be used to place constraints on the projected ellipticity and mass within the Einstein radius. For disk-dominated lenses, this extra information coupled with spatially resolved kinematics can be used to break the disk-halo degeneracy (Dutton et al. 2011a). Until recently, only a handful of spiral galaxy lenses were known. The best studied being B1600+434 (Jaunsen & Hjorth 1997; Koopmans et al. 1998; Maller et al. 2000) and the "Einstein Cross" 2237+0305 (Huchra et al. 1985; Trott & Webster 2002; Trott et al. 2010). However, since these lenses are bulge-dominated, they are not ideally suited to constrain disk masses.
A number of recent searches for spiral lens galaxies
(Féron et
al. 2009;
Sygnet et
al. 2010;
Treu et al. 2011)
have uncovered several new disk-dominated spiral lenses.
A joint strong lensing and dynamics analysis of the disk-dominated
gravitational lens SDSSJ2141-0001, discovered as part of the SLACS
survey
(Bolton et
al. 2008a),
yields a best fit
=
0.87-0.09+0.05
(Barnabè et
al. 2012),
where
includes both disk and bulge. Since the bulge contributes ~ 30%
of the stellar mass within 2.2 disk scale lengths, the disk is
actually consistent (at the 1σ level) with being sub-maximal.
3.4.6. Two-body Interactions and the Mass of the Local Group
The relative motions of two orbiting bodies, and assumptions about their angular momentum and total energy, may also be used to infer the total mass of that system.
Looking at our own Local Group (LG) of galaxies, the Milky Way and M31 galaxies display largely unperturbed disks suggesting that they are likely on their first passage since having formed. Based on that observation, Kahn & Woltjer (1959) were able to compute the relative motion of the Milky Way and M31 as a two-body problem assuming purely radial infall (zero angular momentum). This method, referred to as the "Kahn-Woltjer timing argument" (TA; see also Binney & Tremaine 2008), led Kahn & Woltjer to measure a total mass for the LG in excess of the reduced mass of M31 and the Milky Way by a factor greater than six, thus calling for a sizeable amount of hitherto undetected intergalactic matter. Sandage (1986b), using a similar argument for the deceleration of nearby galaxies caused by the LG, found a lower value for the maximum mass for the LG, MLG = 5 × 10¹² M⊙, with a best-fit value of 4 × 10¹¹ M⊙. Courteau & van den Bergh (1999) also used various mass estimators to compute MLG = (2.3 ± 0.6) × 1012 M⊙ within 1.2 Mpc. More recently, Partridge et al. (2013) revised the TA for the LG by accounting for a Dark Energy component and finding a total MLG = (6.19 ± 0.56[obs] ± 0.99[sys]) × 1012 M⊙. The systematic error is obtained by testing the TA model against LG-like objects selected from a cosmological simulation. The effect of dark energy is to make the value of MLG roughly 12% larger than similar TA mass estimates that neglect it.
A major limitation of the TA is its reliance on single-galaxy interactions with the Milky Way and assumptions about virialization of the LG (Phelps et al. 2013). The latter implemented a numerical action method, originally developed by Peebles (1989), which takes into account the peculiar motions of a large subset of LG galaxies whilst eliminating the mass degeneracy in the two-body TA. Their method yields estimates of 2.5 - 5.0 × 10¹² M⊙ for the Milky Way and 1.0 - 5.0 × 10¹² M⊙ for M31. If the putative transverse velocity of M31 (van der Marel et al. 2012) is taken into account, the lower bound for the mass of the Milky Way drops from 2.5 × 10¹² M⊙ to 1.5 × 10¹² M⊙ in the 95% confidence region. The transverse velocity of M31 remains somewhat tentative owing to the uncertainty in our own orbit around the Milky Way center.
While the above figures seem high, the action method effectively measures a maximal possible mass for each bound system. Smaller mass estimates will thus be obtained on smaller scales. For instance, independent estimates for the dynamical mass of the Milky Way within 100 kpc range from MMW = (.4-1.4) × 1012 M⊙ (see Section 4, Table 1); likewise for M31 with MM31 = (0.8-1.1) ± 1012 M⊙ within the virial radius R200 = 189-213 kpc, depending on the modeled dark matter distribution (Tamm et al. 2012).
Since this review is mostly concerned with mass estimators for individual galaxies, we do not investigate the mass of the LG further. The TA should however be noted as a method to estimate the mass of the Local Group and/or that of the Milky Way or M31 if one of the other masses is known independently. For more details on modern applications of the TA, see Phelps et al. (2013) and references therein. We review independent mass estimates of the Milky Way in Section 4.
Mass modeling methods will require new constraints to break the disk-halo degeneracies as well as those internal to the halo model. Those may come from other mass estimators (not considered here due to space limits) based on e.g. external tracers such as planetary nebulae, globular clusters, and satellites (e.g. Yegorova et al. 2011). Nonetheless, various independent methods outlined in Section 3 present evidence for the prevalence of sub-maximal disks in most spiral galaxies with:
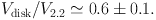 |
(15) |
However, galaxies do come with a range in disk-to-halo masses, with the most massive (Vmax > 200 km s-1), high surface brightness spirals being close to having maximal disks. Almost all other galaxies, 90% of them being of dwarf type, are likely sub-maximal.
The dark matter near the virial radius likely has circular velocity at slightly lower speeds than the inner baryons. By comparing with the rotation velocities within the optical disk, Vopt, one finds from satellite kinematics and weak lensing that on average for late-type galaxies Vopt / V200 ≃ 1.2 (Dutton et al. 2010; Reyes et al. 2011).
Looking ahead, very large kinematical surveys of spiral galaxies will enable a global characterization of rotation curve shapes for thousands of galaxies; e.g. MaNGA ("Mapping Nearby Galaxies at APO"; PI: Kevin Bundy) is a project to collect IFU velocity maps at Apache Point Observatory from 2014-2020 for ~ 10,000 northern galaxies with stellar masses above 109 M⊙ over a full range of gas contents, environments, and orientations. It will cover the range 360-1000 nm at a resolution of about 2500, with an emphasis on spectrophotometric calibration at all wavelengths. On shorter timescales, the Calar Alto Legacy Integral Field Area Survey (CALIFA) will already provide 2D PPAK IFU maps for ~ 600 nearby galaxies (Sánchez et al. 2012). However, a short-coming of the large IFU surveys in progress and planned is their low spectral resolution. This will not enable measurements of disk velocity dispersions except in the inner regions where disentangling effects of the bulge kinematics will make interpretation difficult without more sophisticated analysis methods. One such method is the "Jeans Anisotropic Multi-Gaussian Expansion" described in detail in Section 5.3.3, although it will need to be augmented to consider the effects of dust extinction. CALIFA, and particularly MaNGA, will still truly refine our definition of velocity fields and the stellar populations in galaxies. Large samples of interferometric data will also be needed to extract velocity fields homogeneously for comparisons with optical velocity fields. This will be addressed by upcoming HI surveys with SKA pathfinders, notably WALLABY on ASKAP and its northern counterpart on WSRT. These projects may span ~ 5 years or more.
Despite the extensive new galaxy dynamics data bases, the rigorous separation of baryonic and dark matter profiles in galaxies will require accurate stellar M / L*'s from stellar population models and/or dynamical measurements (e.g. Eq. 14) as well as precise constraints from ΛCDM structure formation models to resolve the many degeneracies between the luminous and dark matter components.
3 The fastest reported galaxy "disk" is that of UGC 12591, an S0/Sa galaxy rotating at 500 km s-1and having a total mass within R25 equal to 1.4 × 10¹² M⊙ (H0 = 70 km s-1Mpc-1) Giovanelli et al. (1986). Considering its X-ray emission and surprisingly low baryon mass fraction 3-5%; Dai et al. (2012), this galaxy is likely a massive spheroid that has accreted its, now rotating, neutral gas after assembling most of its stellar mass. The late merger/accretion event that formed the disk of UGC 12591 may have also turned on a massive outflow to drive its gas halo out to very large radii. As such, UGC 12591 should clearly not be compared against normal spiral galaxies. Back.
4 Clearly, the issue of extinction is less conspicuous in nearly face-on systems Andersen et al. (2006). Back.
5 These authors advocate using r V(r) as the adiabatic invariant, instead of the usual r M(r) invariant, since disks are not spherical. Note also that the algorithm for compression due to adiabatic infall in a spherical halo model may take a different form when random motions are accounted for Sellwood & McGaugh (2005). Back.
6 The fact that barred and unbarred galaxies share the same Tully-Fisher relation Courteau et al. (2003) reflects that the angular momentum transferred from the bar to the halo is relatively small and easily absorbed by the halo. Thus, bars of all strengths belong to the same Tully-Fisher relation, as found in Sheth et al. (2012). Back.