NED Holdings
Holdings: Graphics
Sky Density
- Figure 1
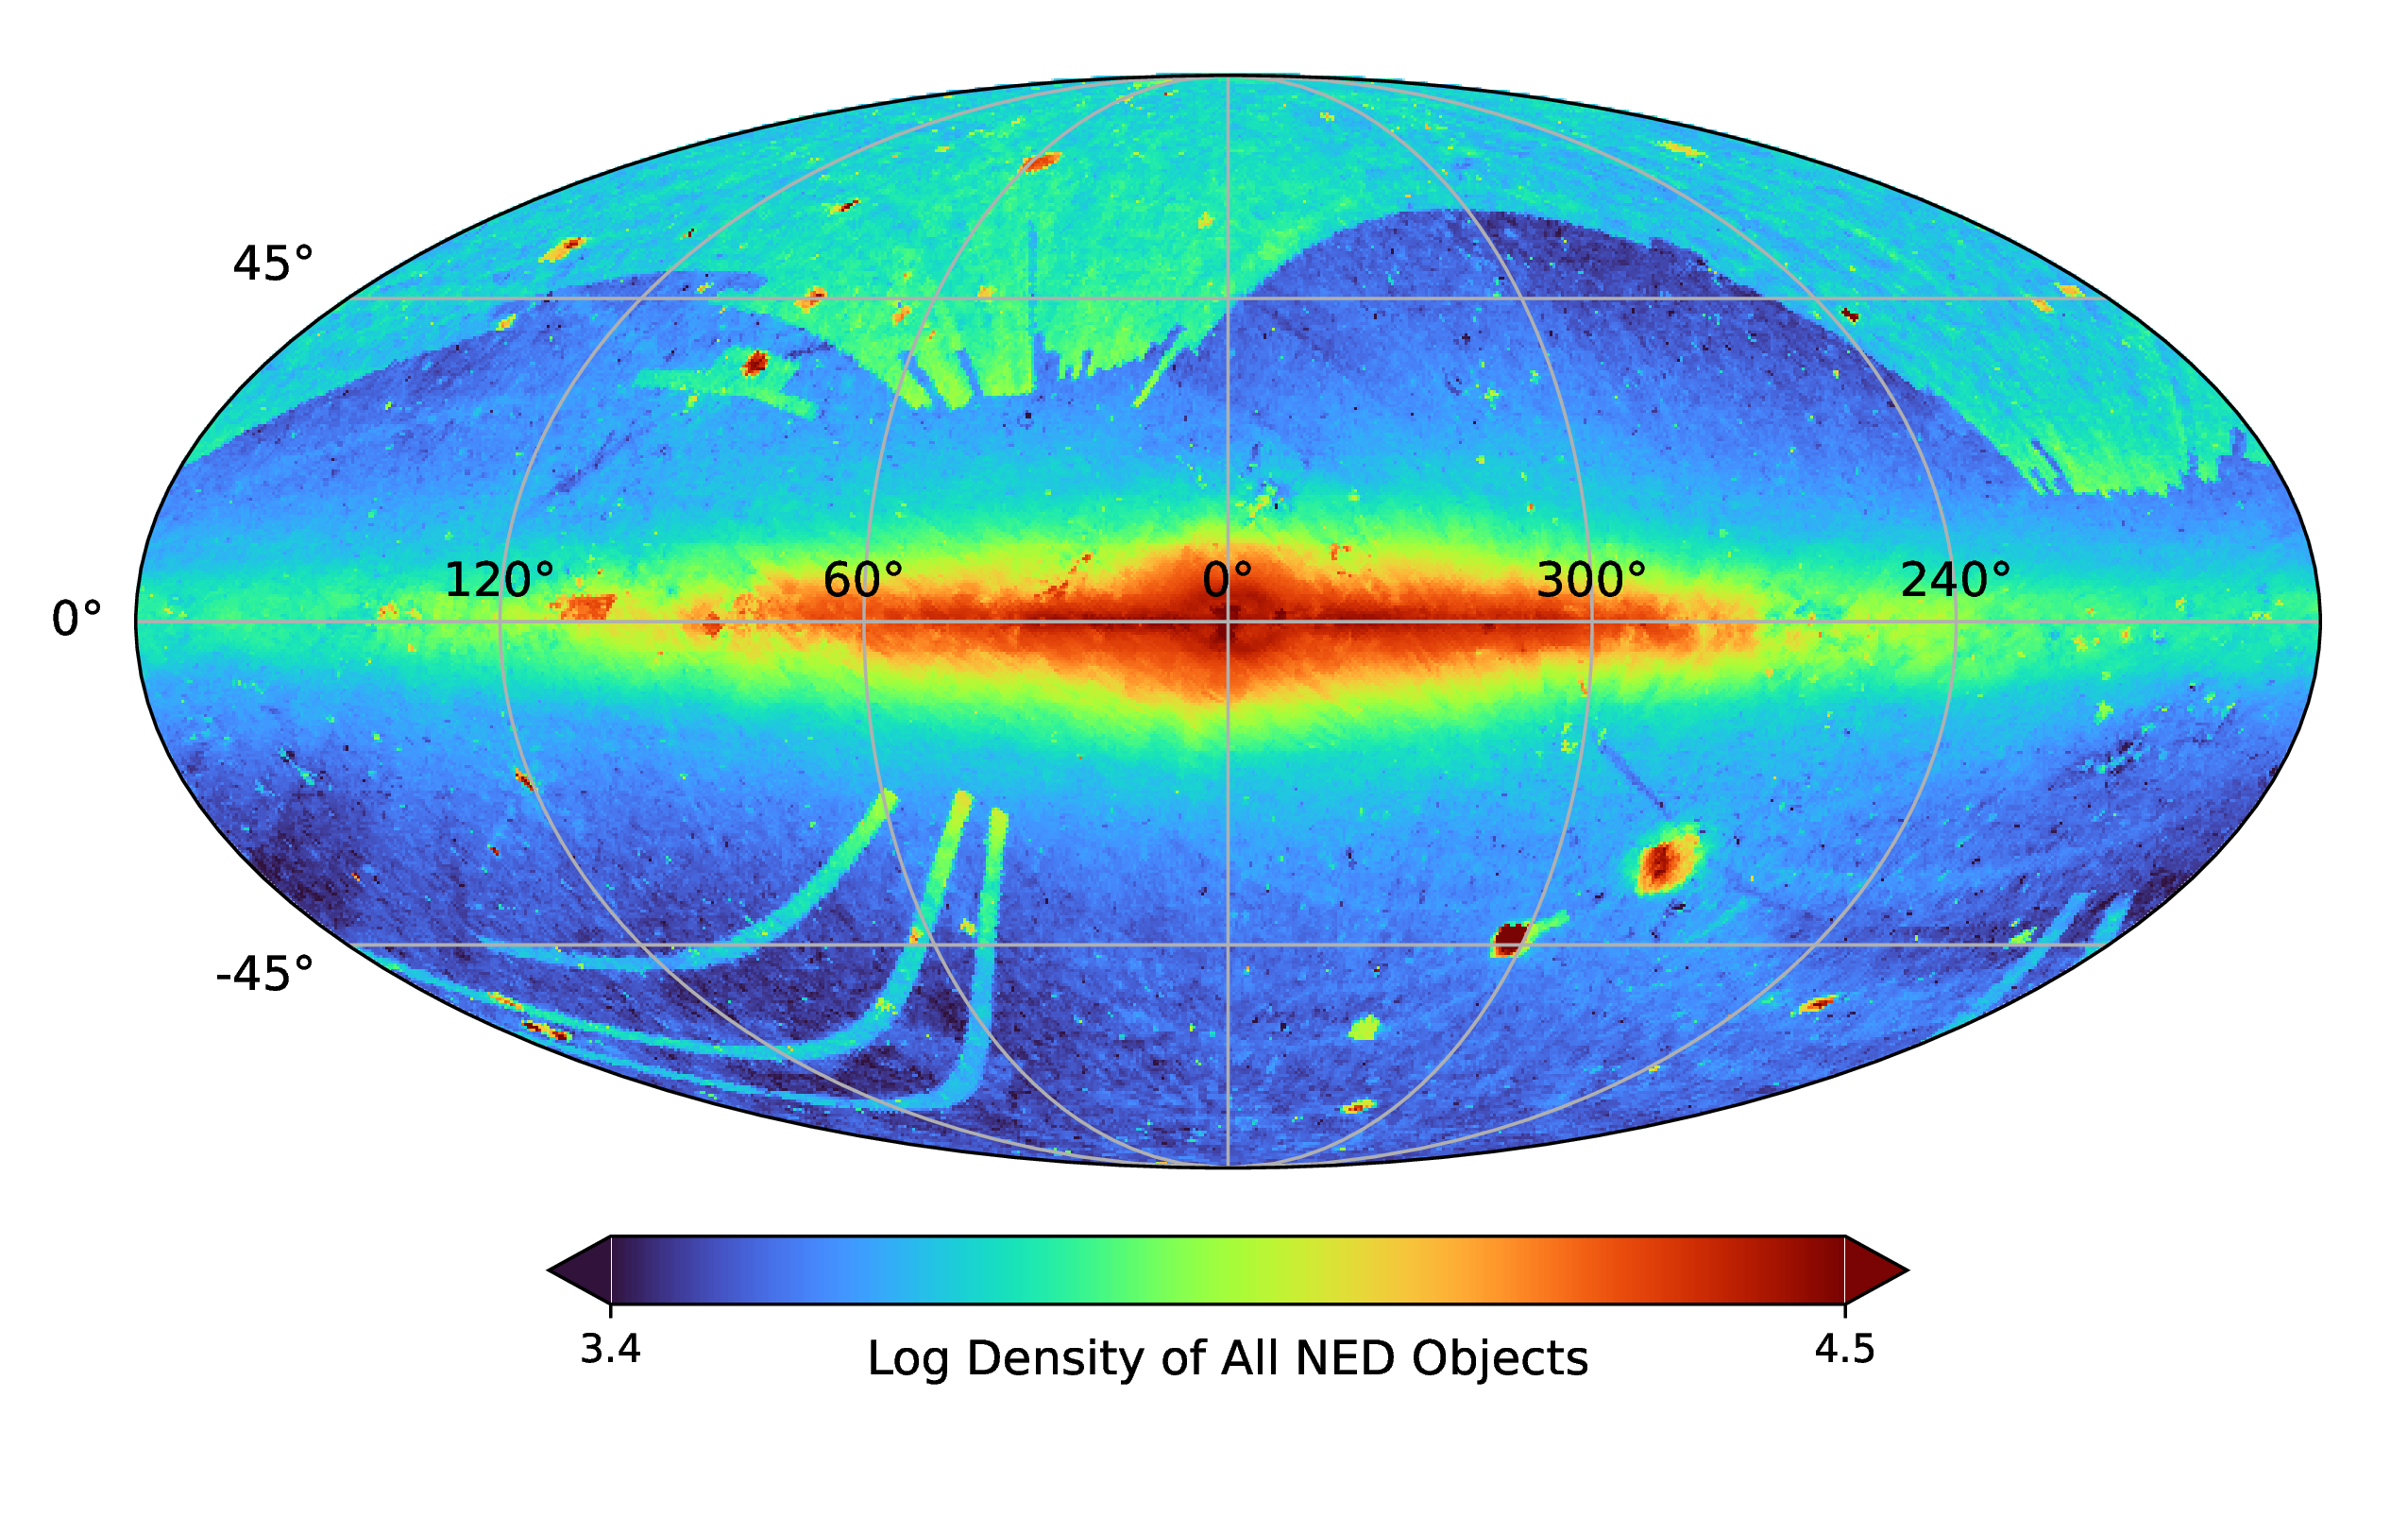
- Distribution of 1.1 billion distinct objects on the sky as of October 2025 plotted in Galactic coordinates.
- Figure 2
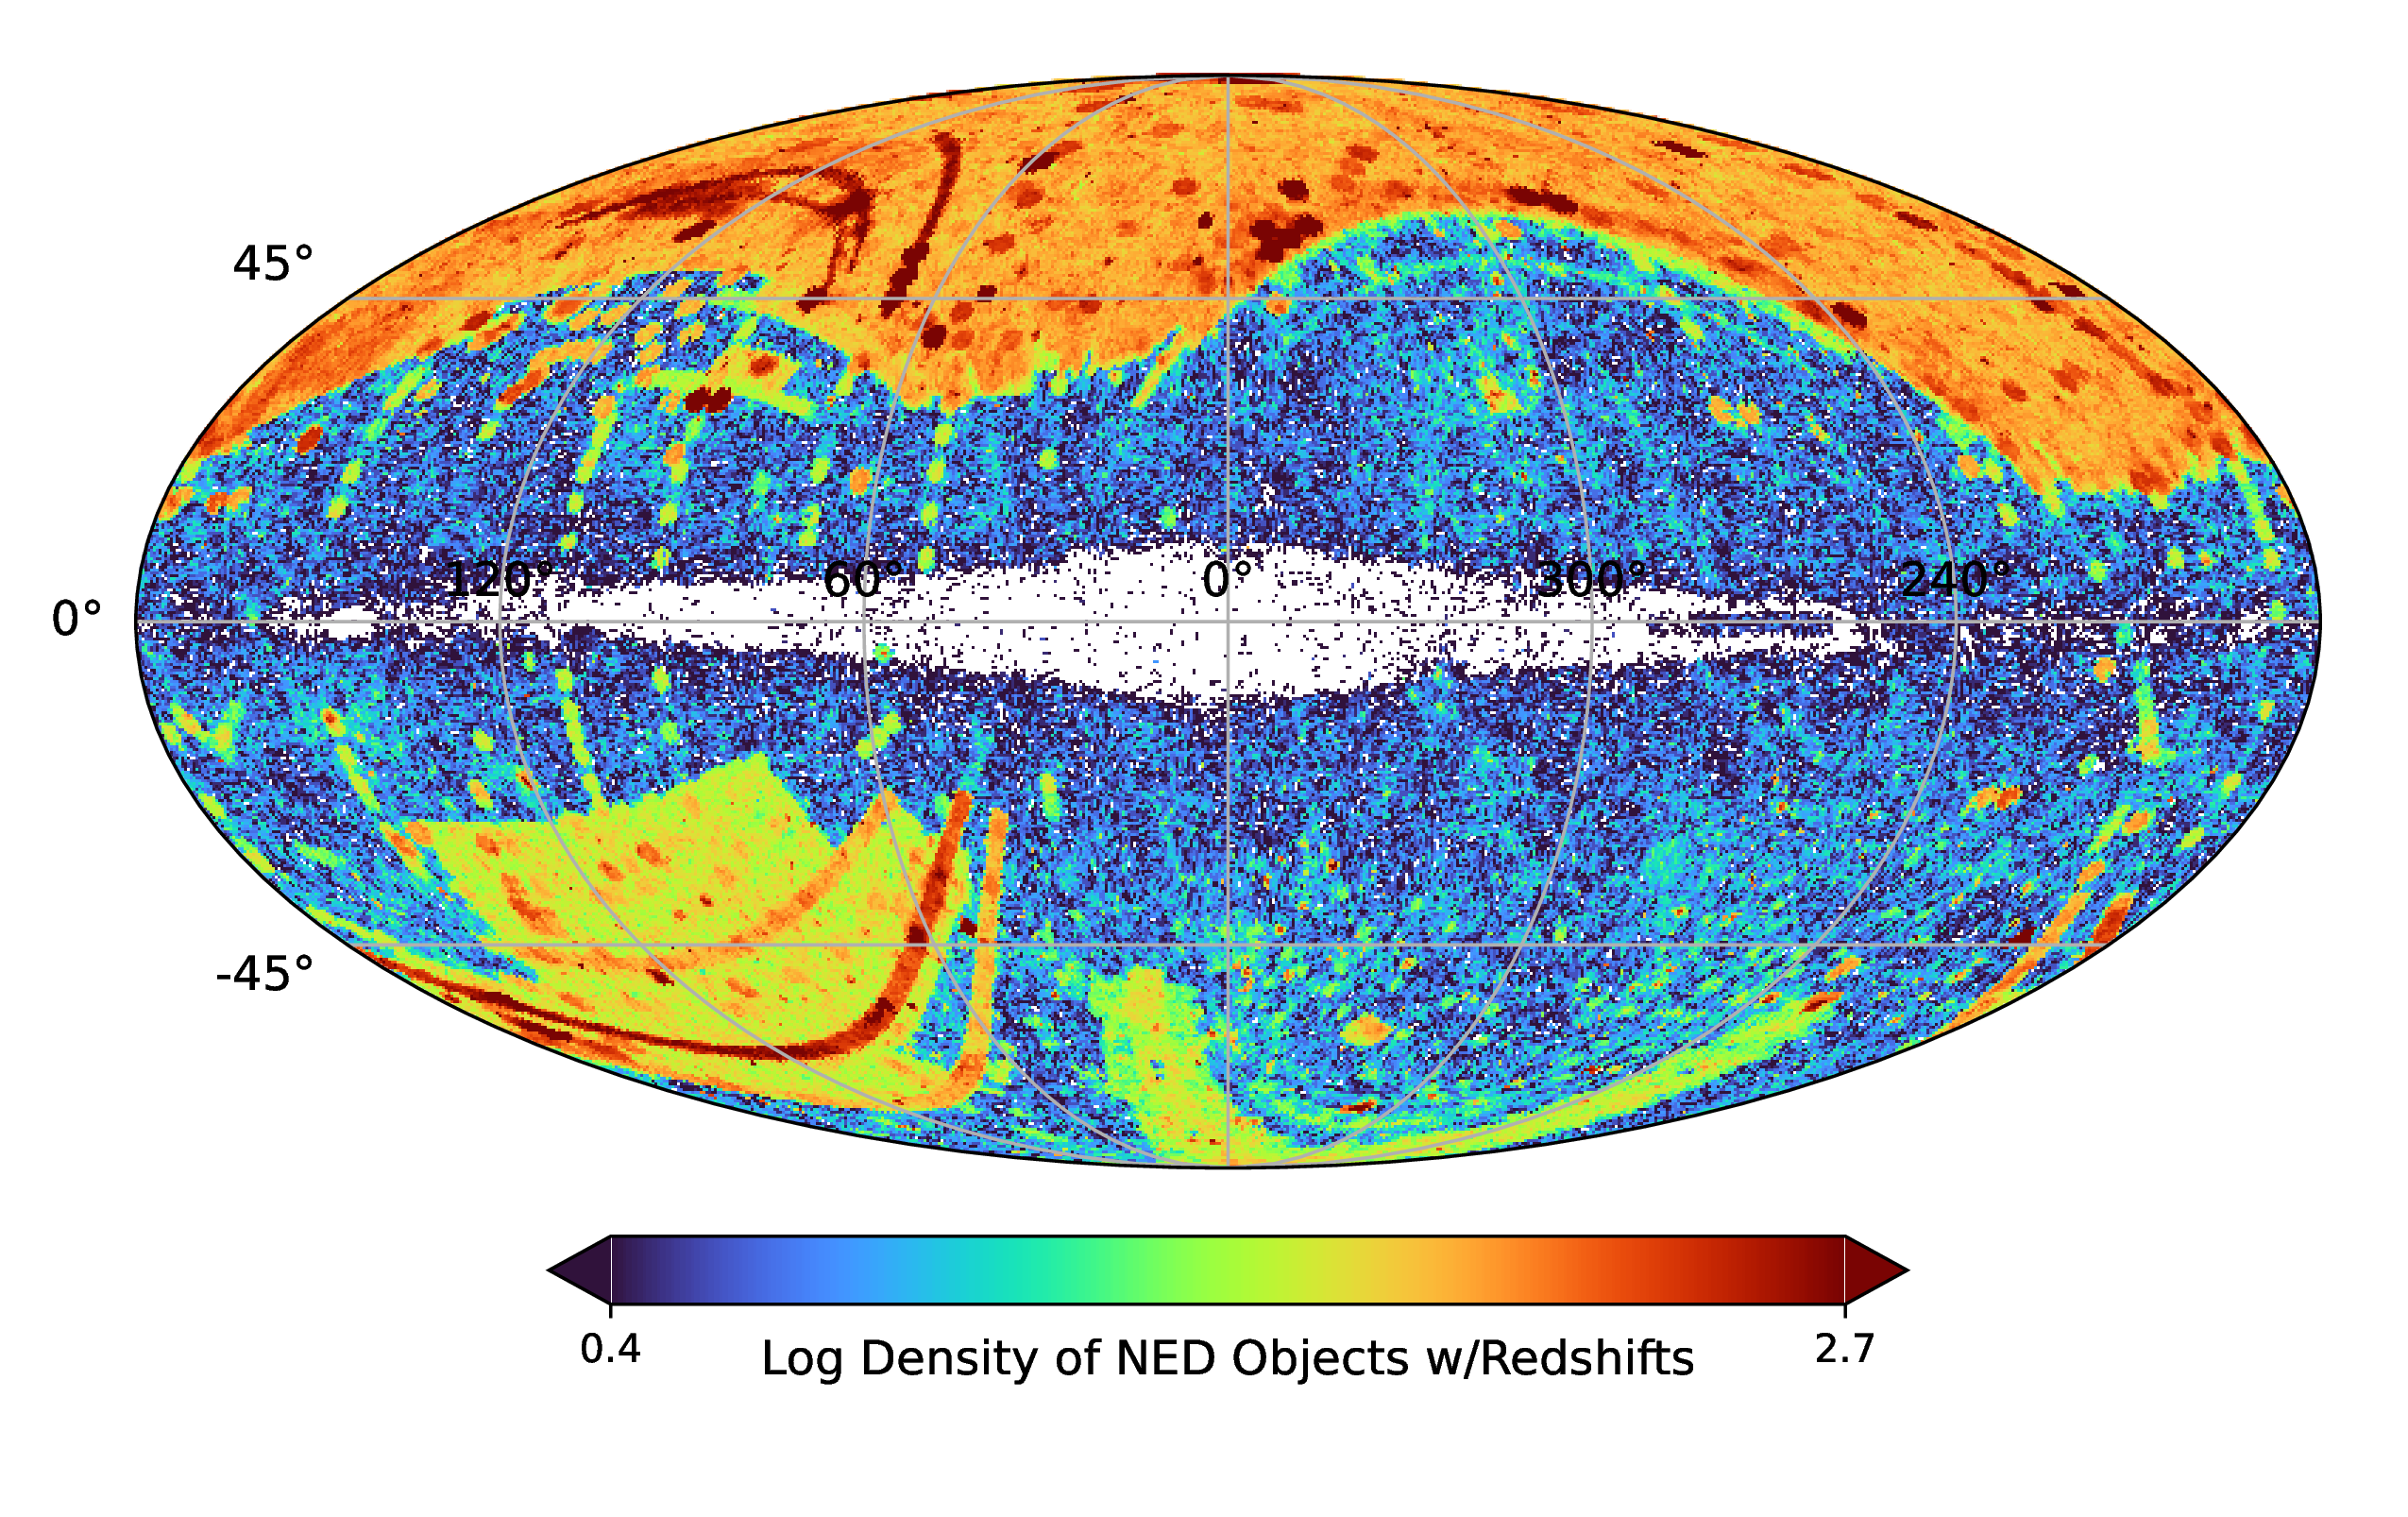
- Distribution of 11.1 million distinct objects in NED that have at least one redshift measurement as of October 2025 plotted in Galactic coordinates.
Redshift Distribution
- Figure 3
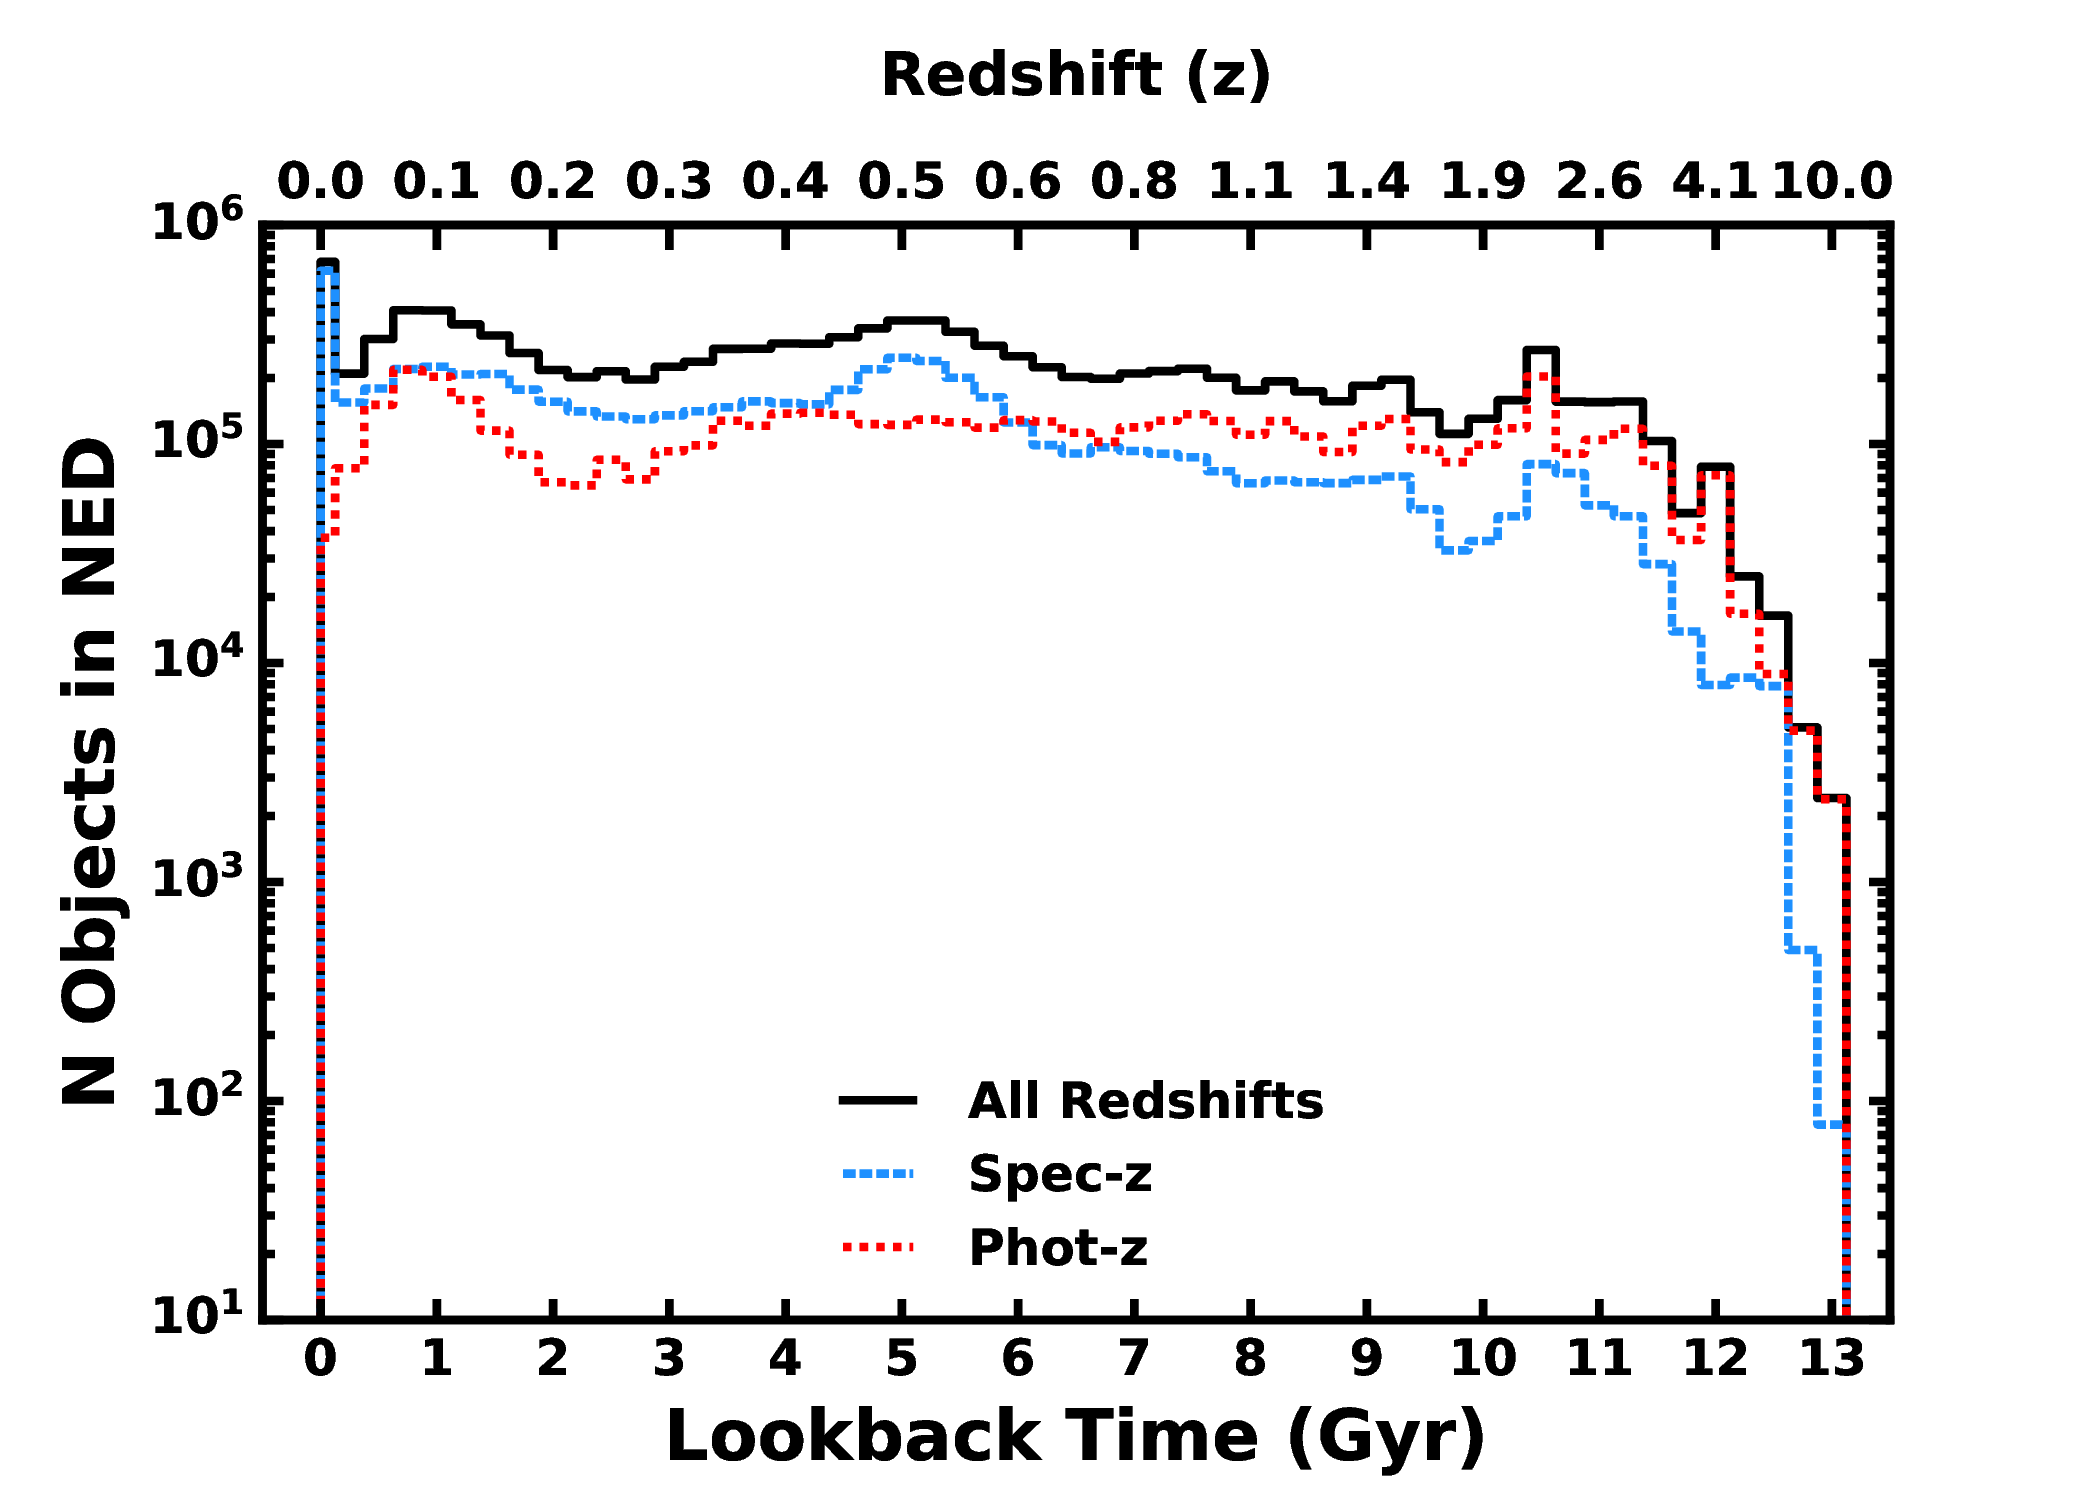
-
The spectroscopic and photometric redshift (look-back time) distributions of NED objects as of October 2025.
Completeness of Redshifts in NED
To estimate the completeness of the galaxy census per unit volume, we utilize a subsample of ∼2 million objects in NED with distances out to 1000 Mpc called the NED Local Volume Sample (NED-LVS; Cook et al. 2023). We define completeness as the ratio of the total luminosities of galaxies to the total luminosity expected from integrating under published galaxy luminosity functions. The completeness relative to NIR luminosities (which traces a galaxy's stellar mass) is roughly 100% at D<30 Mpc and remains moderate (70%) out to 300 Mpc. For brighter galaxies (>Lstar), NED-LVS is ∼100% complete out to 400 Mpc. The Figures below give the completeness as a function of distance and the density of NED-LVS objects in distance shells where completeness in the shell is given in parentheses. See the NED-LVS webpage for more details.
- Figure 4: All-sky density plots of NED objects in equatorial (J2000) coordinates
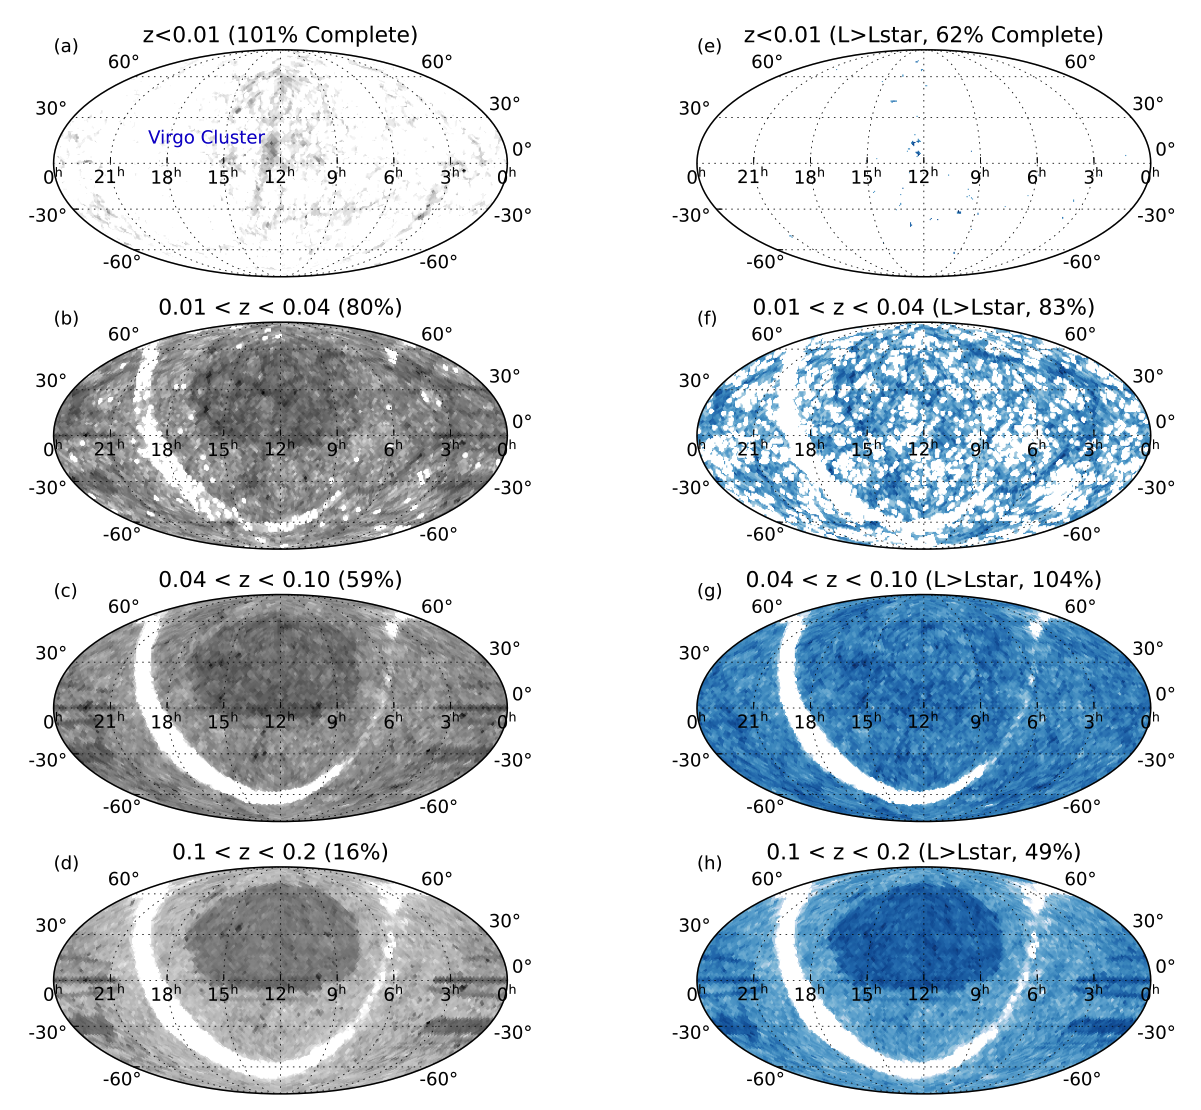
- The left column presents objects with no luminosity cut and the right column presents objects with Ks-band luminosity greater than Lstar. Each row shows the objects in redshift shells: z<0.01 (D<40 Mpc), 0.01<z<0.04 (40<D<180 Mpc), 0.04<z<0.10 (180<D<460 Mpc), and 0.1<z< 0.2 (460<D<1000 Mpc), where the percentages in parentheses provide the completeness of objects in each shell. The HEALPix maps have a 2 deg2 resolution for each pixel. The artificial patterns (survey footprints) seen in panels with low completeness (c, d, and h) suggest that studies of galaxy environment or large scale structure should exercise caution when interpreting results.
- Figure 5: Completeness of NED-LVS
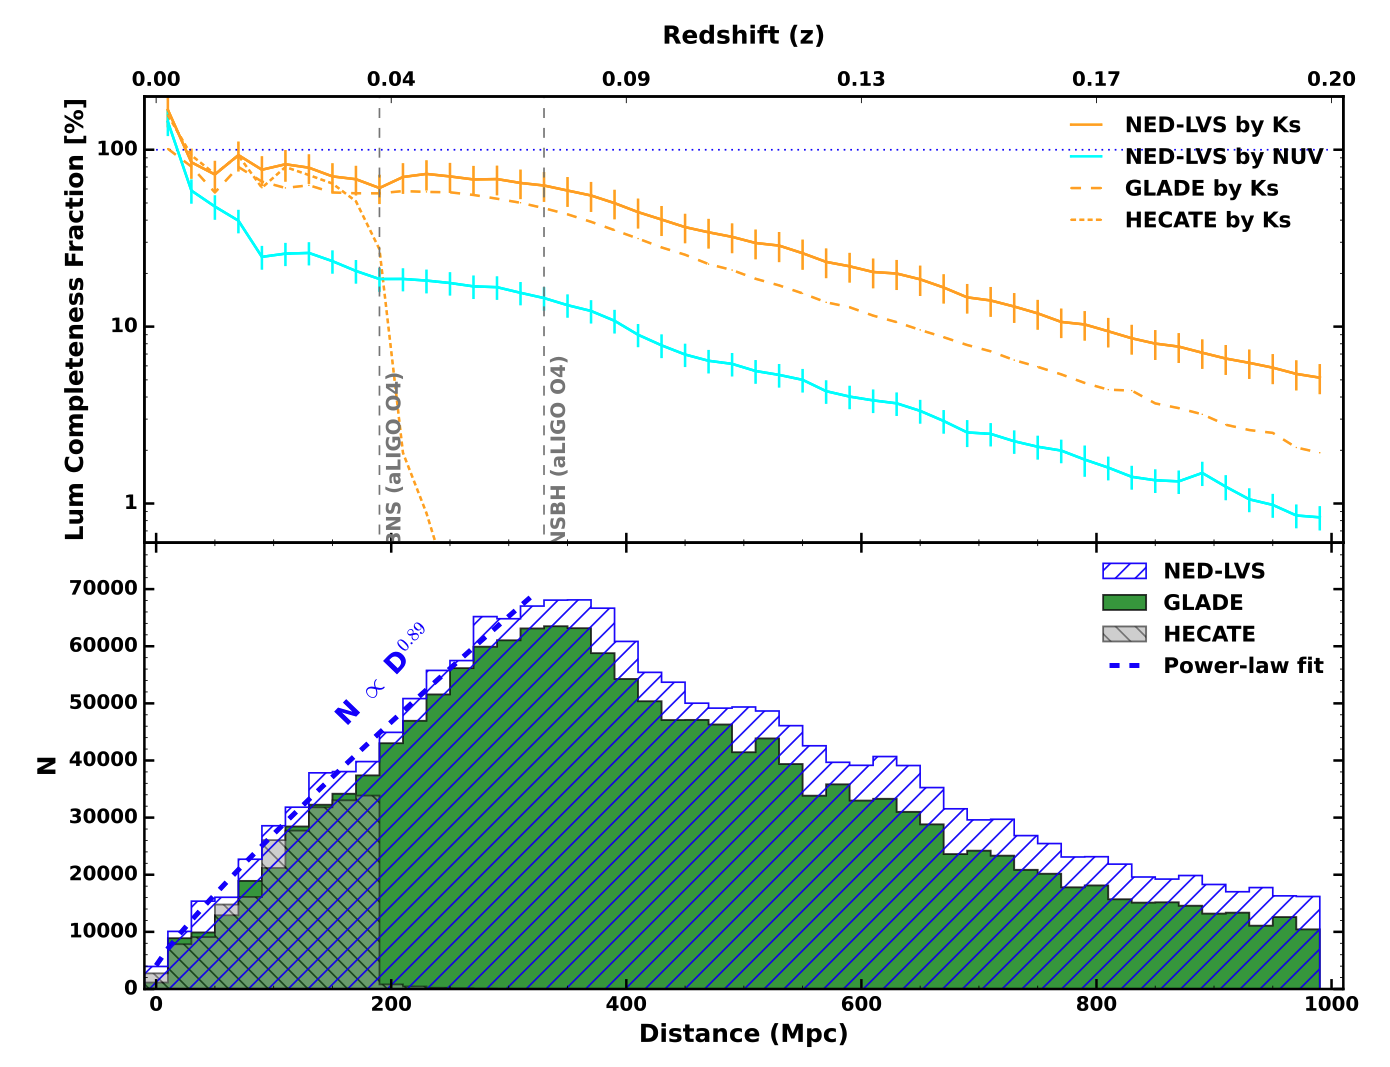
- Top Panel: The completeness of the NED-LVS catalog as defined by the fraction of luminosity in available bands from 2MASS-Ks (orange) and GALEX-NUV (cyan) to the total luminosity derived from published luminosity functions: NUV from
Wyder et al. 2005 and Ks from
Jones et al. 2006. We find that NED-LVS in the NIR is highly complete at distances less than 30 Mpc and remains moderately (70%) complete out to 300 Mpc. We also find that NED-LVS is less complete in the UV filters. The completeness of NED-LVS drops slowly past 300 Mpc to ∼1% at 1000 Mpc. Bottom Panel: The distance histogram of both NED-LVS, GLADE, and HECATE. The number growth for NED-LVS rises linearly as quantified by an power-law fit to the data out to the peak of the histogram at D∼350 Mpc (N∝D1).
Large Data Sets in NED
More information and graphics are available for some of the largest data sets in NED.