


4.6. X-ray-optical correlations
A number of correlations between the optical and X-ray properties of
clusters have been found
(Bahcall, 1977a).
The optical cluster properties that have been
used to study X-ray clusters include the richness
(Section 2.3), morphology (RS
or BM type; Section 2.5),
the galactic content (cD galaxies and spiral
fractions; Section 2.10),
the core radius rc (or other radii;
Section 2.7),
the velocity dispersion
 r
(Section 2.6), and the central galaxy density
r
(Section 2.6), and the central galaxy density
 0 of
Bahcall (1977b;
Section 2.7). The largest X-ray surveys
(Section 4.2)
provide only X-ray fluxes (and thus luminosities Lx)
for a given
X-ray photon energy range. In addition, there are now smaller samples of
clusters with X-ray surface brightness determinations, giving
rx or
0 of
Bahcall (1977b;
Section 2.7). The largest X-ray surveys
(Section 4.2)
provide only X-ray fluxes (and thus luminosities Lx)
for a given
X-ray photon energy range. In addition, there are now smaller samples of
clusters with X-ray surface brightness determinations, giving
rx or
 (Section 4.4),
and samples with X-ray spectra, yielding Tg and
EI (Section 4.3).
(Section 4.4),
and samples with X-ray spectra, yielding Tg and
EI (Section 4.3).
Solinger and Tucker
(1972)
first suggested that the X-ray luminosity of a
cluster correlates with its velocity dispersion Lx
 r4,
based on the small sample of known X-ray clusters at that time. This
sample included M87/Virgo, in
which the X-ray emission comes from the galaxy M87 rather than the
entire cluster, and several clusters having multiple velocity components,
which probably cause the velocity dispersion to be overestimated. Solinger
and Tucker gave a simple model to explain the correlation based on the
assumption that the emission comes from intracluster gas. This correlation
has been reexamined a number of times and other explanations of its
physical significance have been given
(Yahil and Ostriker,
1973;
Katz, 1976;
Silk, 1976).
As the sample of X-ray clusters has grown, the correlation
has become less convincing
(McHardy, 1978a),
and certainly there is
a great deal of scatter about any such correlation. However,
Quintana and Melnick
(1982)
find basically the same relationships for larger data
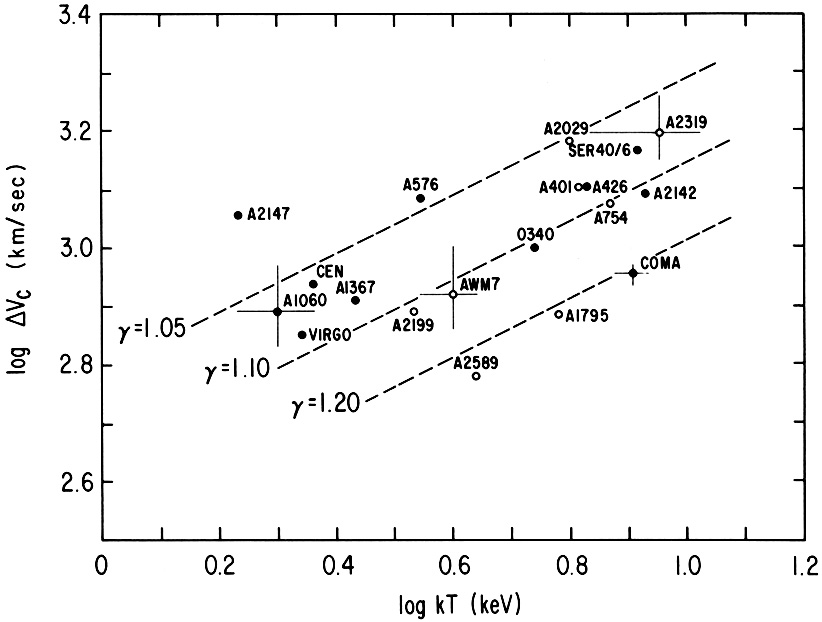
samples from the HEAO-1 and Einstein observatories. Their
relationship for the HEAO-1 data is shown as
Figure 28; roughly, the correlation is
r4,
based on the small sample of known X-ray clusters at that time. This
sample included M87/Virgo, in
which the X-ray emission comes from the galaxy M87 rather than the
entire cluster, and several clusters having multiple velocity components,
which probably cause the velocity dispersion to be overestimated. Solinger
and Tucker gave a simple model to explain the correlation based on the
assumption that the emission comes from intracluster gas. This correlation
has been reexamined a number of times and other explanations of its
physical significance have been given
(Yahil and Ostriker,
1973;
Katz, 1976;
Silk, 1976).
As the sample of X-ray clusters has grown, the correlation
has become less convincing
(McHardy, 1978a),
and certainly there is
a great deal of scatter about any such correlation. However,
Quintana and Melnick
(1982)
find basically the same relationships for larger data
samples from the HEAO-1 and Einstein observatories. Their
relationship for the HEAO-1 data is shown as
Figure 28; roughly, the correlation is
| (4.8) |
For the lower energy Einstein observations, the power in equation (4.8) is closer to three (Quintana and Melnick, 1982; Abramopoulos and Ku, 1983).

|
Figure 28. The correlation between the X-ray luminosity of clusters observed with HEAO-1 A-2 and their line-of-sight velocity dispersion, from Quintana and Melnick (1982). |
In some sense, the richness of a cluster (the number of galaxies in the cluster) and Lx measure the mass of stars and of diffuse gas in the cluster, respectively, and one might expect these to be related. Such a relationship does indeed appear in the data (Bahcall, 1974b; Jones and Forman, 1978; McHardy, 1978a; McKee et al., 1980; Ulmer et al., 1981; Abramopoulos and Ku, 1983; Johnson et al., 1983). It is difficult to give a quantitative measure of the correlation because the richness class 0 clusters are incomplete in the Abell catalog, Abell richnesses are binned in the original catalog, and the higher richness clusters are generally more distant. Abramopoulos and Ku (1983) find that the low energy X-ray luminosity increases with richness to the 1.2 power. Recently this correlation has been shown to extend to the very richest Abell clusters by Soltan and Henry (1983; see also Pravdo et al., 1979). Low luminosity X-ray clusters are much less common among the richest clusters.
There appears to be a correlation between the optical morphology and X-ray luminosity of clusters. Bahcall (1974b), Owen (1974), Mushotzky et al. (1978), McKee et al. (1980), and Abramopoulos and Ku (1983) found that the more regular Rood-Sastry types (cD, B) in general have higher X-ray luminosities than the less regular clusters. The reality of this correlation has been disputed by Jones and Forman (1978) and Lugger (1978), although it does appear in the larger HEAO-1 and Einstein data samples. Bautz-Morgan type I clusters are found to be more luminous than the less regular clusters, although the correlation does not seem to continue to less regular BM types (McHardy, 1978a; McKee et al., 1980; Ulmer et al., 1981; Abramopoulos and Ku, 1983; Johnson et al., 1983). Clusters that contain optically dominant galaxies near the cluster center tend to be stronger X-ray sources those those that do not (BBahcall, 1974b; Jones and Forman, 1984). (In the Jones-Forman classification scheme these are XD clusters; see Section 4.4).
Jones and Forman (1978) have argued that all of these X-ray-optical correlations are due to the correlation of X-ray luminosity and richness plus the tendency of rich clusters to be more regular (lower BM type, etc.). As the sample of X-ray clusters has enlarged, it has become possible to test this possibility by considering subsamples of fixed richness, and correlations with optical morphology appear in these samples as well (e.g., McHardy, 1978a).
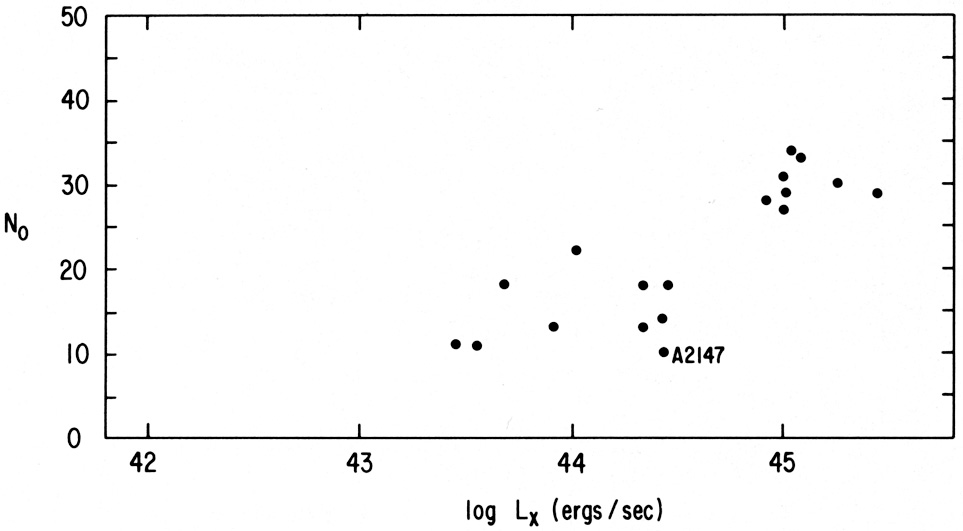
Bahcall (1977b)
showed that the X-ray luminosity of clusters was
well-correlated with the projected central galaxy density parameter
0
(Section 2.7). This correlation is
tighter than the richness correlation; an explanation of
this may be that thermal X-ray emission depends on the square of the
density of
the gas, and thus is most sensitive to the deepest portion of the
cluster potential. This correlation has been confirmed by
Mushotzky et al.
(1978),
Mitchell et al.
(1979),
Abramopoulos and Ku
(1983),
and Mushotzky (1984).
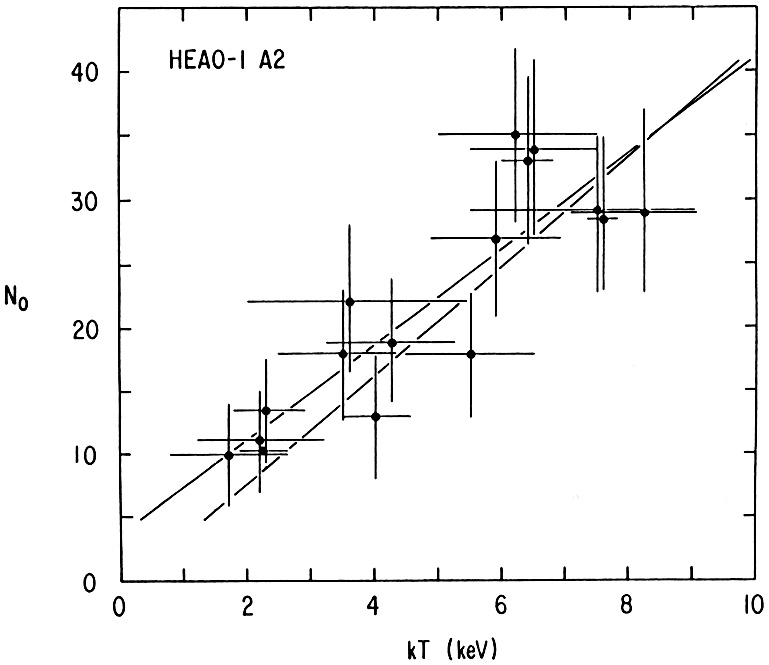
The correlation in the HEAO-1 A-2 sample
(Figure 29) is consistent with
Lx
(0)3.5, and is one power weaker in the lower
energy Einstein sample.
|
Figure 29. The relationship between the X-ray luminosities of clusters observed with HEAO-1 A-2 and the central galaxy density N0 of Bahcall (1977b), from Mushotzky (1984). |
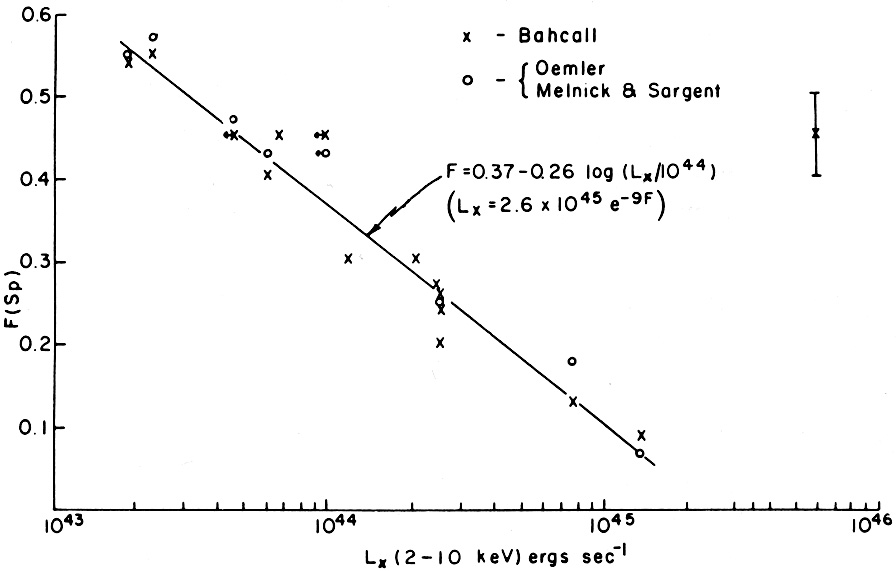
Bahcall (1977c) showed that the X-ray luminosity of a cluster correlated with its galactic content, in that luminous X-ray clusters generally have a small proportion of spiral galaxies. This correlation has been confirmed by McHardy (1978a), Mushotzky et al. (1978), Tyler and Vidal (1979), and Abramopoulos and Ku (1983). Melnick and Sargent (1977) showed that the spiral fraction increased with radius in X-ray clusters, and that the spiral fraction was inversely correlated to the velocity dispersion. These correlations are consistent with the theory that spiral galaxies formed in clusters are stripped of their gas content through interactions with the intracluster gas and become S0 galaxies (Sections 2.10.2 and 5.9), although they certainly do not prove that this has occurred. Let fSp be the fraction of cluster galaxies that are spirals. This spiral fraction is plotted against the X-ray luminosity of clusters in Figure 30. Bahcall (1977c) showed that the correlation could be represented as
| (4.9) |
which she derived based on a simple model for stripping of spirals in a
cluster. An important counterexample to this correlation is A194, which has a low
spiral fraction fSp
 0.27
(Oemler, 1974;
Dressler, 1980a).
Yet this cluster has a very low X-ray luminosity
(Jones and Forman, 1984)
and low velocity dispersion,
which make it unlikely that the spirals were stripped by the ram pressure of
intracluster gas.
0.27
(Oemler, 1974;
Dressler, 1980a).
Yet this cluster has a very low X-ray luminosity
(Jones and Forman, 1984)
and low velocity dispersion,
which make it unlikely that the spirals were stripped by the ram pressure of
intracluster gas.
|
Figure 30. The correlation between the spiral fraction in clusters and their X-ray luminosity, from Bahcall (1977c). The line shows the relation from equation (4.9). |
Kellogg and Murray
(1974)
suggested a correlation between the sizes of the
X-ray sources in clusters and the galaxy core radii,
rx
2rc, but very
few clusters have accurately determined galaxy core radii
(Section 2.7).
Ulmer et al.
(1981)
found that the X-ray luminosity of clusters in the
HEAO-1 A-1 survey correlated with the cluster radius
RLV as given by Leir and van den Bergh
(1977;
Section 2.7), with Lx
RLV2. This
correlation was confirmed in the Einstein data by
Abramopoulos and Ku
(1983).
The OSO-8, Ariel 5, and HEAO-1 A-1 spectral surveys established a number of correlations between the X-ray spectral parameters and the optical properties of X-ray clusters (Mitchell et al., 1977, 1979; Mushotzky et al., 1978; Smith et al., 1979a; Mushotzky 1980, 1984). The two properties that can be derived most easily from a continuum X-ray spectrum are the gas temperature Tg and the emission integral EI (equation 4.3). The X-ray luminosity of a cluster is proportional to EI (equation 4.11).
An important correlation was found between the gas temperatures Tg, determined from the X-ray spectra, and the velocity dispersion of the galaxies in the cluster (see Section 2.6). The older surveys (Mushotzky et al., 1978; Mitchell et al., 1979; Smith et al., 1979a) had found that, when cD clusters were excluded, the temperatures varied roughly as
| (4.10) |
As will be demonstrated in Section 5.5,
such a correlation would be expected
if the gas were gravitationally bound to the cluster, because the velocity
dispersion measures the depth of the cluster potential (equation
2.24). Moreover, this correlation between Tg and
r2
supported the view that clusters must
contain large masses of unseen material (the missing mass problem,
Section 2.8).
The fact that the galaxy and gas velocity dispersions were similar and
proportional to one another suggested that both gas and galaxies were
bound by the same gravitational potential, which required a very large
mass for the cluster. The cD clusters showed less of a correlation,
which may indicate that in these systems there is a significant amount
of gas bound to the cD itself, rather
than to the entire cluster. Unfortunately, the HEAO 1 A-2 data do not
show a very tight correlation and give Tg
r
(Mushotzky, 1984;
Figure 31).
|
Figure 31. The relationship between gas
temperatures derived from X-ray
spectral observations with HEAO-1 A-2 and the central velocity dispersion
( |
The gas temperature correlates strongly with the central density
0 of
Bahcall (1977b),
with Tg
0
(Mushotzky et
al., 1978;
Mitchell et al.,
1979;
Mushotzky, 1984).
This correlation is shown in Figure 32.
|
Figure 32. The correlation between the gas temperatures derived from X-ray spectral measurements with HEAO-1 A-2 and the central galaxy density of Bahcall (1977b), from Mushotzky (1984). |
For thermal bremsstrahlung emission (Section 5.1.3), the emission integral EI, X-ray luminosity Lx, and gas temperature Tg are related by
| (4.11) |
and thus the correlations of Lx and Tg with optical properties imply correlations of EI with these properties as well.
 v
c =
v
c =